Markets have not yet been diagnosed with election fever. 3355 is the new 5000.
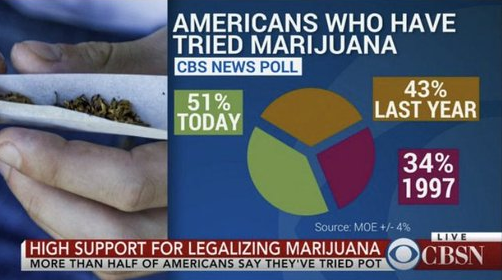
Criminalize pie charts that don’t sum to 100%

Markets have not yet been diagnosed with election fever. 3355 is the new 5000.

Criminalize pie charts that don’t sum to 100%
Long 06SEP 0.6100 NZD put
for around 28 USD pips off 0.6150 spot
There is surprising ennui with regard to the 2024 US Presidential election as the movements in odds are no longer large enough to move the market needle and people just seem bored of trying to handicap the result. It seems weird to me that the rebound in Republican Sweep odds (from 25% in mid-August to 33% now) and a bounce in Trump’s fortunes (he is favored 52/48) have had no market impact.
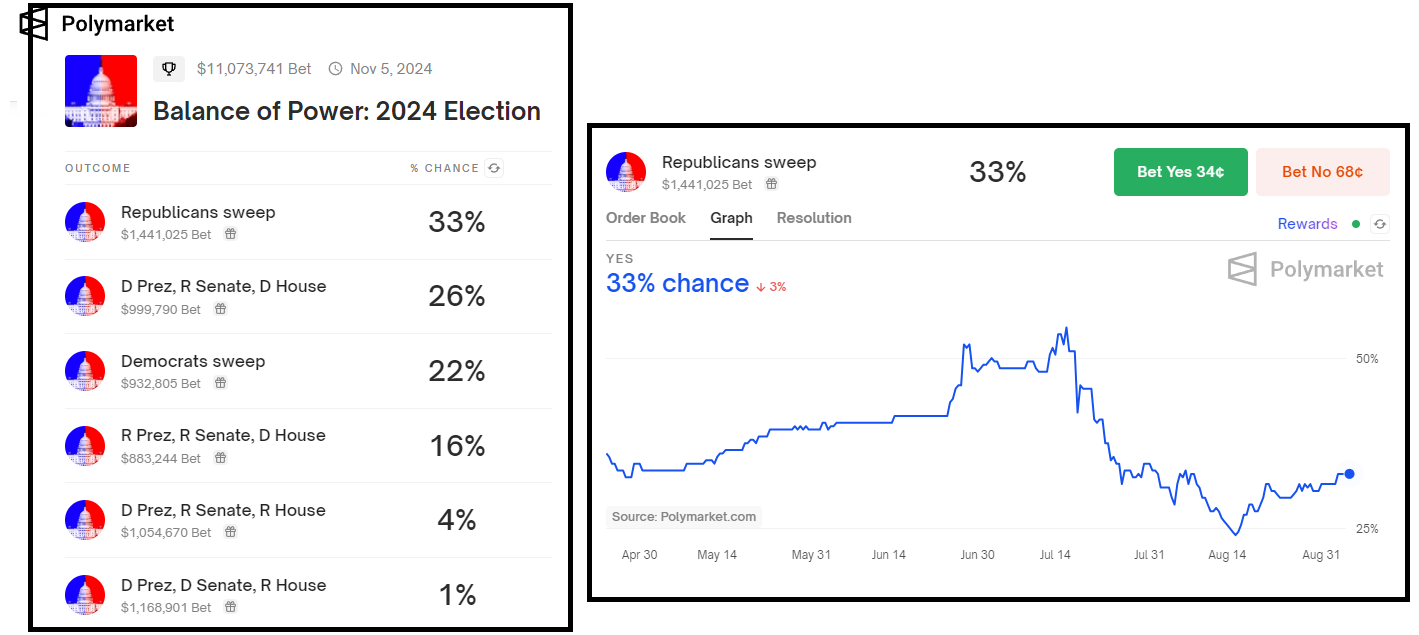
While I am putting this down to fatigue and small movements in odds, it’s also worth noting that even if you knew the outcome of the election, it might not be completely obvious what to do. My lean, and what I thought was the obvious common knowledge, has been that Trump = TCJA renewal, lower tax rates, and stronger fiscal. But the respected gurus at Goldman Sachs (Hatzius, Phillips, Mericle, et al) are saying this:
We estimate that if Trump wins in a sweep or with divided government, the hit to growth from tariffs and tighter immigration policy would outweigh the positive fiscal impulse, resulting in a peak hit to GDP growth of -0.5pp in 2025H2 that abates in 2026. If Democrats sweep, new spending and expanded middle-income tax credits would slightly more than offset lower investment due to higher corporate tax rates, resulting in a very slight boost to GDP growth on average over 2025-2026. If Harris wins with divided government, the effects of policy changes would be small and neutral on net.
So, there you go. The one thing I will say with confidence is that a Republican Sweep is bullish USDCNH. But I am equally confident that nobody cares right now! For the broad USD, my assumption is that a Red Wave would be bullish at first and bearish later on. I suppose we just wait for September 10th. That looming debate event is another factor keeping election excitement curtailed after the huge odds-changing impact of Biden’s June 27 debate debacle.
I have been listening to Ed Zitron’s podcast of late (HT BOSE!) as it offers a nice dose of pessimism to offset the dominant bullish view on AI and big tech. Matt Stoller, the convincing anti-monopoly voice, was on this week and while the entire pod was educational and entertaining, one informational tidbit jumped out. The Wilshire 5000 Index currently houses just 3355 stocks. That’s weird.
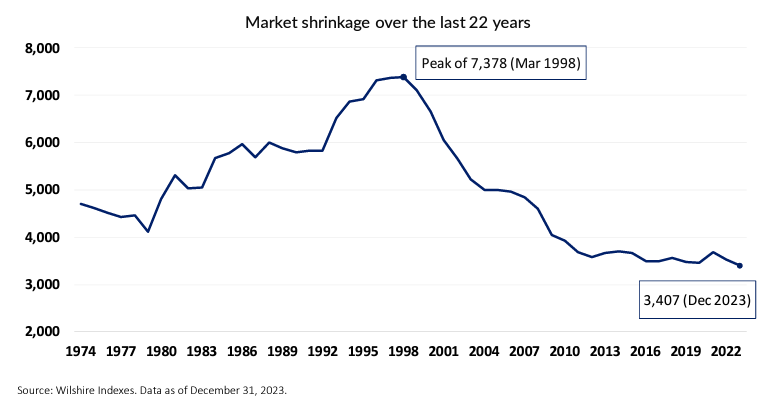
Data is as of 31DEC23… Current figure is 3355
The good folks at Wilshire explain it this way:
There are several drivers behind the shrinkage in investable stocks. As we show in Exhibit 2, the IPO pipeline (supply of new entrants) has contracted significantly since the levels witnessed during the TMT bull market in the late 1990s. In addition, the period of financial repression and accommodative monetary policy post-the-GFC created demand for debt financed buyouts (privatization) and explosive growth in Private Equity fund raising. Finally, the other key dynamic over this period has been the parabolic growth in passive (ETF) investing versus active. By 2018 it was estimated there were 70x more indexes than traded stocks globally. Capturing (differentiated) beta via an index is seen as a bigger opportunity set than stock selection alpha.
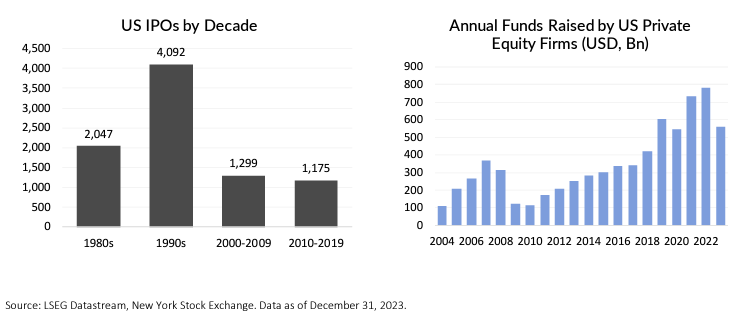
There are basically the exact same number of ETFs in the United States (3,337) as there are investable stocks (3,355). I am pretty sure that is insane.
And while a dearth of IPOs and a flood of private equity money tell some part of the story of the upweighting of US indexes, buybacks and shrinking share counts have also contributed mightily. You can read a detailed report about the FT Wilshire 5000 and the gradual but significant gigantification of the US indexes (including so-called small-cap indexes like the Russell 1000) right here in a report called: Avoid the Size Trap. Therein you will find charts like this one:
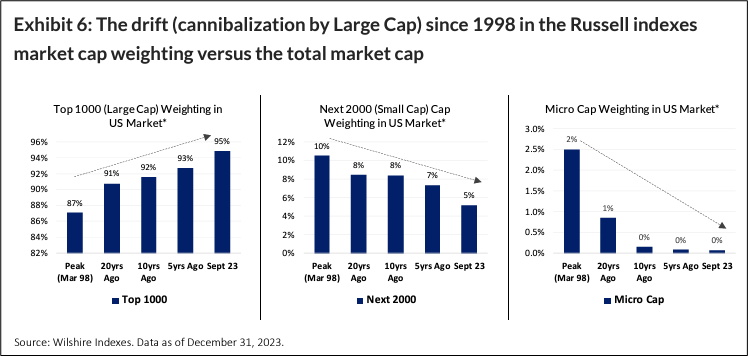
Thank you to Max Leitenberger of Wilshire Indexes for his help in educating me on why the FT Wilshire 5000 is actually the FT Wilshire ~3355. Here is the executive summary of the report:
Changing market dynamics over the last 25 years have generated the size exposure mirage trap for rigid stock count indexes, such as the Russell 1000 and 2000 Market dynamics have changed significantly over the last 25 or so years. Over this period the number of US investable stocks (as defined by the FT Wilshire 5000 index) has almost halved while equities have appreciated over 600%. This has created significant second order effects.
One of the most notable of these is the distortion created by increased large cap concentration. A major stealth risk facing asset allocators is that rigid stock count methodologies such as those utilized by the Russell 1000 and 2000 indexes and others have not adapted to these changing dynamics and have inadvertently generated a size exposure mirage trap. This is where investors think they are gaining a targeted size exposure but are actually receiving a very different and unintended size skew.
This is important because the equity Asset Allocation framework often involves decisions around size segment positioning as this has a direct bearing on risk, return and implementation profiles. We articulate the evolution of the mirage effect, its impact on large and small cap index construction and how the FT Wilshire Index approach is engineered to be adaptive and produce more accurate size capture.
I conducted a fruitless two-hour .xls-fest this morning, trying to find any possible edge on the payrolls release, but came up empty. In my travels around the BLS and CES-related websites, I did stumble upon this informative graphic. If you are newish to economics and / or markets, you might find it useful.
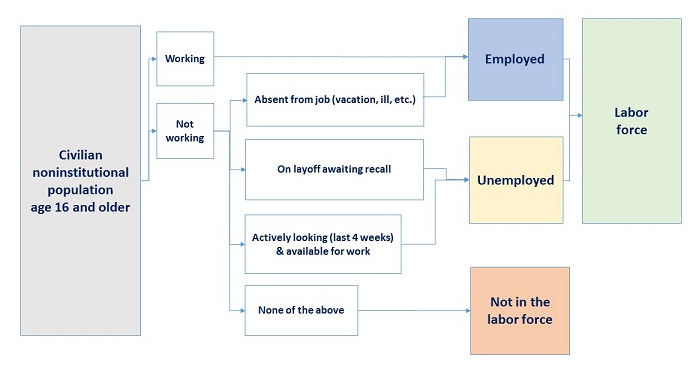
https://www.bls.gov/cps/definitions.htm#joblosers
Yesterday I showed the historically poor performance of stocks from week 36 to week 41 of the year. One intrepid reader asked if this pattern applies if we only look at election years. My sheet only goes back to 2000, so that’s just a sample size of six. But the results do show the same seasonality. I looked at the data four different ways to check for any weirdness. I charted both average and median using all the data, and then excluded 2008. Here you go, Triple V:
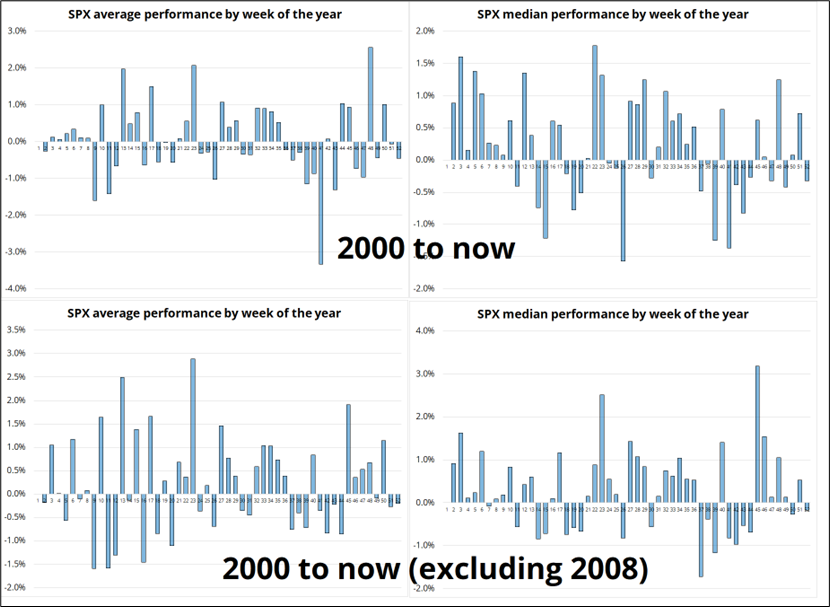
Takeaways:
Hope you stay out of the weeds today.