
Next week is the worst week of the year for stocks in terms of both average return and win%. And tons of crazy things have happened in markets right around the fall equinox.
You have been warned.

Next week is the worst week of the year for stocks in terms of both average return and win%. And tons of crazy things have happened in markets right around the fall equinox.
You have been warned.

My exit off I-95
September 16, 2022
If you go deep into the more esoteric finance websites, you will find all sorts of stuff about lunar cycles, seasonal geomagnetic activity variations, solar activity, and other potential causes of changes in human behavior that might explain seasonal variations in the stock market. This is the peak time of year for those sorts of websites as there is evidence that the fall equinox is a brutal time of year for stocks.
This chart shows the rolling probability of stocks being up in each 3-day period from the start of the year to the end. The bars are difference from 50%, so you can see bullish days (above) and bearish days (below). To explain clearly: If a bar says “+20%” that means stocks were up 70% of the time in that three-day period (70% minus 50%). I am looking back to 1990, so there are around 23 or 24 of each day in the sample. Far left is January 2 (stock market not open January 1) and far right is December 31.
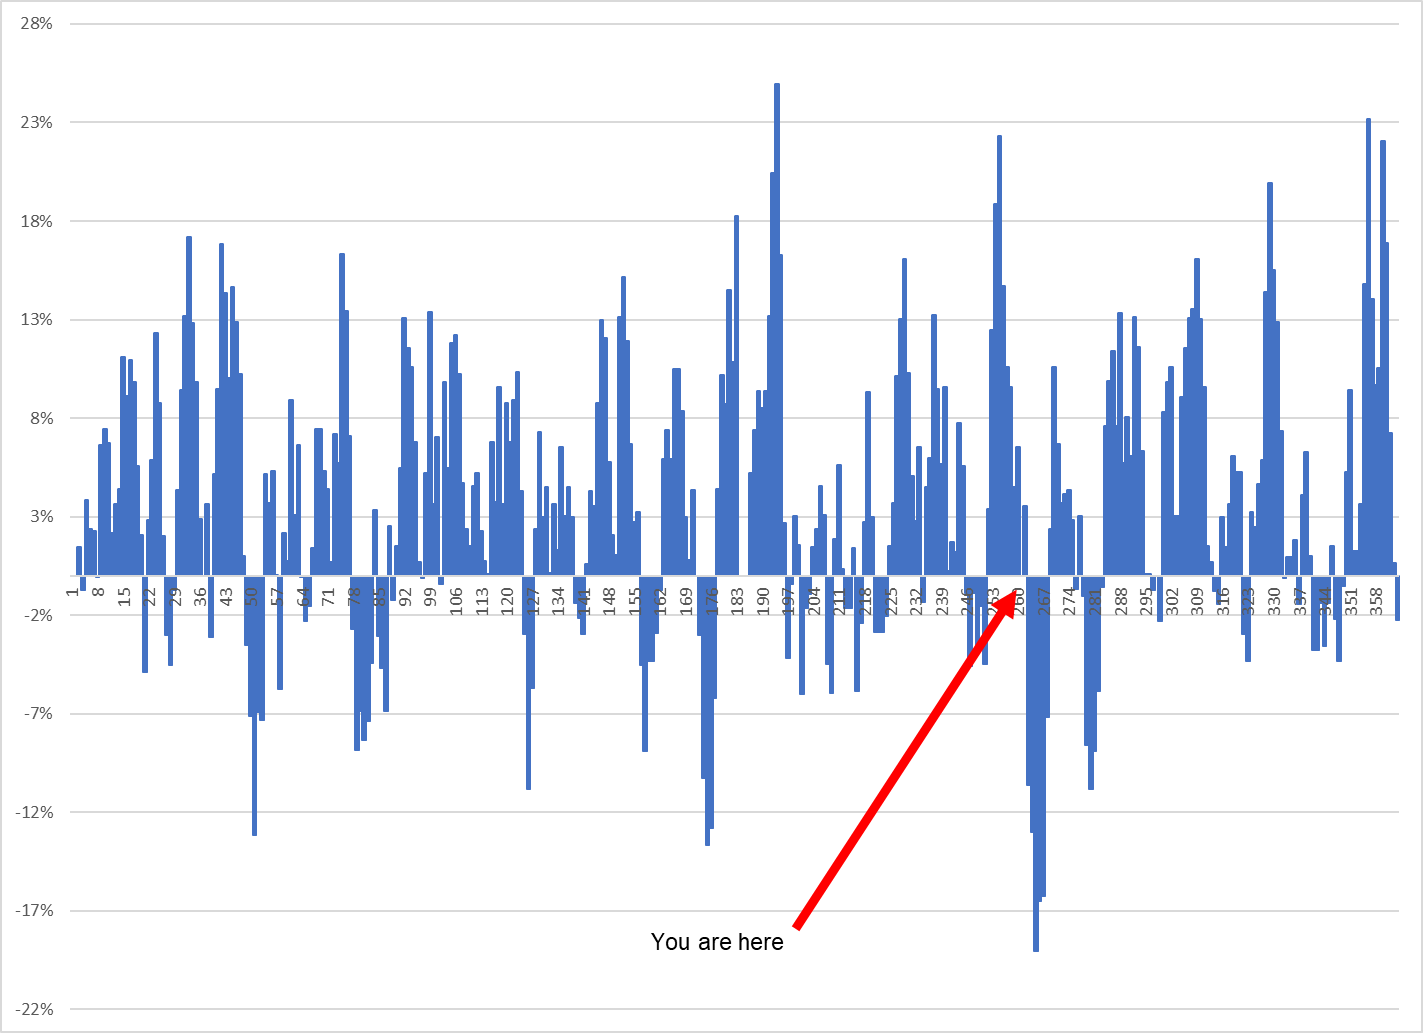
The red arrow shows where we are… We are entering the worst seasonal period of the year for stocks. By far. You have probably seen the normal seasonality chart which shows the average performance over the course of the year, but I think this one tells an even more interesting story as it’s not just about the large skew of moves (i.e., some huge down moves have happened in late September)… The odds of stocks going up are crazy low as well. Here are past percent up days for the specific dates:
20SEP 45%
21SEP 23%
22SEP 43%
23SEP 27%
24SEP 30%
25SEP 43%
It’s hard to overstate how insanely low these numbers are! The market went up on 54% of days in this sample. You may notice that these bad days straddle the fall equinox (22SEP). The interesting thing is that the Spring Equinox is also weak (not as weak, but still consistently weak).
As a reminder, since we’re doing this, here is the average seasonal performance of stocks since 1990.
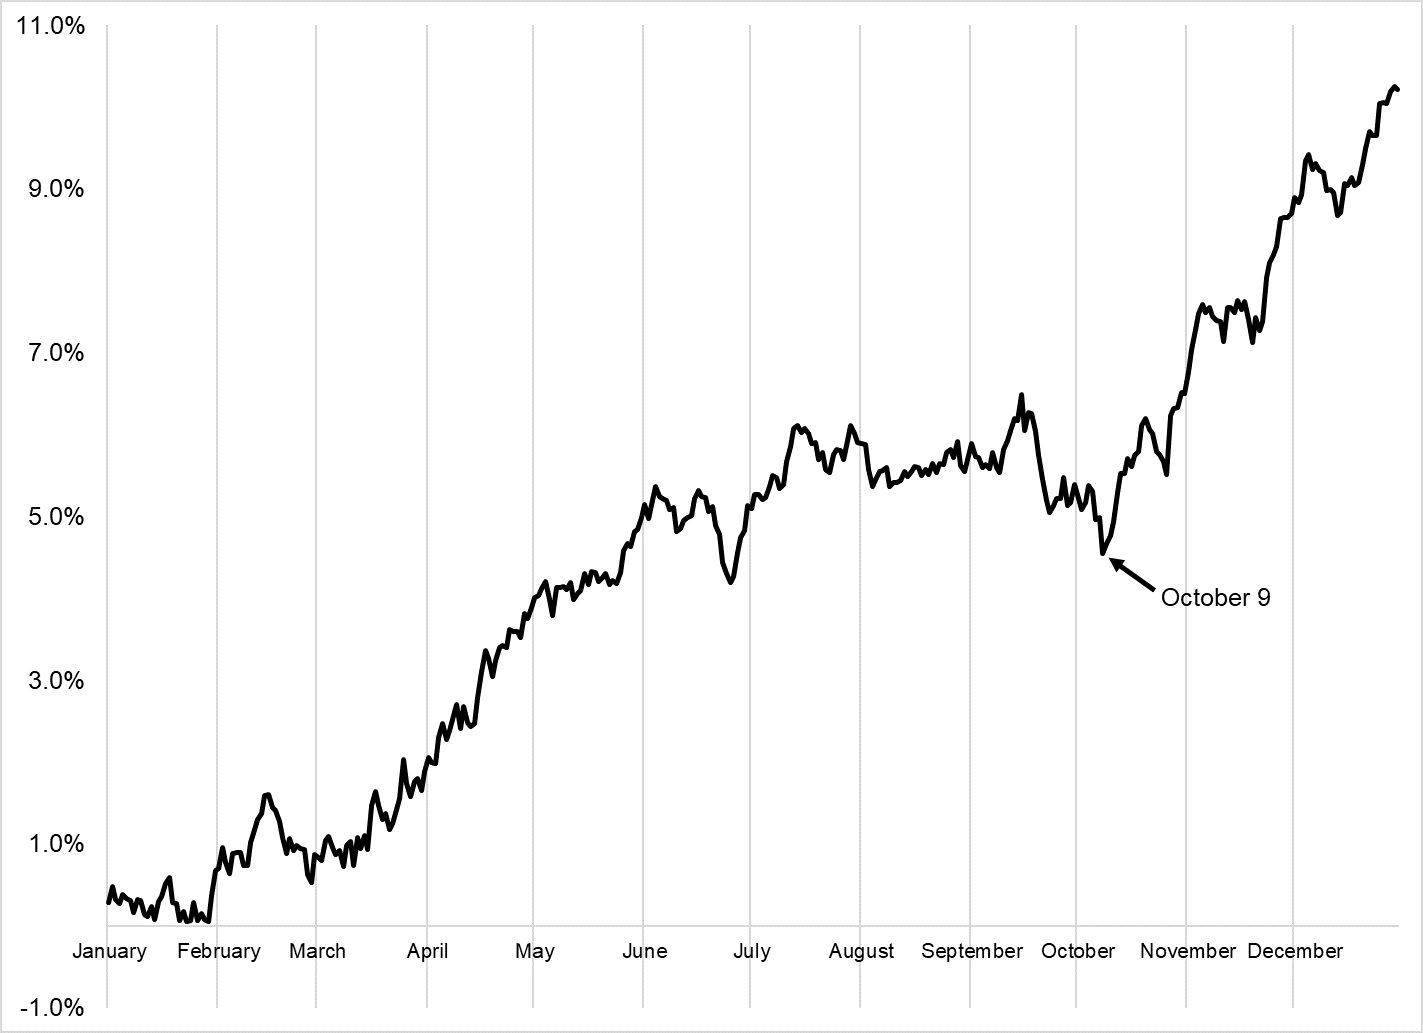
The spring and fall equinoxes are the worst. Midterm years are substantially responsible for that steep ramp higher starting in mid-October, so that is something to keep in mind for later on. But first, we need to survive next week. The week will feature FOMC, BoJ, SNB and BoE meetings.
While it’s easy to go back through history and cherry pick anecdotes that happen to fit your hypothesis, there seem to be an unlikely number of major financial and currency market events centered around the Fall Equinox. For example:
There are theories on why weird stuff happens around the fall equinox. I am open to the idea that humans don’t yet know everything about everything, and science isn’t 100% complete at this point. Who knows? Maybe the geomagnetic activity cycle peak triggers flighty human behavior. Maybe the Earth’s tilt changes moods. Maybe it’s fooled by randomness and equity market weakness around the fall equinox is just a coincidence. It’s hard to say. But would you rather be long or short next week?
I’d rather be short. Not just because of the seasonals, but because of the way everything is trading technical breaks so perfectly in the direction of risk aversion. The perfect break of the horizontal line in USDCAD yesterday is yet another example of how techs have been working remarkably well throughout this trend in the USD and stocks. Also, the swiftness with which we batted away the optimism from last week’s Ukraine news (and falling energy prices in Europe) is rather amazing. And The Merge is done so everyone is selling crypto again. And FedEx.
Here’s the USDCAD chart from yesterday, updated:
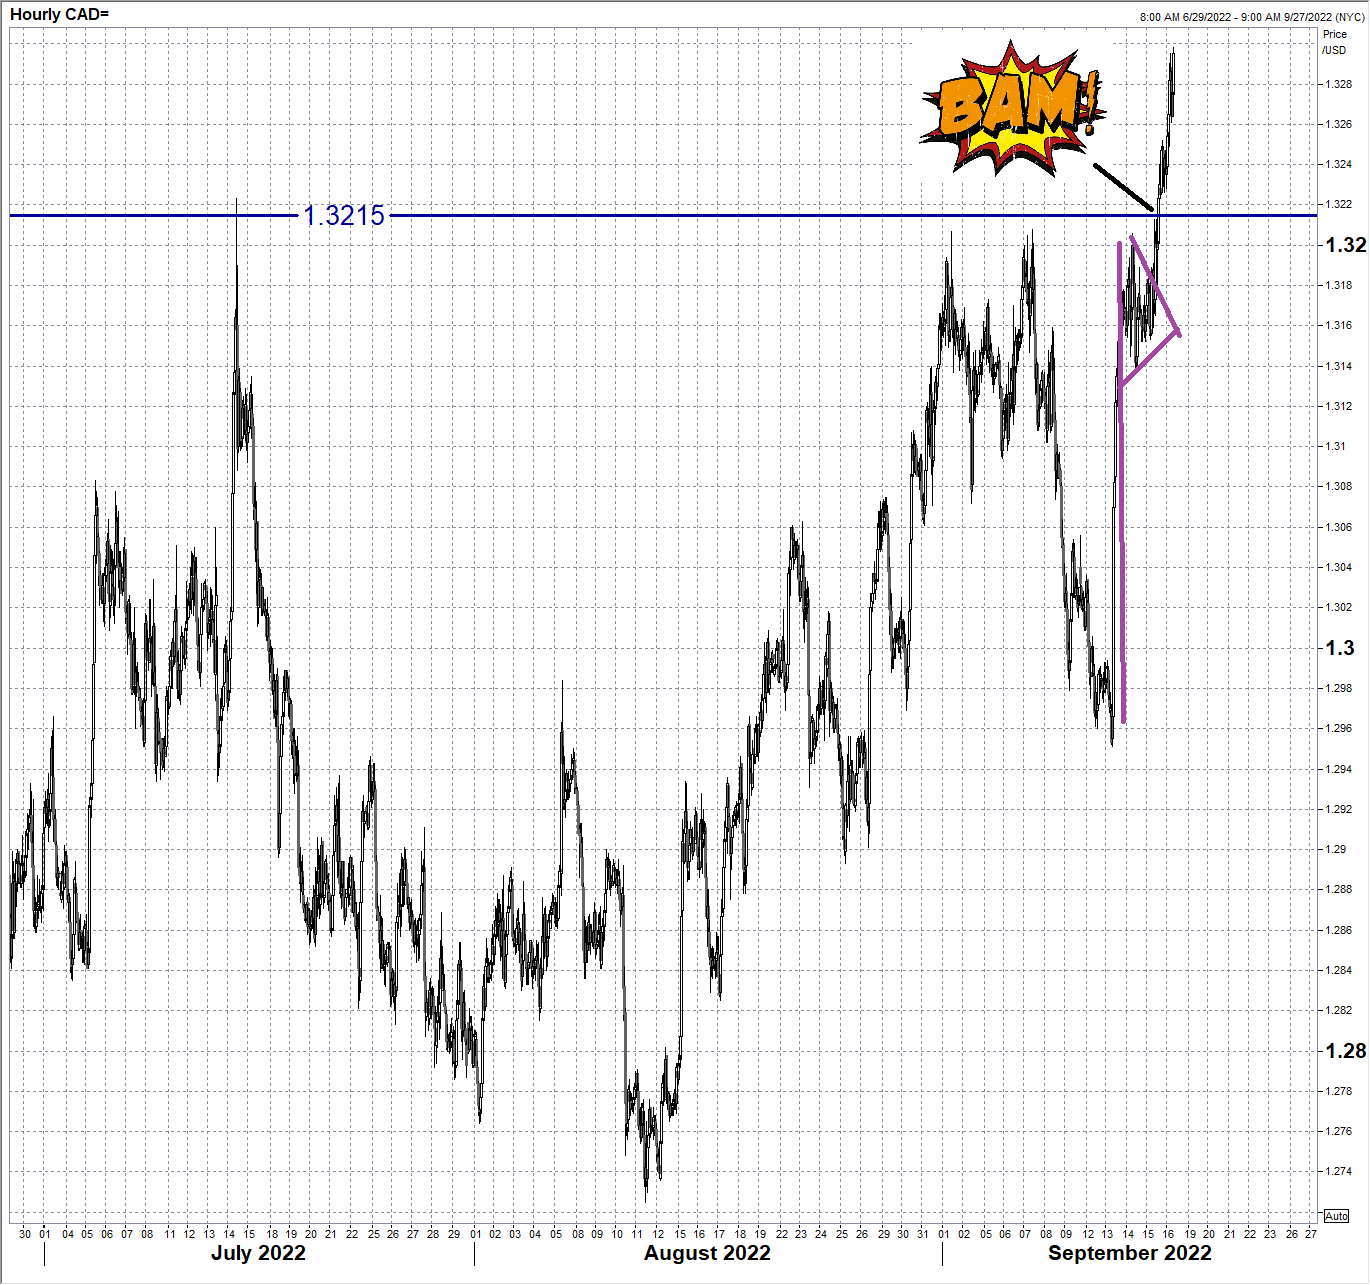
The Canada story remains interesting (bearish Canada). Not many people are short CAD, the economy is getting squeezed by higher rates, and the Bank of Canada is probably going to back down soon. EURCAD and CADCHF are also spicy charts. The only issue super short-term is that USDCAD is overbought (based on deviation from the 100-hour MA) if it gets to 1.3310/20 area today. I would be trimming USDCAD longs, not adding here, but keep buying dips. The 1.3220/30 break is the buy zone now.
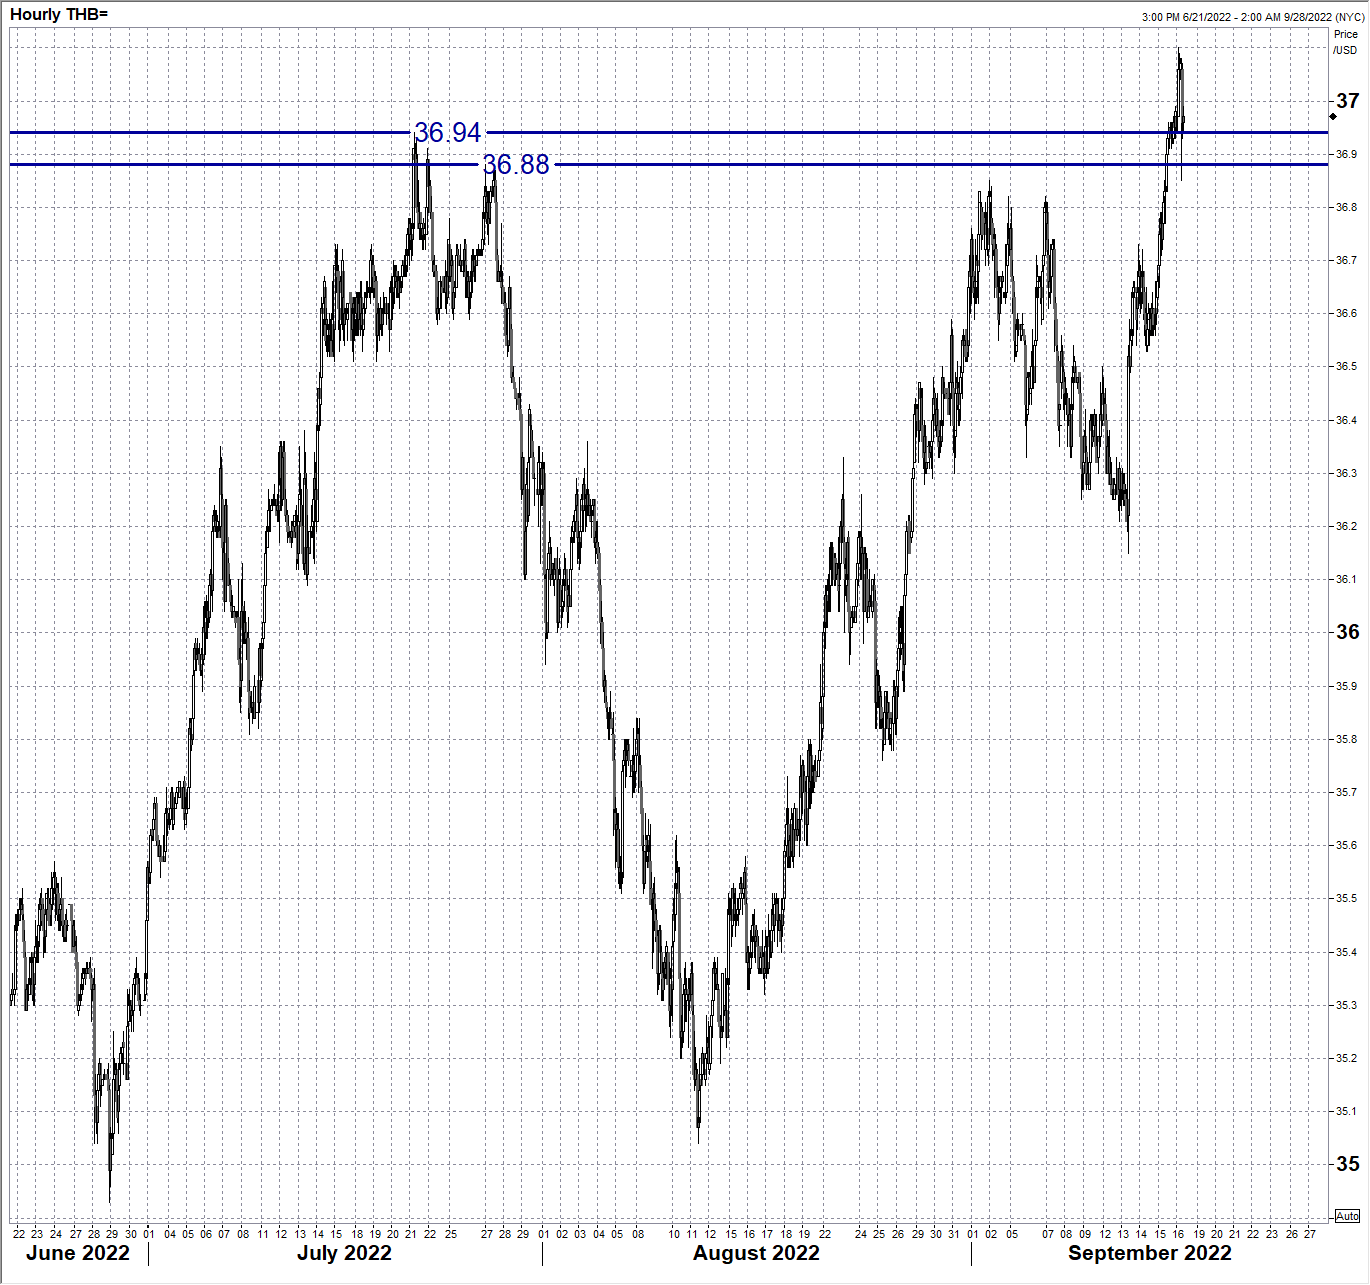
KW pointed out to me that there is another horizontal line break happening in the dollar, this time in USDTHB. I have done about three USDTHB trades in my life, so I can’t speak to the story there, but the carry is interesting. 1-year USDTHB is around 36 with spot around 37, so you get a big margin of safety if you jump on the break via options. Here is the chart. It looks like there was some USD selling intervention ~5 a.m. NY but USDTHB still held the break.
I am thinking about buying a Dodge Charger. I have never owned a North American car and I think it’s time. Thoughts?
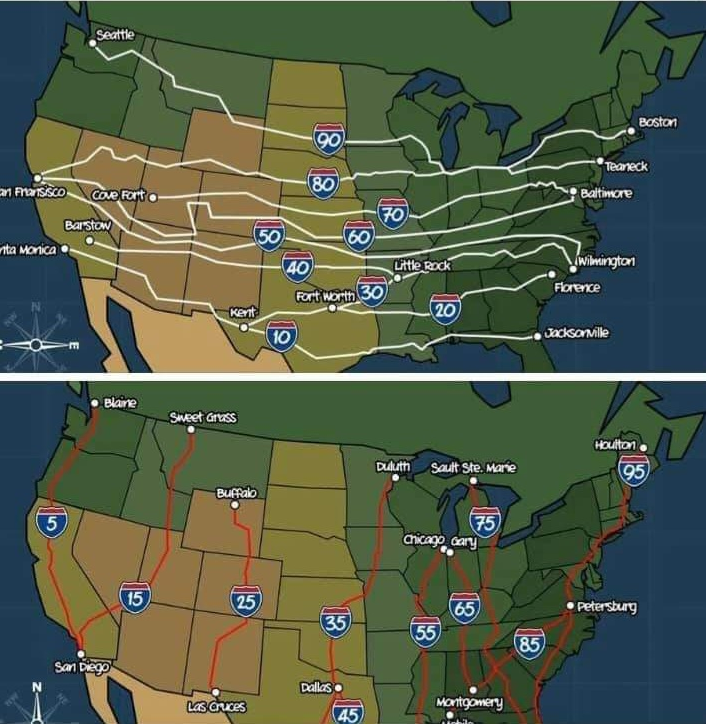
The US interstates are in numerical order.
East/West end in zero. North/South end in 5.
Minor interstates (often loops) are three digits.


A sort of almost unbelievably large move in Brazil. Plus: Short CADJPY.

NZD has a bunch of bullish kickers: Election, seasonality, and inflation
