

Tough to pile into risky assets given the size of the moves already and the lack of follow through after NOV CPI and FOMC tomorrow.
am/FX: Can’t Buy Can’t Sell
Subscriber-only
BD
by Brent Donnelly

Current Views
Short EURSEK at 10.9140
Stop loss at 11.0520 or cover at
11AM NY December 29
December 13, 2022
Can’t buy can’t sell
One down, Fed to go. Inflation is falling faster than expected and the chopfest since November 10 CPI continues in SPX.
SPX broadening out into larger ranges post-November 10 CPI
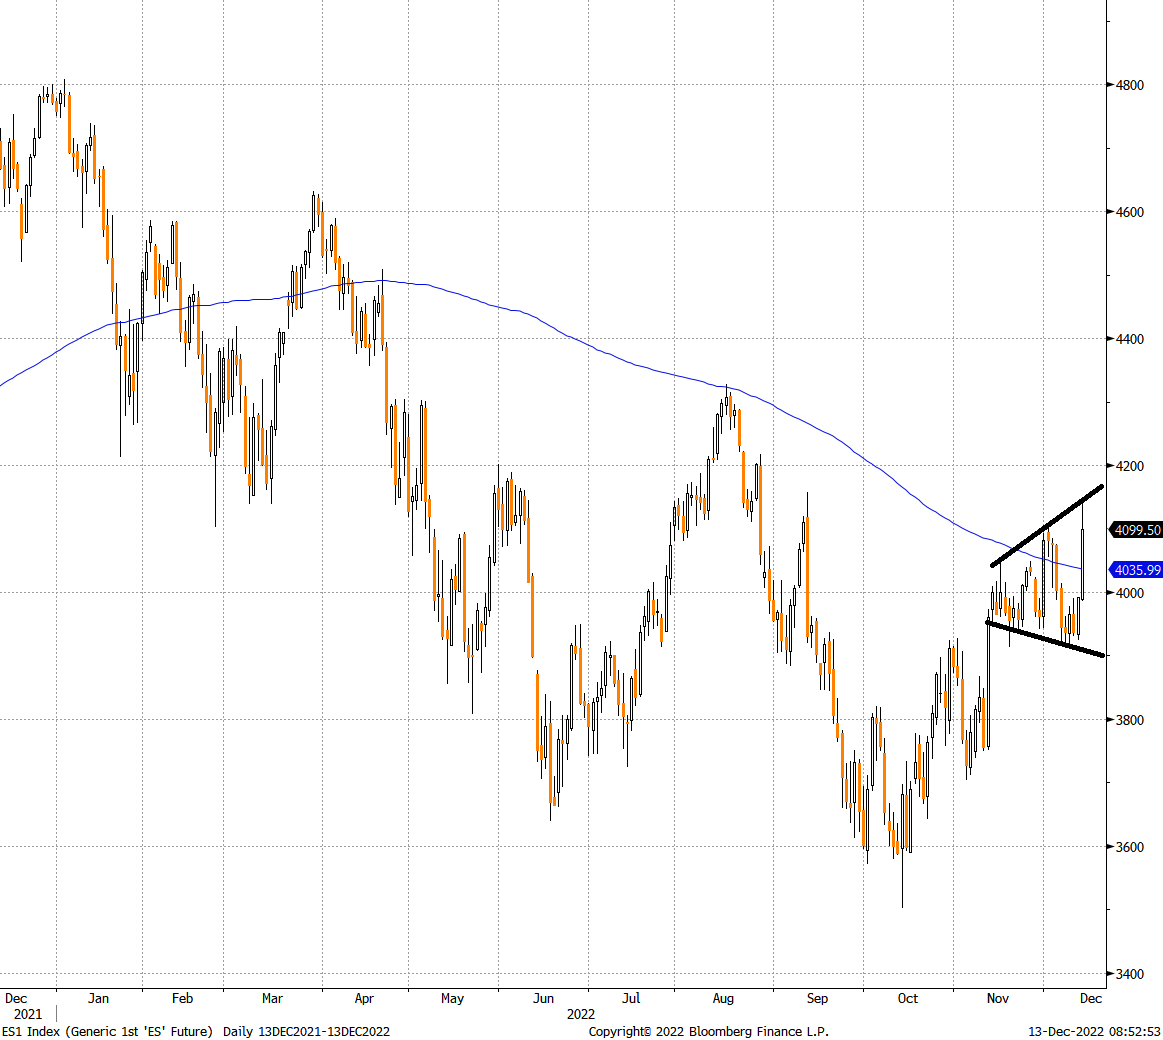
Blue line is the 200-day moving average
The reaction to today’s CPI is large and logical, but I am nowhere near 100% convinced it follows through. The November 10 EOD close in SPX was barely a go with, and now we have FOMC tomorrow as a major event risk the other way. The Fed will surely incorporate this number into their thought process, but they will also incorporate the massive loosening in financial conditions it has brought on. Unfortunately, I would put today’s move in the category of: Pointless to fade short term, but low EV to go with.
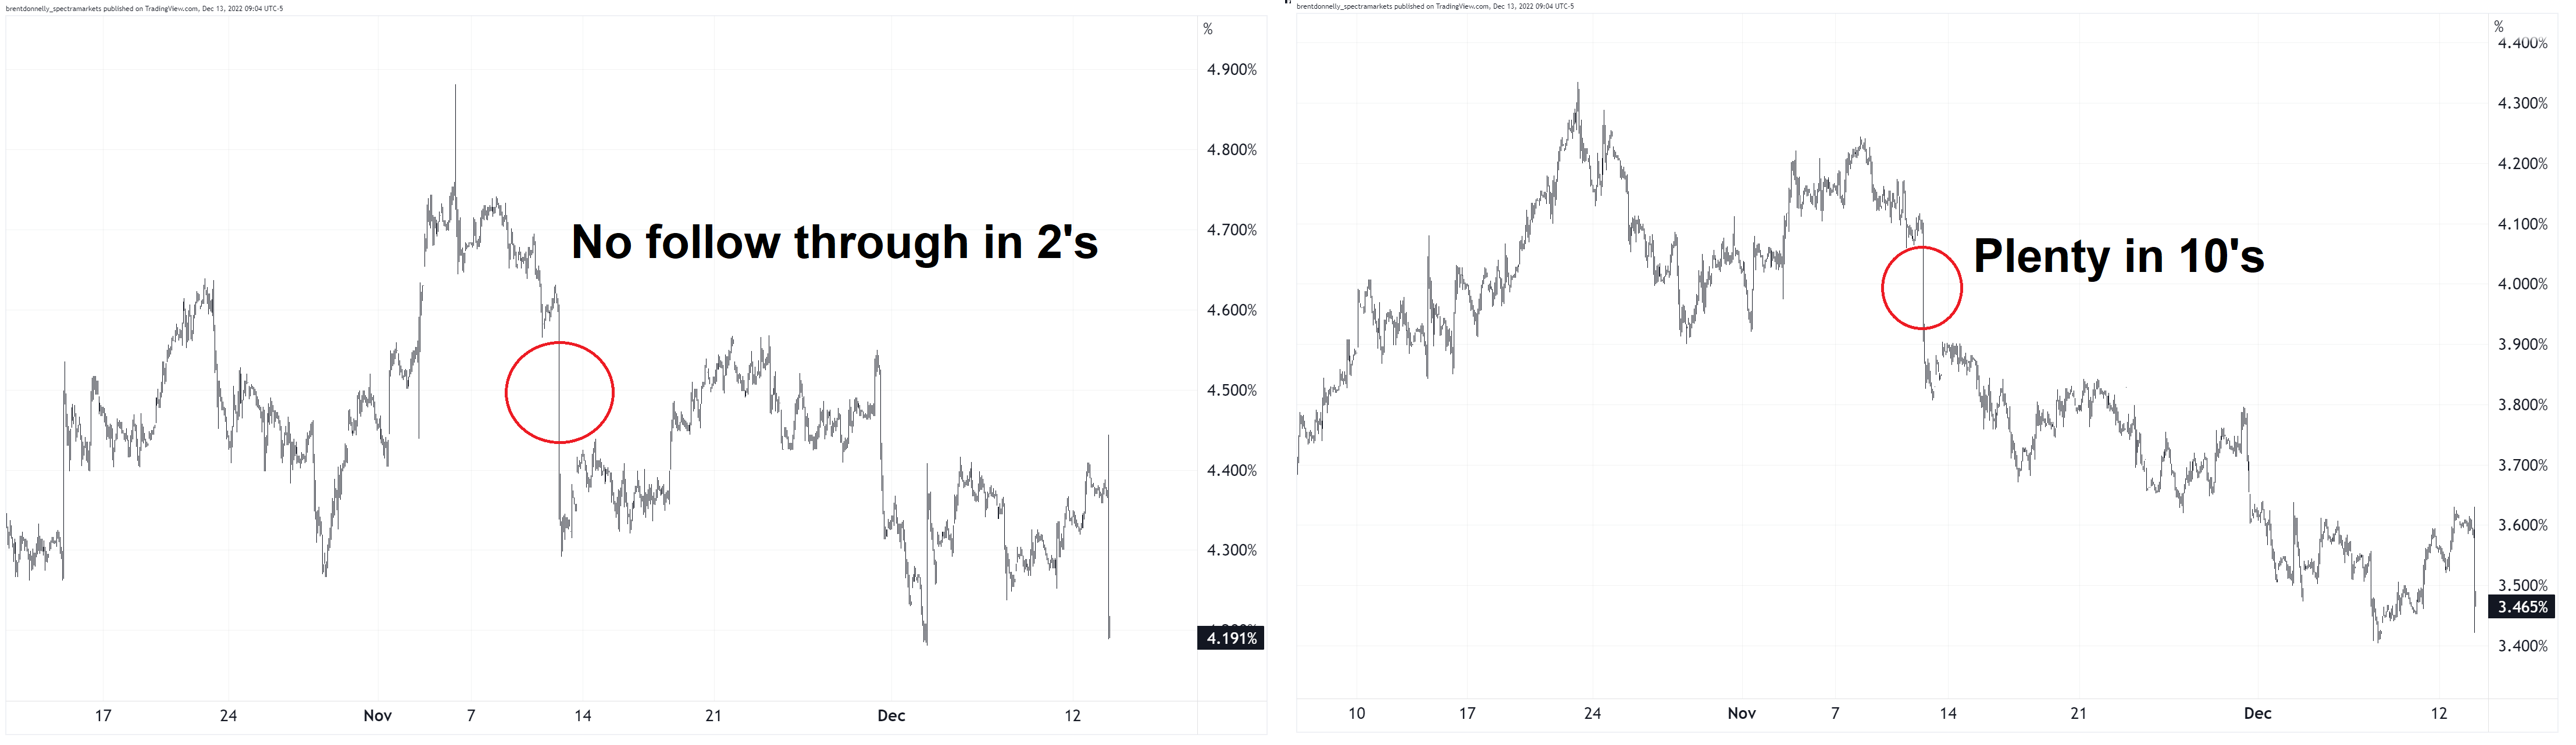
If you are wondering what yields did after November 10, 2-year yields did not follow through, and 10-year yields continued lower. Here are the charts:
US 2-year and 10-year yields post November 10 CPI release
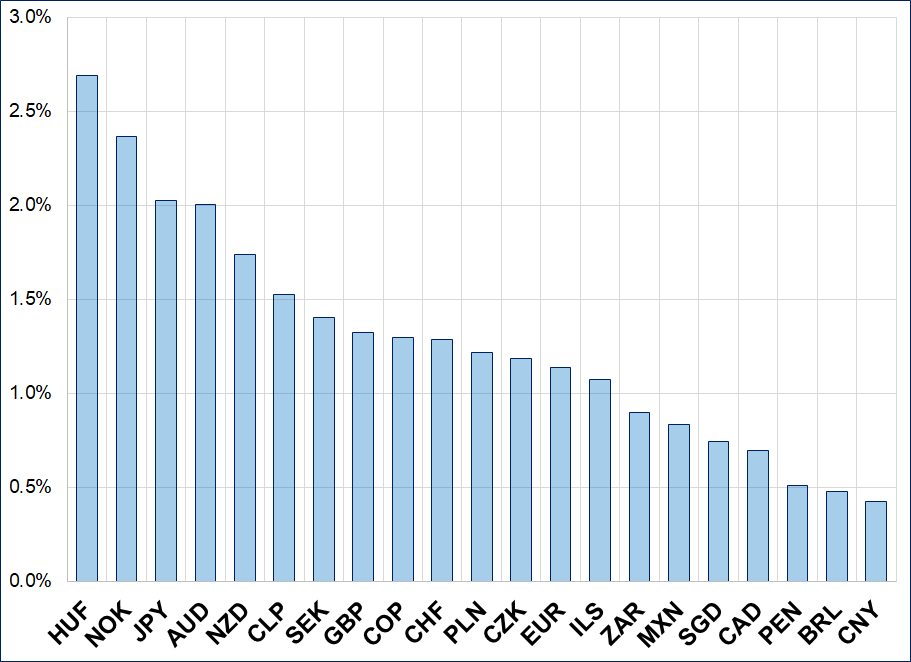
Here is how CPI has impacted FX so far:
FX changes vs. USD since 12DEC22 close
I wish I had something more useful to say, but I don’t think there is a big trade to do here.
Quarterly and yearly trade ideas recap
Today is my quarterly and yearly trade ideas recap. On October 24th, 2017, I wrote the following after reading Philip Tetlock’s excellent book Superforecasting:
—
One of Tetlock’s big beefs, which is a pet peeve of mine too, is the litany of forecasts that stream daily on CNBC, Bloomberg and the internet without any scrutiny or follow-up. Specifically, the relentless stream of “Crash Imminent” predictions is a complete joke. These inaccurate, one-way forecasters are not called out, they are instead deified as “the famed economist who correctly predicted the collapse of 2000 and 2008” etc.
Most analysts that get credit like this predict a crash every year or two and then claim credit in the very few years their call is right. There is no verification (and many forecasts are so open-ended they are impossible to verify) so anyone can make any prediction and it is more important how famous they are, not how accurate they are. I don’t mean to pick on a specific website or forecaster—As an industry, Wall Street is simply terrible at following up on the flood of forecasts we make every day.
It is pretty weird how we don’t even have much data on who is good at forecasting the main US economic data, when this is easily verifiable with a bit of work. Anyone know the Brier Score of the top 10 forecasters of US economic data? Is their forecasting skill persistent? There are many reasons not to follow up on forecasts but most of them suit the forecaster not the users of the forecast.
For example, people sometimes ask me to publish my trade idea outcomes. I hesitate for four reasons:
- If I am right a lot in AM/FX but my real-world P&L isn’t that great, it looks bad and feels bad. “Great calls, Brent, but what’s with your teeny little P&L?”
- If I am wrong a lot, I look stupid. My credibility could be damaged.
- If I am right a lot, it looks like I am bragging. Victory laps are annoying.
- The purpose of AM/FX is not to publish ideas which readers blindly follow. My goal is to help you make your own investment and trading decisions. The idea is to reveal my process and put stuff on your radar. Hopefully that helps you improve your process and plants the seed for some good trades on your end.
The thing is, though, after reading Superforecasting I feel it’s lame and disingenuous to make forecasts and then not follow up. So, I will collect and publish my trade idea results once per quarter. Caveats: My real-world trading P&L can differ dramatically from the P&L of the “Current Views”. Also: I cannot guarantee the accuracy of the data (though I present it, in full, on the next page and I’m pretty sure it’s accurate). Past performance does not guarantee future results. Ask your doctor if AM/FX is right for you. Results on next page.
—
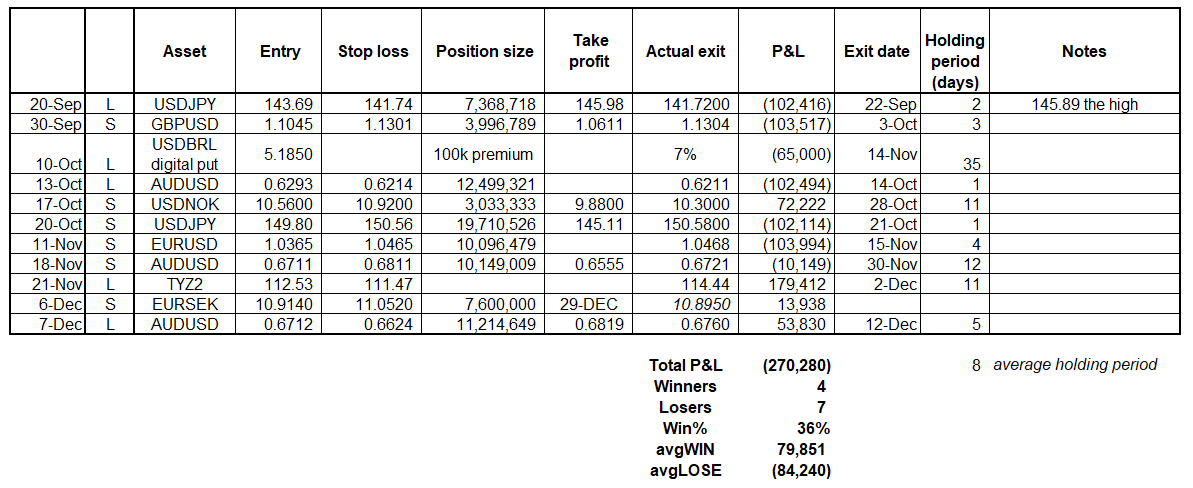
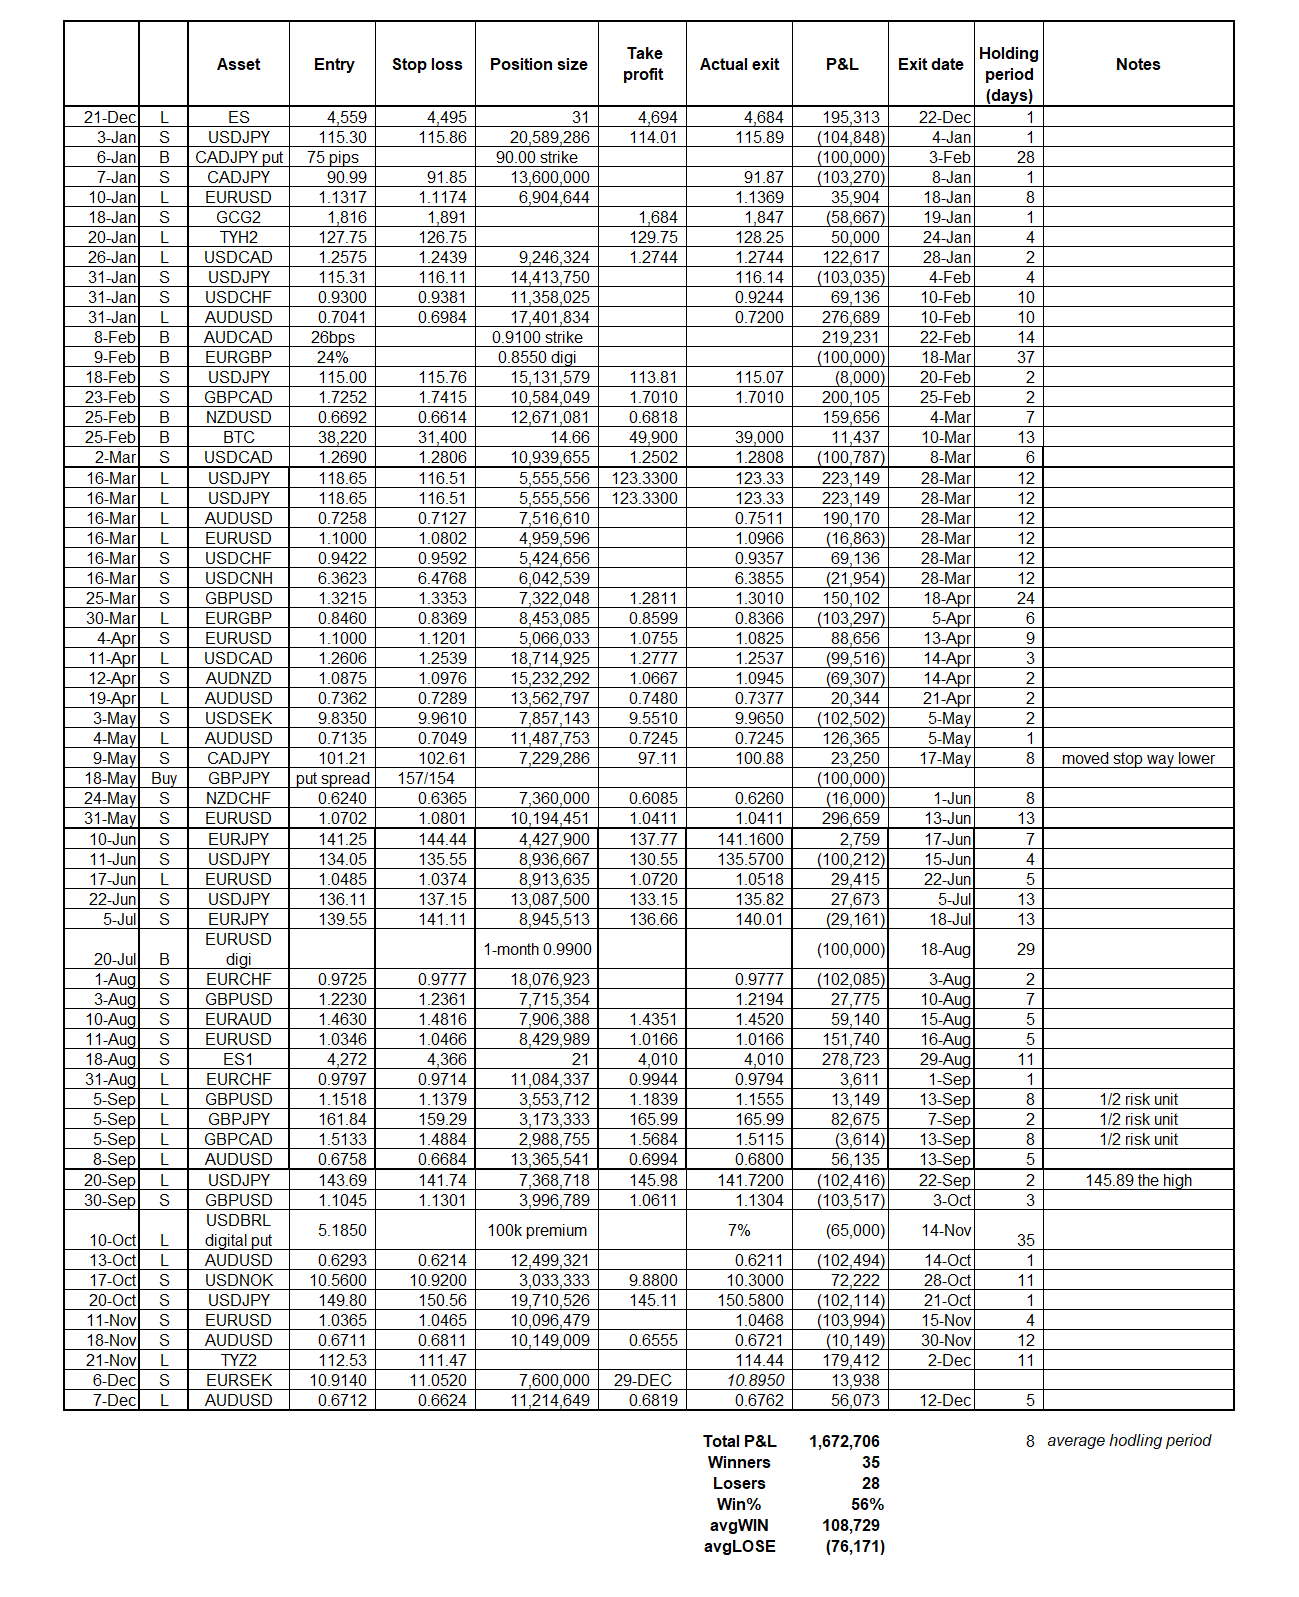
On the next page, you will find a detailed sheet that shows my trade ideas since the last update (which was September 2022). In order for the trades to be comparable, I assume a portfolio with a $4m stop loss that risks $100,000 on each trade (2.5% of free capital). You could divide all the numbers by 10 if you have a smaller account, and if you have a $40 million stop loss at a hedge fund, you can multiply all the numbers by 10. These trades are all liquid macro, there is not much of a capacity issue.
The $ amounts are not really the point; the point is just to normalize the trades because reporting % returns on trades makes no sense. What makes sense is to normalize risk based on how wide the stop loss is. Tighter stops = bigger positions and vice versa. So, to be clear: I risk $100,000 on each trade, backing out the position size from the difference between the entry point and the stop loss. This is all fully explained in Chapter 11 of Alpha Trader. The main point of this results exercise is: transparency and accountability.
am/FX trades, September to December 2022
All am/FX trades for 2022
Takeaways:
- I struggled this quarter. I put out fewer ideas than usual (11 vs. an average of 17 per quarter) and the ideas were unprofitable. This is the first unprofitable quarter for am/FX trades since Q3 2019 and the second since 2017.
- I was too skeptical and slow to embrace the USD turn and even then, my USD shorts were most concentrated in USDJPY and got stopped out. A bit of bad luck hurt, too, as I missed the high in USDJPY by 9 pips and then the low by 2 pips a few days later. Sometimes the rigid and locked-in nature of this process can make for some disappointments like that. In real life, I would normally not miss a 300 point move by 2 pips because I would scale in somewhat. But it’s much clearer for readers if I pick one clear level in am/FX and stick to it.
- In other words, I got both bullish and bearish USDJPY at about the right time, but on one trade I had the wrong exit tactics and on the other one my stop was too tight given the wild volatility in USDJPY up around 150.00.
- The average holding period tends to be steady around 8 days. Some one-day trades and some multi-weekers average out.
- I was too skeptical on China reopening.
- I never put on the NZDCAD bull view or the CADJPY bear view as those were supposed to be trades for Q1 2023. Instead, they both performed right away. Tactics and timing again.
- Overall, I don’t think anything in particular broke in my process this quarter. It was just a combination of a) I was slow to react to the regime change and end of the USD up trend. And I was slow to see the opportunities in the crosses ex-USD (CADJPY, EURCAD, AUDNZD, etc.); and b) I had a bit of bad luck here and there with tactics and timing.
- Onto Q1 2023!
Final Thoughts
This week’s Positioning and Momentum Report starts on the next page. I’ll be honest with you: not much has changed since last week.
I am heartened by the arrest of SBF despite his large political contributions. Once again, this 2020/2022 boom/bust bubble echoes 2000/2002 (e.g., prosecutions of Bernie Ebbers, Jeffrey Skilling, Ken Lay, obstruction charges that effectively killed off Arthur Andersen, and civil securities fraud charges against Henry Blodget, for example). It will be interesting to see how the aftermaths compare.
Have a picturesque day.
good luck ⇅ be nimble
The Spectra FX Positioning and Momentum Report
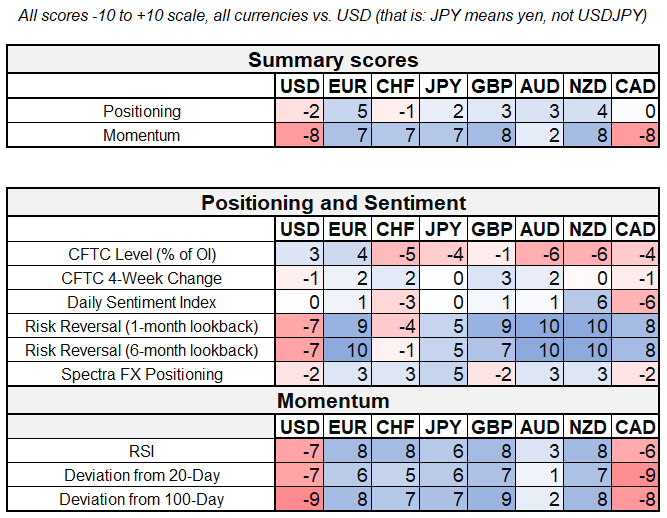
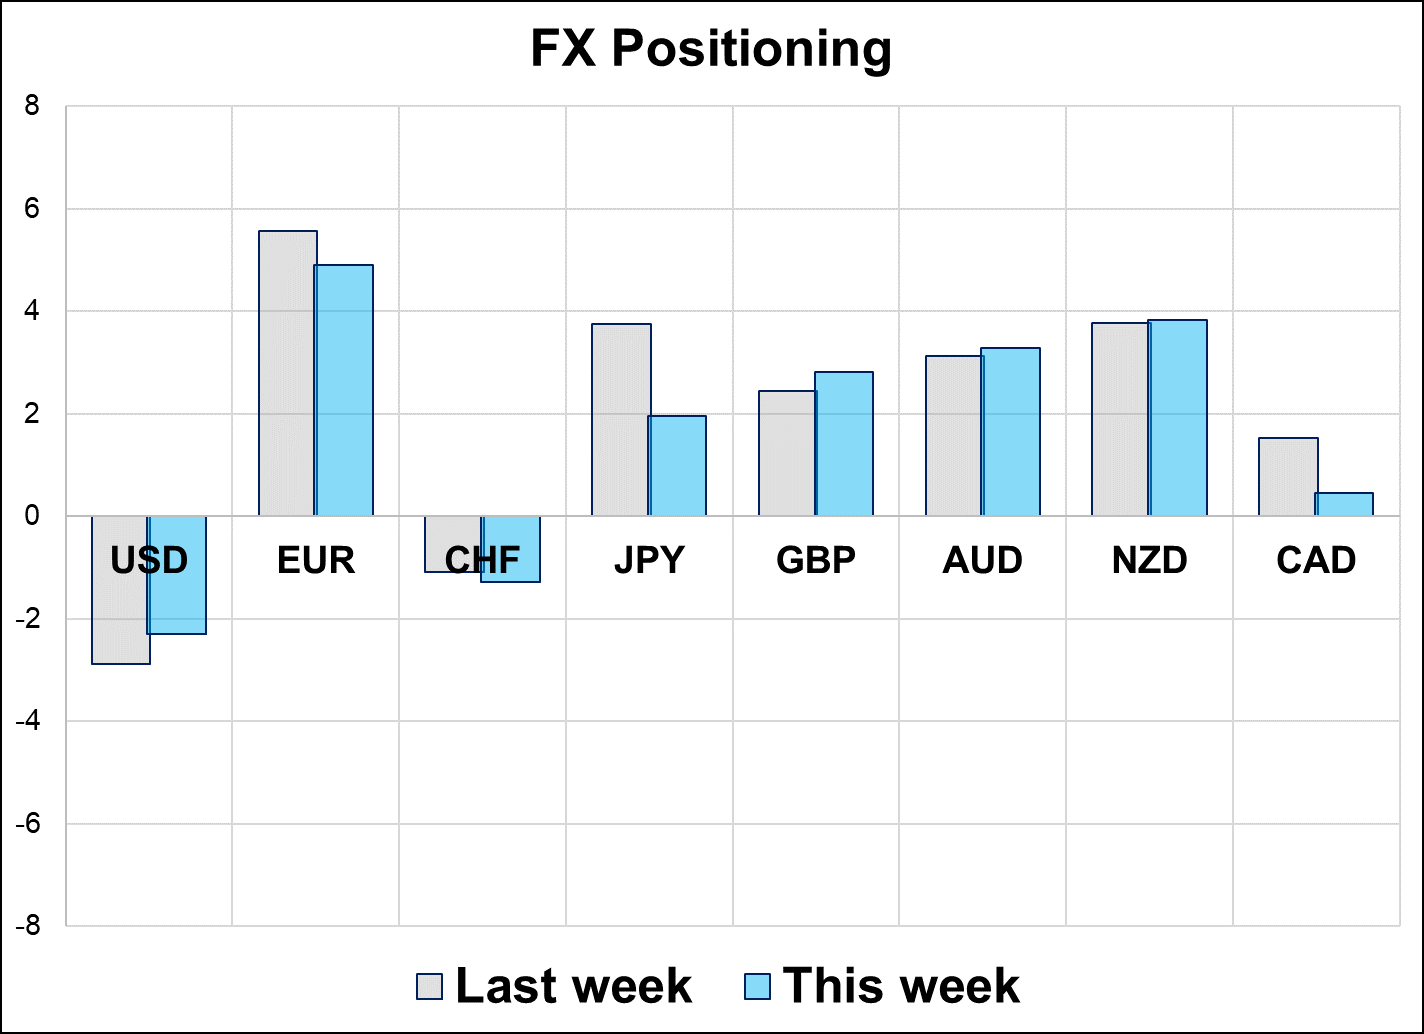
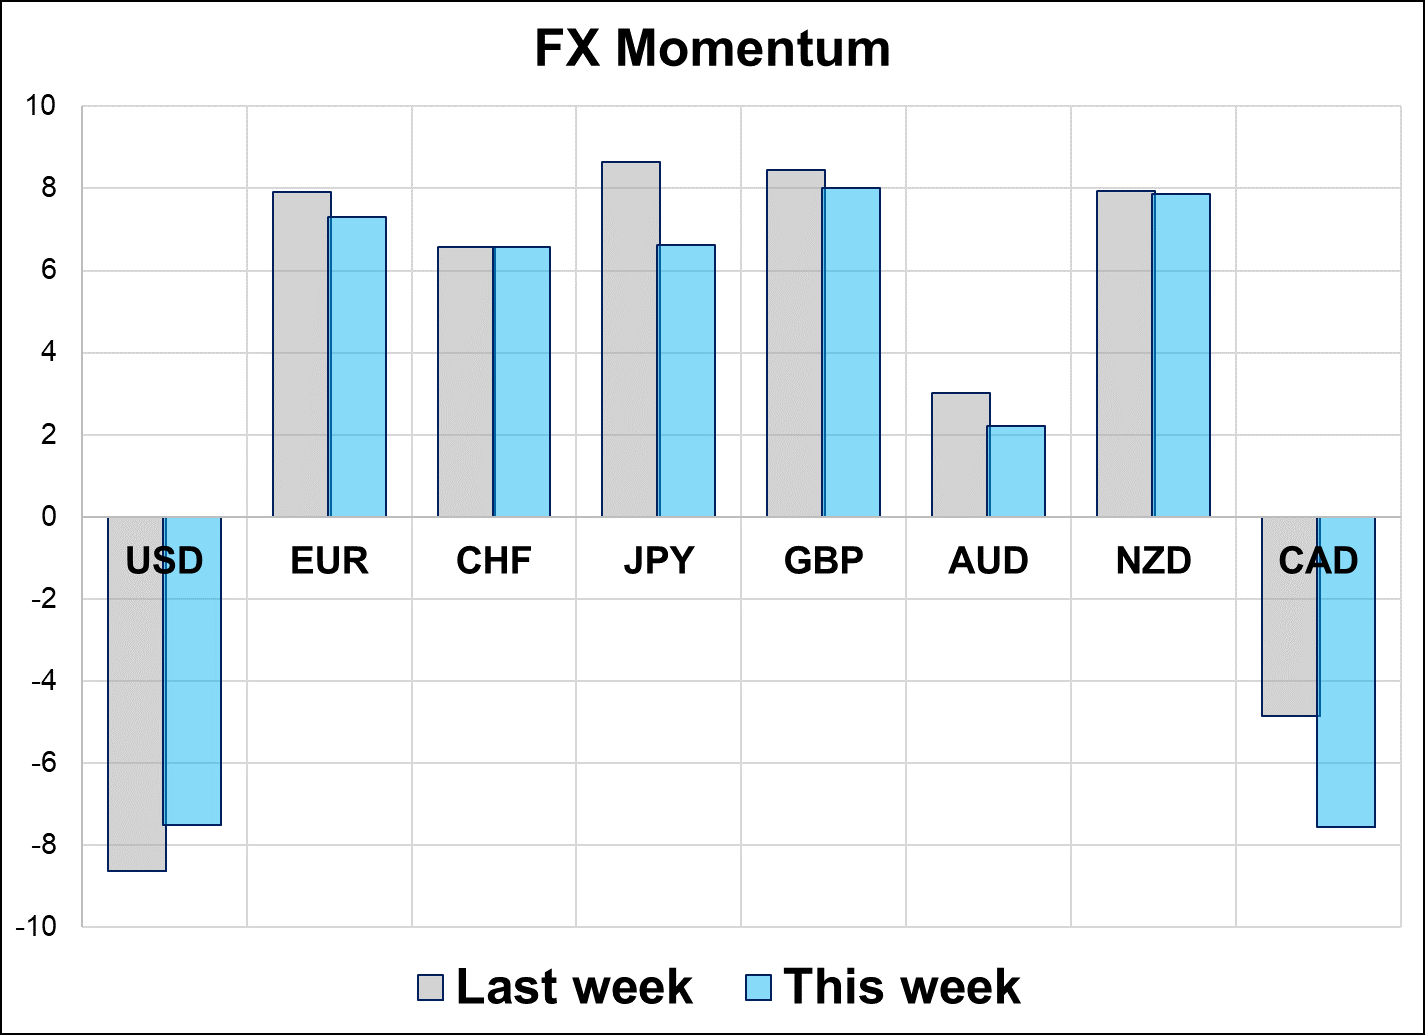
The CFTC continues to slowly reduce USD longs, while specs have not aggressively embraced the USD selloff. The highlight of the report this week is the change in options markets, where the risk reversal continues to move in favor of EUR, GBP, AUD, and NZD. The risk reversals are probing levels last seen in April 2022.
Here are this week’s positioning and momentum scores:
G10 FX Positioning and Momentum
Five Takeaways
1. Most G10 currency pairs are close to their levels from a week ago and thus positioning hasn’t changed much.
2. Buying of JPY calls (cross/JPY and USDJPY downside) has cooled off as yields stabilize and USDJPY rebounds off the sub-134 lows traded in early December.
3. USD momentum remains negative. AUD and CAD remain laggards. Despite China reopening looking good, AUDUSD cannot rally much, even as the risk reversal moves more in favor of calls as you can see here:
AUDUSD vs. AUDUSD 1-month 25-delta risk reversal
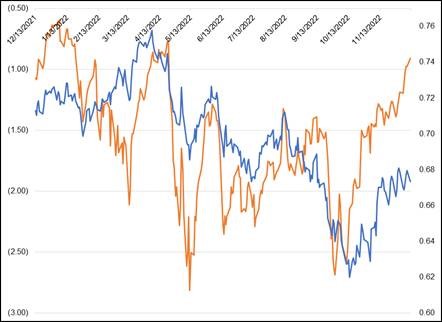
4. Quite a lot of dispersion in FX performance this month as it’s not a textbook broad USD move.
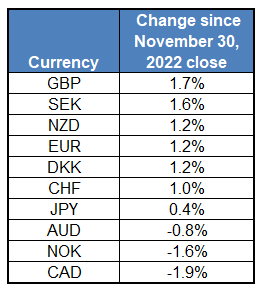
5. MXN remains a large position in the EM space. Each time USDMXN takes another leg higher, we get a ton of inbound queries asking what is going on. Seems to be a big unwind that is triggering a series of smaller unwinds as MXN was a popular and profitable trade for much of 2022.
Anecdotes and Observations
1. FT and Time Magazine “Person of the Year” officially comes in as Ukraine President Zelensky.

I suppose this could be a signal of peak optimisim on the War in Ukraine. We have gone from “Russia is gonna bowl through in a few weeks” to “Zelensky Winning!” The risks now would be a deterioration in the story due to mean reversion, overoptimism, or something else.
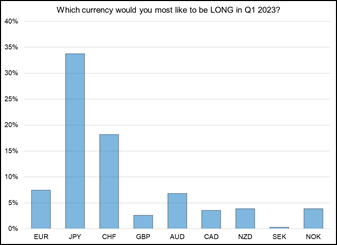
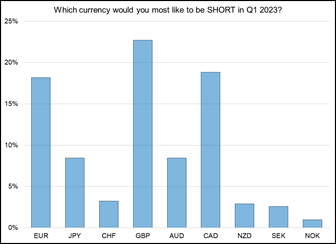
2. USDJPY downside buyers will probably reappear closer to year end. USDJPY and cross/JPY lower remain popular views for 2023. In case you missed it, here are the favorite and least favorite currencies for Q1 2023, according to an am/FX poll with 360 respondents. Short GBPJPY is likely to be a top choice for specs into 2023.
3. This feels like the last real week for trading. Interest is already low, even with CPI and FOMC (and a zillion other CB meetings) this week. Equity markets are choppy, yields are zigging around 3.50% and there is not a compelling enough narrative to draw specs into late-year trades.
That’s it for this week! Thanks for reading.

Click here to subscribe to am/FX
More recent posts



Rabbit Holes
CAD and Rabbit Hole #18
This piece is mostly for people who are interested in backtesting

Subscriber-only
France, stocks, USDCAD
This could be a consolidation week as crosswinds now blow in FX and equities