
Some comments on the EUR and 60% of a bearish USDKRW thesis for you to expand upon and think about if it fits your priors.

This is Target Corporation’s logo
from 1962 to 1987

Some comments on the EUR and 60% of a bearish USDKRW thesis for you to expand upon and think about if it fits your priors.

This is Target Corporation’s logo
from 1962 to 1987
Stop loss 1.0466
Take profit 1.0166
Stop loss 1.4816
Take profit 1.4351
The love affair with the EUR and GBP lasted about 36 hours as the only buyers of those two currencies are covering shorts. As I found out yesterday as I attempted to bolt together a bullish EURUSD view… It’s just extremely difficult to put together any strong bull case that might attract new money to EUR or GBP (or JPY for that matter). The only reason to buy those currencies is positioning and that’s a thesis that works at the price extremes but not longer.
There were positive vibes on the supply side of the EU energy story this week, but the price of energy is still on Ganymede and a more concerning aspect is that it’s not pulling back. It’s just way high and stable, in contrast with past spikes. If I was short this thing, I would be extremely concerned by the different, more persistent nature of this rally.
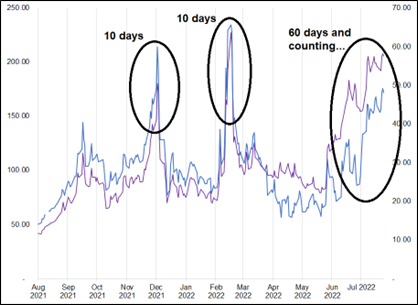
TZT1 and FSFUM1 on Bloomberg, left y-axis is Dutch price, right y-axis is UK
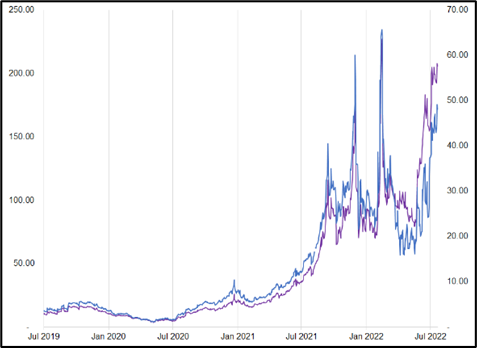
In case you don’t follow this stuff, here’s the zoomed out version for context:
This section is about KRW. I have traded it off and of over the years, and I even made markets in KRW for a short while. But I would not say I am not expert in KRW anymore and I am not in touch with the fundamentals. So take these observations (which are cross-market and technical) and do with them what you will!
I happened to notice this textbook horizontal breakout in the Nikkei today (chart on top)… If I wasn’t already short EURAUD, that might pique my interest to be long AUDJPY (chart on bottom).
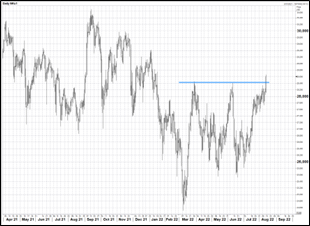
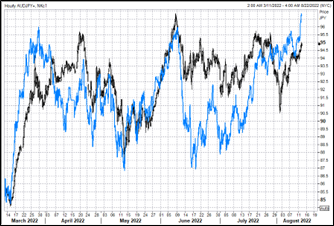
But EURAUD and AUDJPY are too similar, so I passed on the AUDJPY impulse and went to the CFND function in Bloomberg (CFND = correlation finder). I ran Nikkei against various baskets of currencies. The highest correlations of Nikkei to FX are: KRW (53%), IDR (42%), MYR (41%) and TWD (41%). And 38% for AUDJPY and 28% for AUDUSD. So I brought up an overlay of USDKRW and the Nikkei:
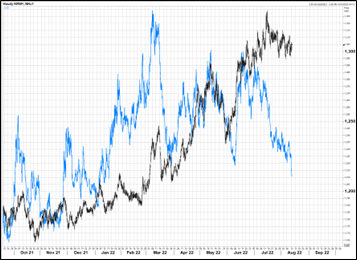
This is a stunning example of how two variables can be somewhat highly correlated and yet travel in different directions due to asymmetrical beta. When Nikkei sells off, USDKRW rips / when Nikkei rallies, USDKRW grinds lower. This would not mean much to me, but I happened to be on my KRW panel at that point and noticed this chart:
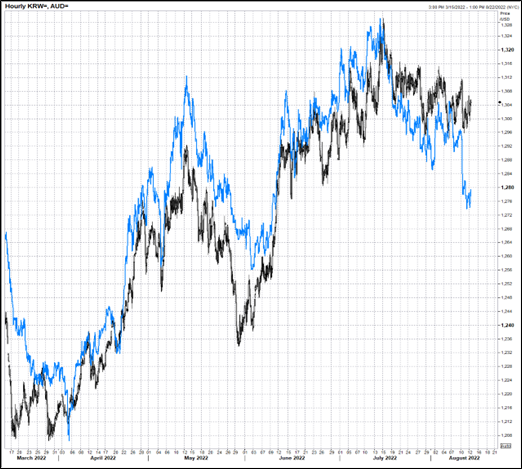
I don’t follow KRW closely anymore, but when I used to trade it, the AUDUSD lead indicator was useful for identifying moments when KRW looked cheap (that is, when USDKRW looked high). This appears to be one of those moments.
A partial explanation for why KRW is cheap and why it could reverse soon: If you look at the seasonality of USDKRW, it tends to peak in mid-August (on chipmaker dividends, probably) and it sells off into and through September and October.
There is no trade recommendation here. I don’t follow KRW closely enough to package the fundamental side with these finger-in-the-air observations. I hope this will serve as a seed planted in your mind. If you are interested in KRW, this is the start of a more complete thesis that I will allow you to pursue on your own.
Justin and I wrote what I believe to be a solid piece on the prickly issue of whether or not good traders vary bet size based on confidence levels. You can read it here.
Have a walk sock kind of day.

This is an ad from a 1975 Target Australia catalogue. The picture is wonderful but also…
Despite the identical logo, name and similar type of outlets, Target Australia carries no direct relation or affiliation to the American big box retailer Target Corporation.
Target Australia opened in 1968.
Target Corporation (USA) opened in 1902!


This piece is mostly for people who are interested in backtesting

