
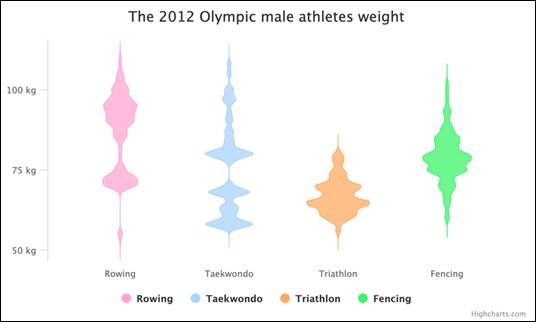
A variety of looks at the USD and EUR crosses today.

Can you guess which
one is rowing and which
one is Taekwondo?

A variety of looks at the USD and EUR crosses today.
Can you guess which
one is rowing and which
one is Taekwondo?
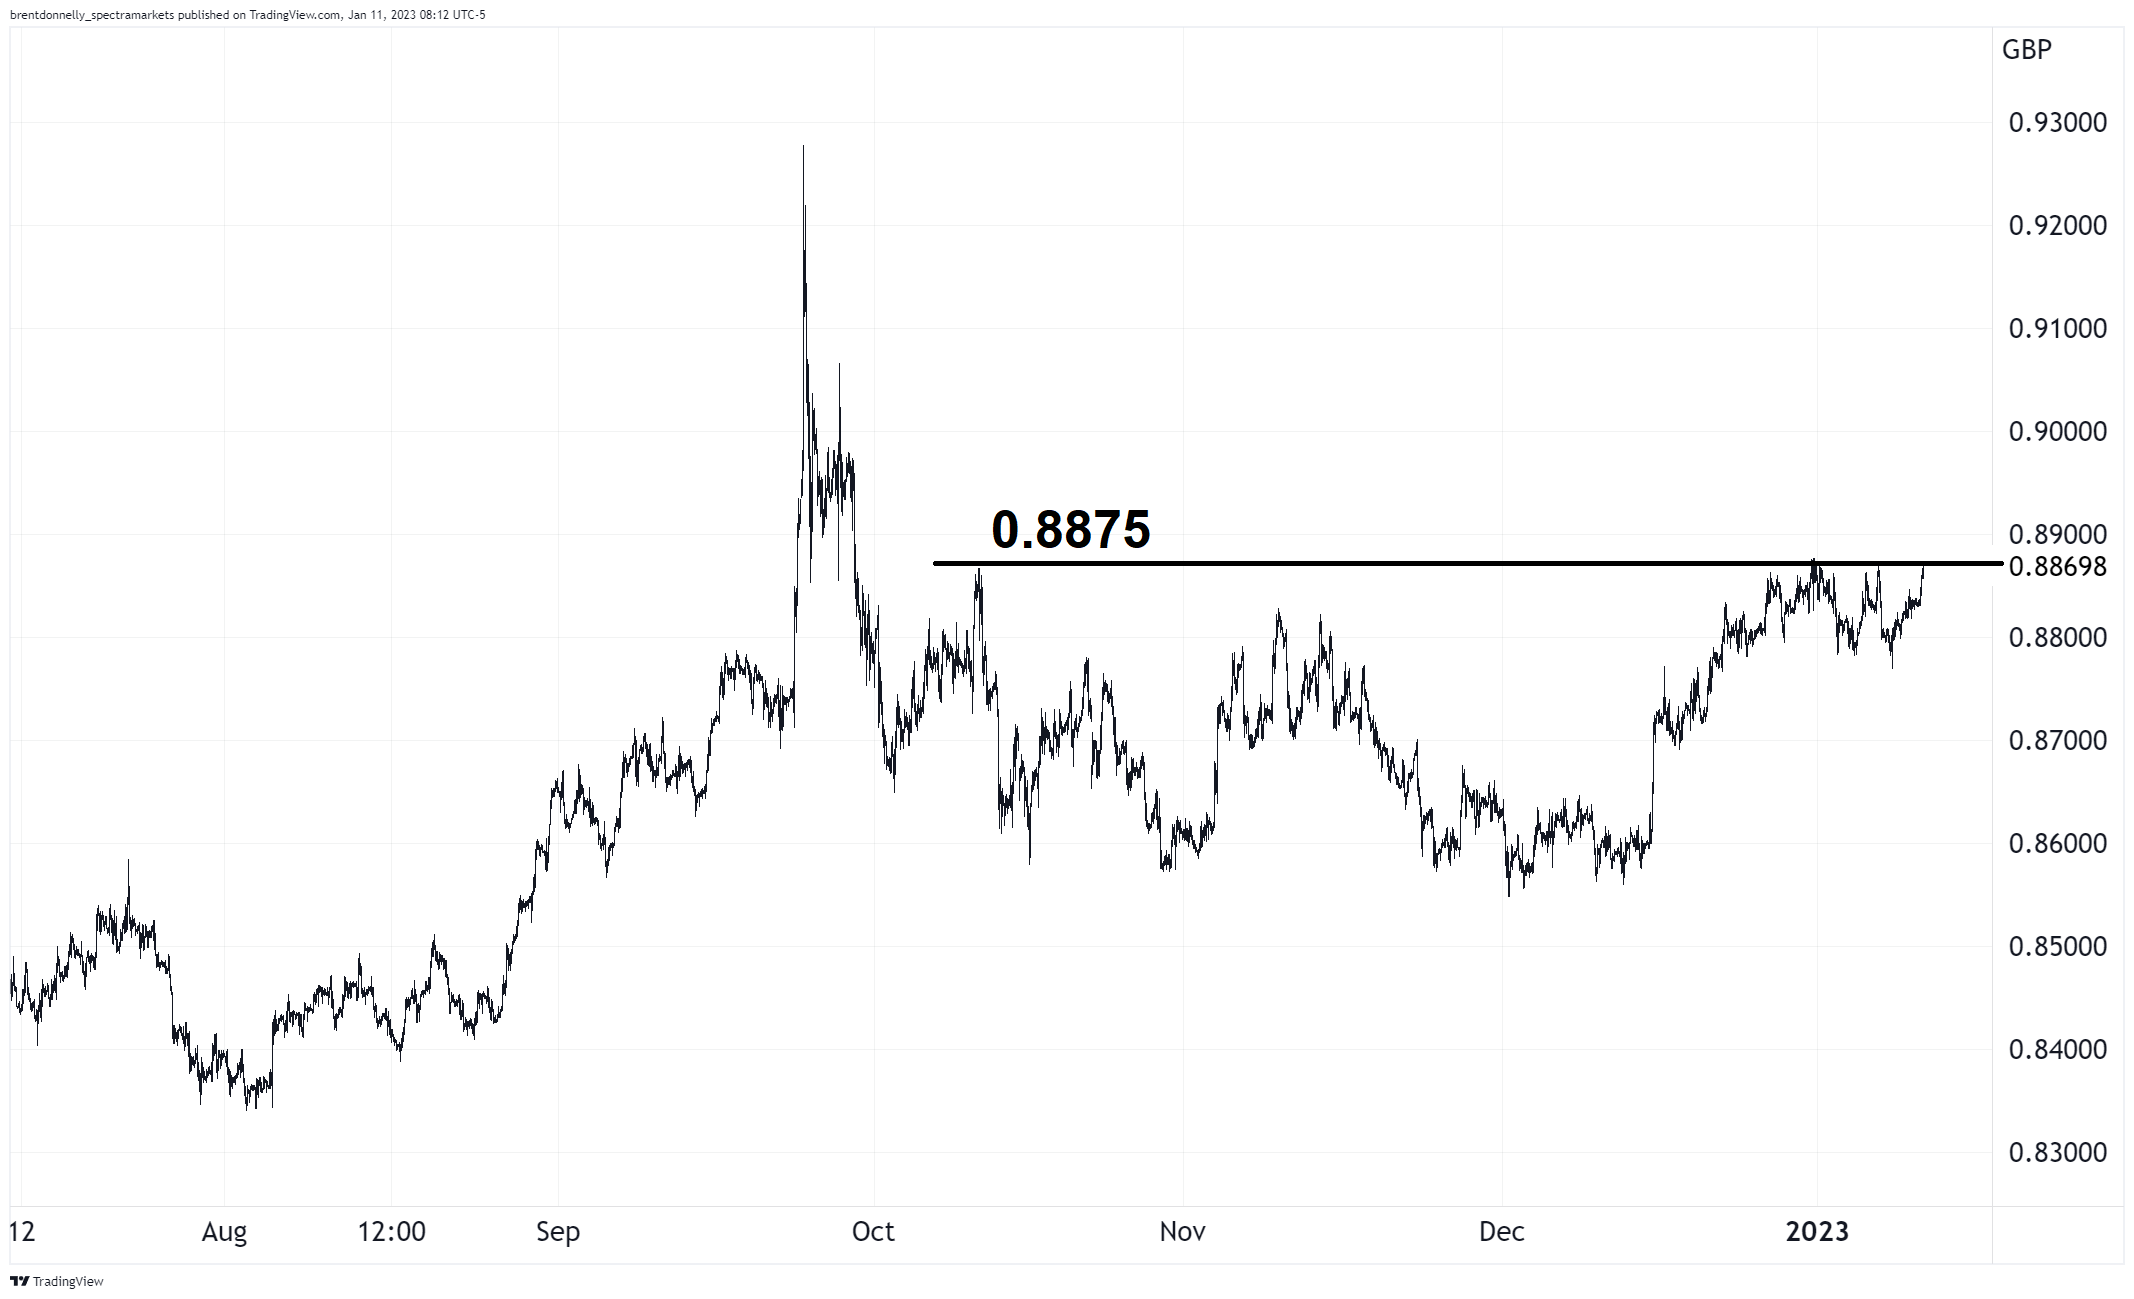
Long 07FEB EURGBP call
spread 0.8870/0.8920 risking
22 GBP bps to make 50
Spot ref. 0.8850
January 11, 2023
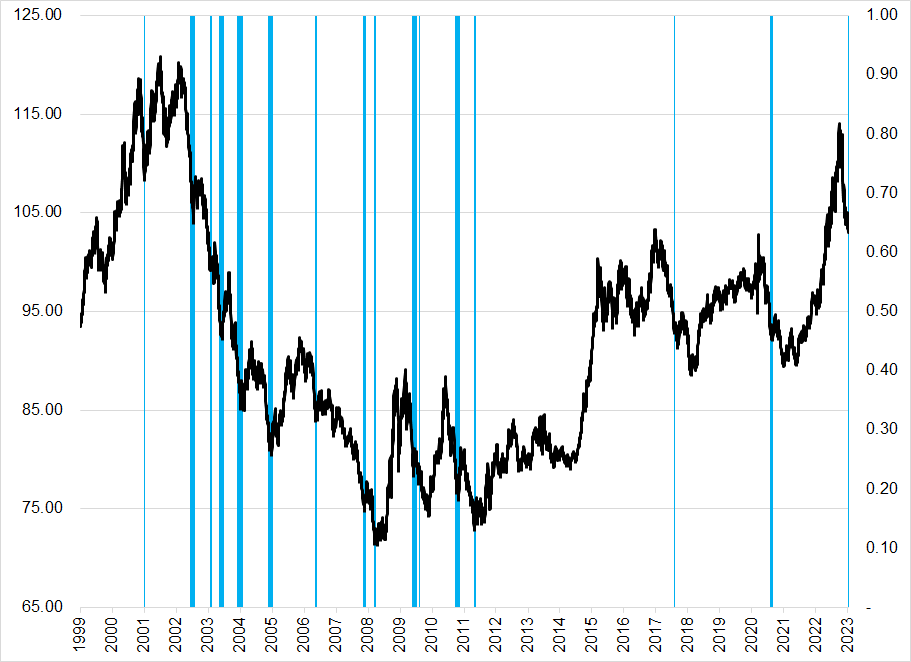
Yesterday’s Positioning and Sentiment Report (see yesterday’s am/FX) showed momentum of the DXY vs. the 100-day score at -10. This means that the divergence of the DXY from its 100-day moving average is at an extreme relative to history back to 1999. A client pinged me to ask if this is bullish, so I ran the numbers. It is not. It’s neutral.
Here are all the times the DXY traded 5% or more below its 100-day moving average:
And here’s the P&L of going long DXY when that happens
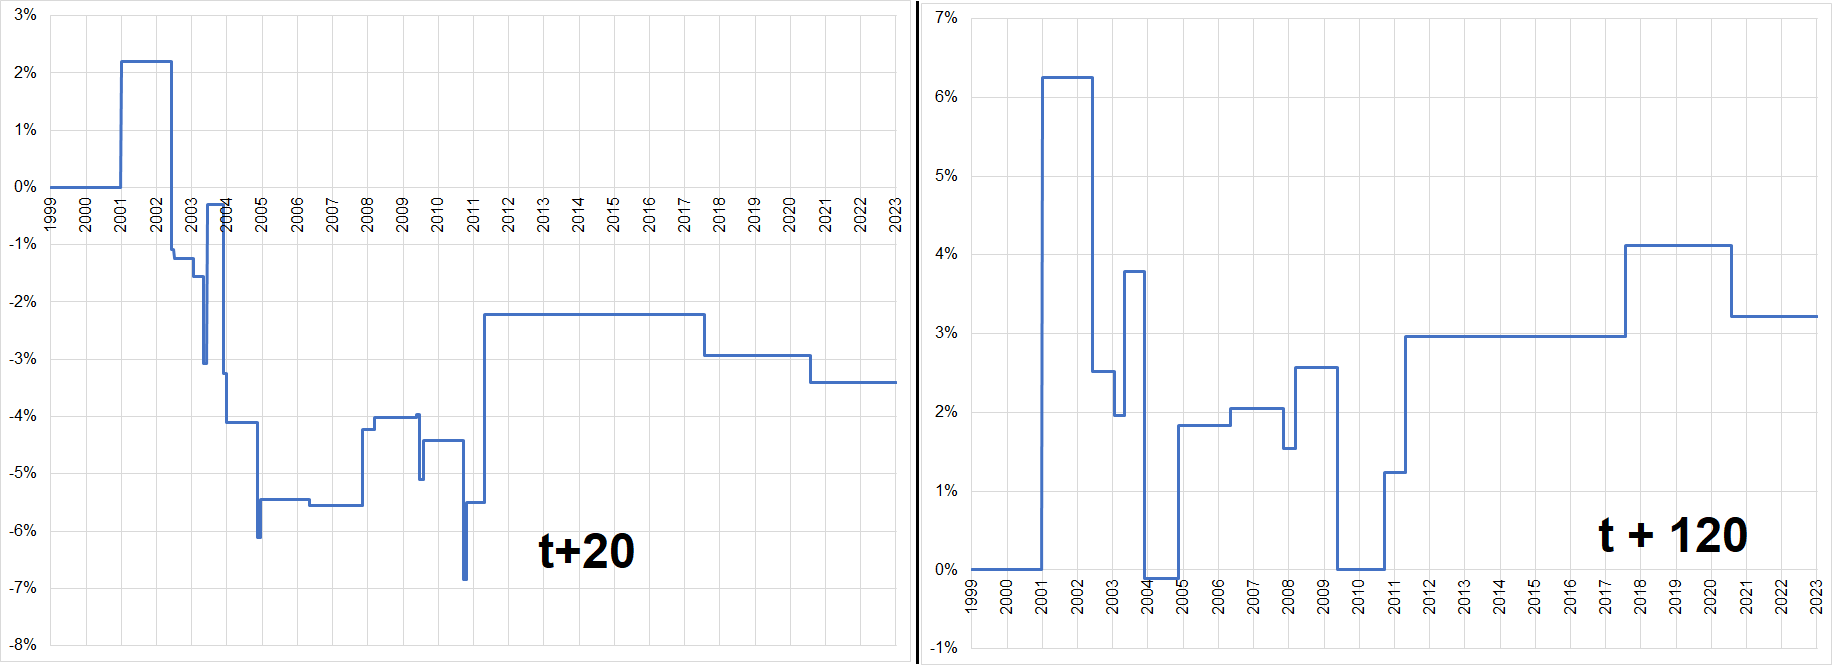
If there is a takeaway here, it’s that this momentum reading is a standard feature of legit USD down trends. You can see in the first chart that in the great USD bear market of 2002 to 2008, readings were plentiful, and they continued in early days of QE. Then, in the great TINA dollar bull market of 2012 to 2022, you barely got any readings. A drop to 5% below the 100-day MA is not an impediment to further USD weakness, but it’s not a screaming go with right away either. It’s just a sign that you’re in a strong USD down trend and you probably want to sell rallies.
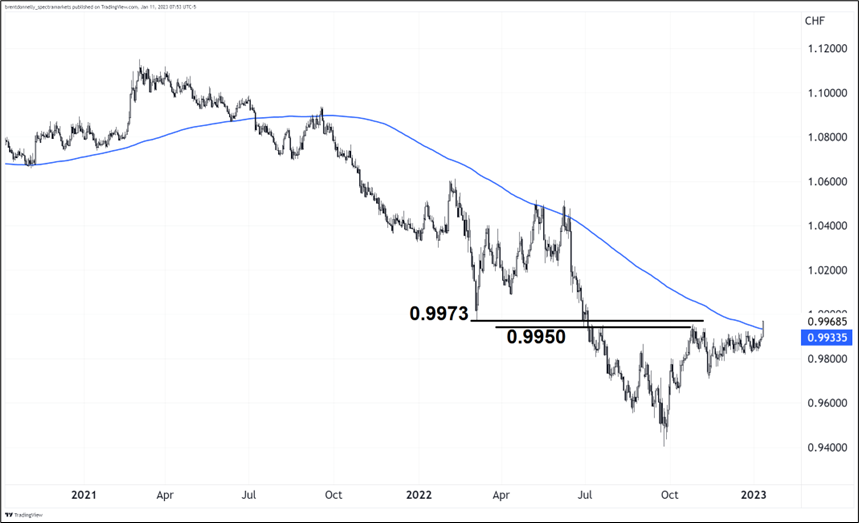
Everybody’s talking about EURCHF today as it plays catch up to the other euro crosses. The chart is a nice little breakout of the H2 2022 highs and the 200-day while the old support from early 2022 (0.9973) is right here. Long with a stop below 0.9900 is probably the way to play it if you are into breakout trading. Target 1.0400. Or, buy the dip to 0.9930/50. I don’t see much of a macro story here other than “EUR crosses are going up” so I’m not doing this, but it will probably work!
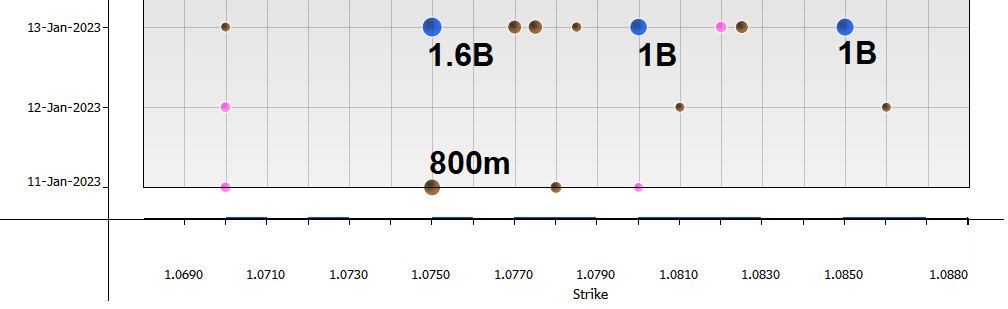
We have rallied enough in EURUSD to get near some short-term targets. This is reflected in the large batch of options expiring between here and 1.0850 over the next few days. The most notable is 1.6B of 1.0750s expiring Friday, but you can see there are others. These huge strikes tend to be good technical levels because the presence of the strike creates magnetism and trading activity at the level but also because the fact that speculators selected those levels means that they were viewed as important points or targets at inception.
If part of the reason technical analysis works is the self-fulfilling prophecy effect where levels matter because people think they matter, knowing the levels that specs choose when they buy options gives you some insight into what levels people are looking at or targeting.
Given the rabid interest in USDJPY downside, I was curious what the expiries look like there. Here is the output for the next 30 days.
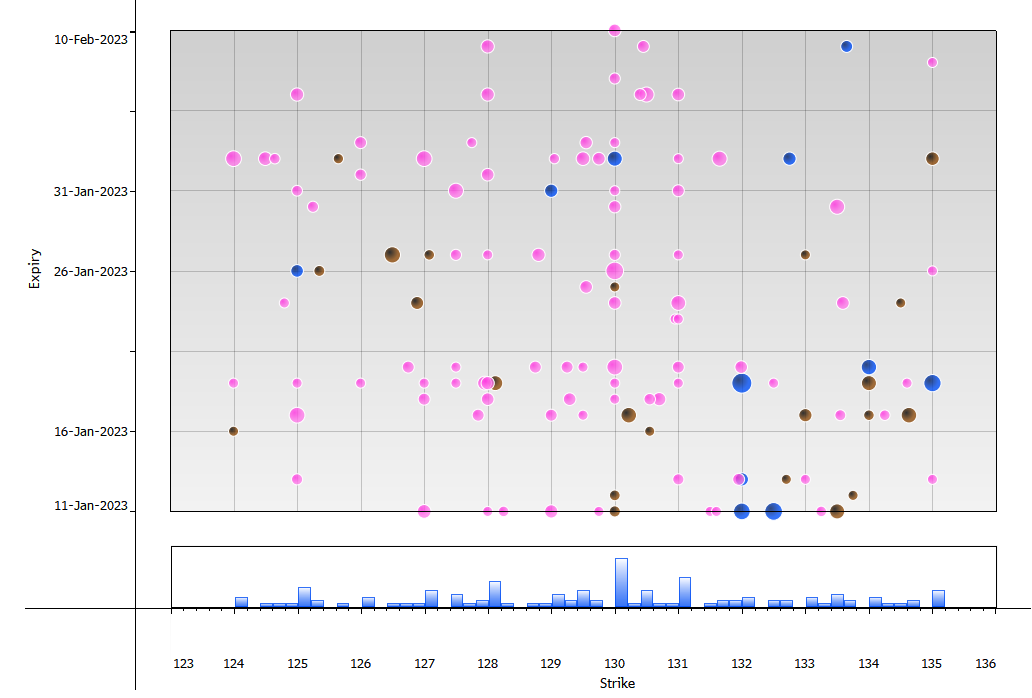
The little bar chart at the bottom of the graphic sums the totals and you can see that 130 and 131 show the greatest density of strikes. Again, this means 130.00 should be front of mind as a level.
AUDUSD is breaking a few hearts up here as it fails to gain traction despite 6-month highs in copper. I’m not sure all is lost. Maybe it’s just chewing through some selling and getting ready for the next leg higher. 0.7130 is the first major target for bulls. I suppose it comes down to CPI now in the short term. I thought we would get more of a push into the data as the pain trade is a weak CPI, but FX looks tired.
EURGBP is alive, first major target if we take out 0.8875 is 0.8925.
Have a heavyweight day.


This piece is mostly for people who are interested in backtesting

