• Looking at a couple of recession indicators.
• General thoughts on data: QoQ, YoY, real / nominal, leads and lags.
• SPX long was better than USDNOK short.
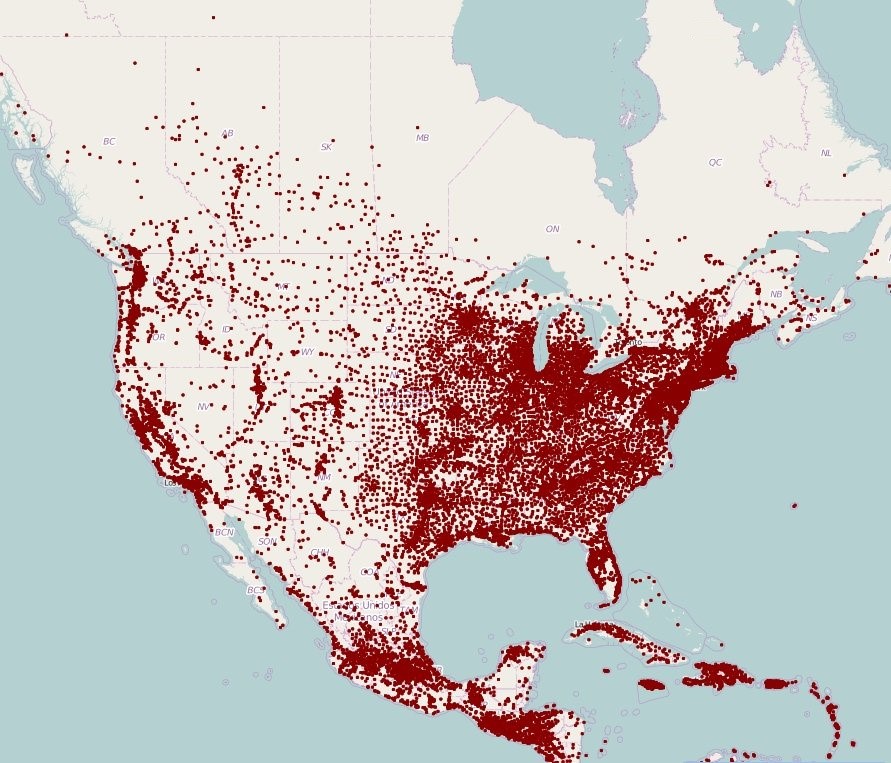
One dot for every town of
population >1000 in the
Northern part of the Americas

• Looking at a couple of recession indicators.
• General thoughts on data: QoQ, YoY, real / nominal, leads and lags.
• SPX long was better than USDNOK short.
One dot for every town of
population >1000 in the
Northern part of the Americas
Spot ref. 5.1850 on 10OCT22
Expires 11JAN23
October 28, 2022
First up, I am taking profit on the USDNOK short. The month-end signal is to sell USD but as discussed several times in recent months, particularly here (am/FX: RIP Month-End Models), the effect has moved to the left (earlier). When everyone knows something is going to happen at time X, they get ahead of the effect by transacting earlier. This is a standard market response to known patterns. They move left and get diluted over time.
I am nervous about next week’s Fed meeting because I think the read through from BoC and RBA and other central banks to the Fed may be a tad overzealous. This recalibration of fixed income volatility and narrowing in on a terminal rate was part of my reason for turning bearish USD and bullish equities on October 17 (am/FX: Based). SPX is up from 3650 to 3800 in that period, which is impressive given the cataclysmic tech earnings.
Now, we have priced out EU energy panic, we have removed risk premium for a UK sovereign debt crisis, and we think we have better visibility on a slowdown in the pace of Fed hikes after the Daly-Timaraos Tag Team Top in yields. But I’m not sure what drives the next leg higher from here and I think risks into FOMC are balanced as Daly and Brainard are still the only clear “let’s advertise we’re gonna pause soon advocates” and it’s hard to say exactly where the committee sits overall. There are many more members of the committee to convince.
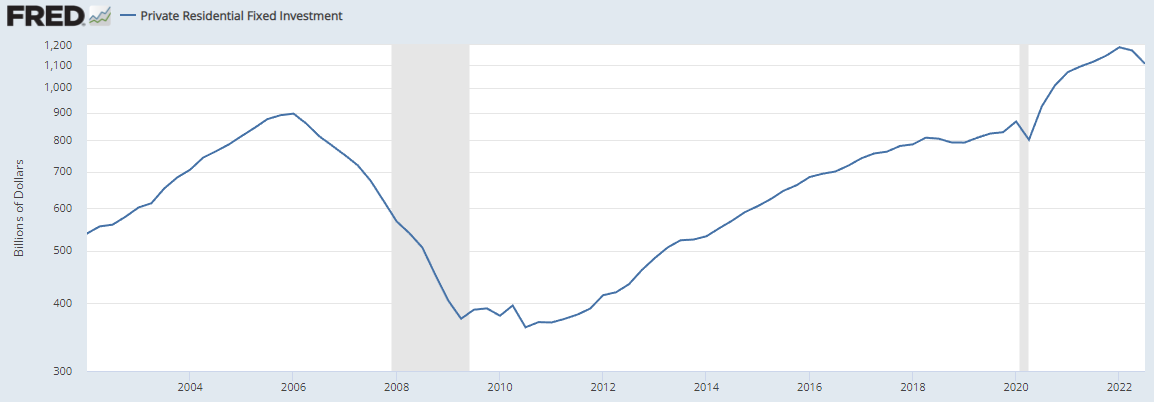
The big drag on the US and global economy is likely to be housing, and yesterday’s GDP number showed a huge drop in Residential Fixed Investment (RFI). One word of caution on the general angst around the Residential Fixed Investment figure yesterday. Those numbers are real, not nominal. Here’s how the two charts compare.
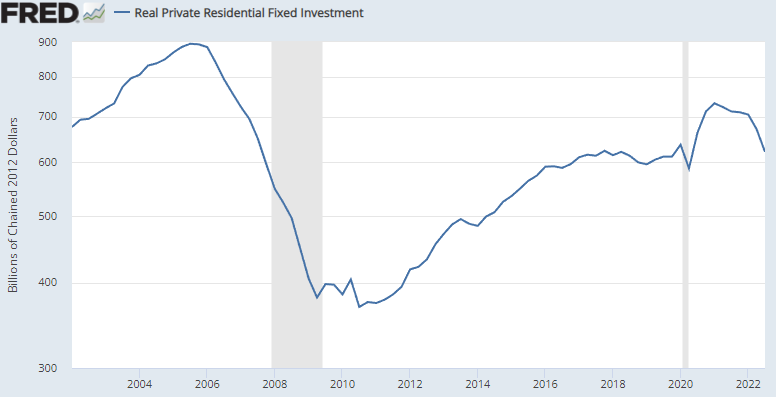
This is a useful example of how much difference it makes when you analyze the same data different ways. Here’s quarter-over-quarter Real Residential Fixed Investment:
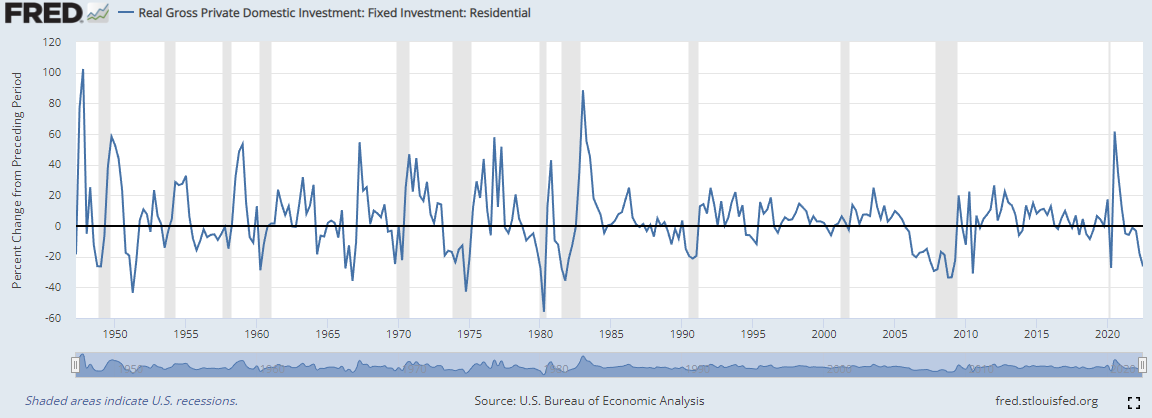
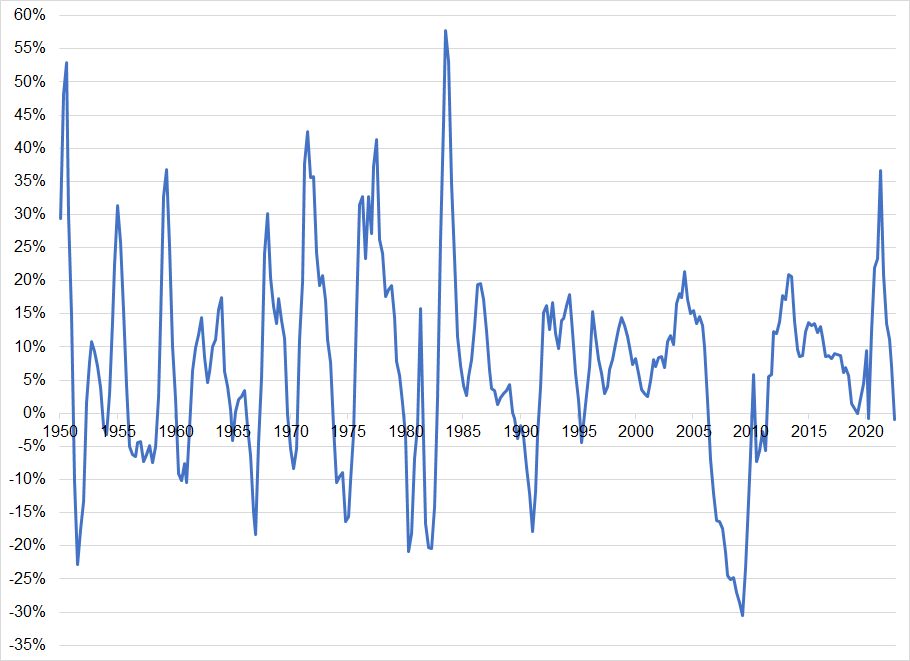
I am not saying you discount the real number; I just think it’s useful to know what you are looking at. Same goes with inflation these days as everyone that wants to sound dovish shows a 3-month rate of change of CPI while anyone that wants to sound hawkish shows YoY Atlanta Fed Sticky Core. There is an excellent book about this sort of stuff, written in 1954, but still super topical and useful. It is called: How to Lie with Statistics. The point of the book is not that people are actually lying, per se, but that there are so many ways to manipulate data that you, as a consumer of data, need to understand how it’s been massaged. It’s a clever title and the best-selling statistics book of all time.
Here’s another slice and dice of the same data. This one from a Julien Bittel tweet:
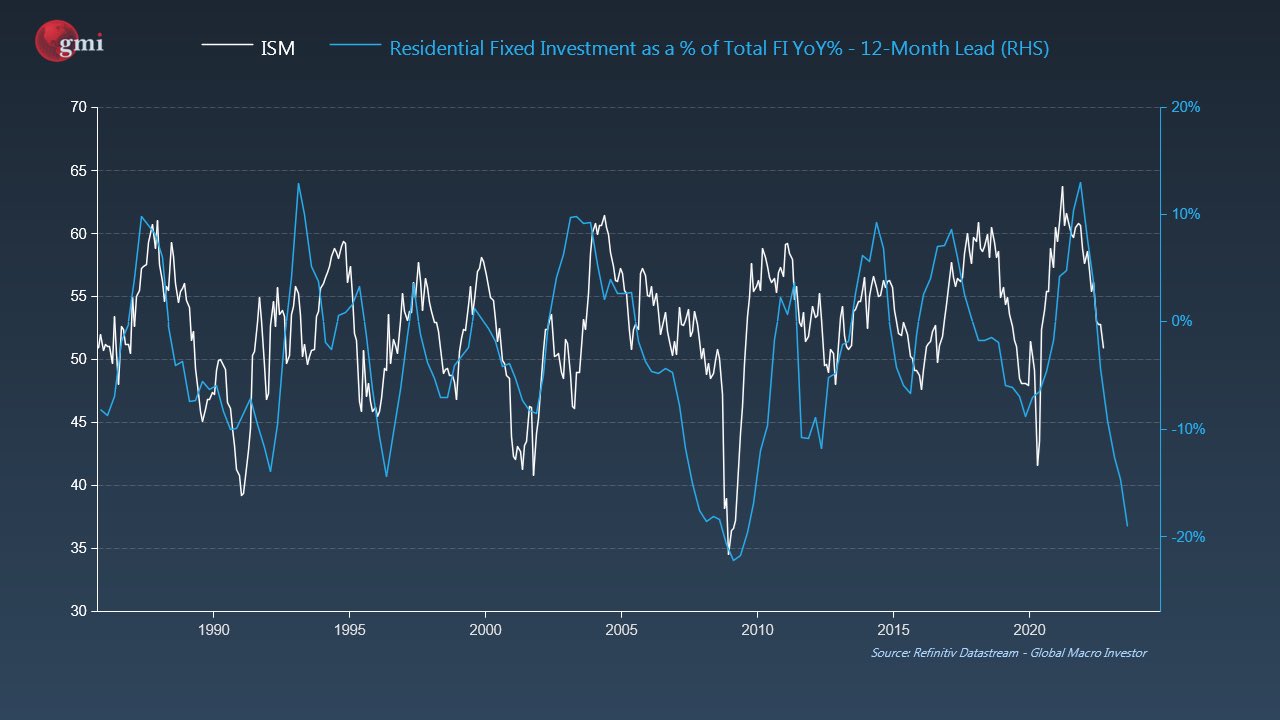
Again, this is a perfectly-valid approach, just another example of how real and nominal data, QoQ vs. YoY, and ratioed against another measure and lagged 12 months can all present different pictures. Overall, though, the picture is not great. 1995 is the only time we had a fall in Real QoQ RFI and no recession.
The Fed’s preferred measure of inflation finally inverted.
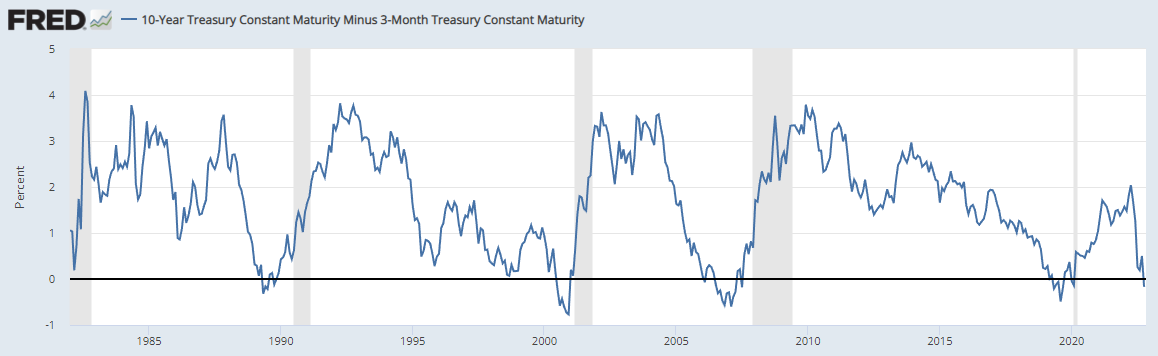
But as you can se in 2000 and 2008, this was an early warning signal, not a “recession is here signal.” Four out of the past four recessions have come after an inversion of the 10y/3m curve followed by a rebound of the curve back into right-side-up territory. Sidenote: It’s weird there is no clear and useful opposite of “inverted.” I feel like “verted” should be the word. As in “The US yield curve is verted about 95% of the time.”
Also, when I Googled “what is the opposite of inverted,” the autocomplete was oddly titillating.
So, my Fed view is kind of complicated at this point. I think the pause is on the horizon, and that’s why I was bullish stocks and bearish USD. But that view has rapidly been priced in and perhaps sentiment is vulnerable to an FOMC message that sounds more like “we’re staying the course and will pause if the data cooperates.” At 3650 that would be OK but at 3850, with housing in free fall, megatech in free fall, and month end out of the way, short USD into Fed feels like a bad trade. Also, FWIW, November is a strong seasonal period for the USD and it tends to crap out in December.
Interesting takeaway from my USDNOK trade: I was using USDNOK as a proxy for my bullish S&P view because I thought NOK being so oversold would mean that when stocks rebounded, USDNOK would move more on a vol-adjusted basis than S&Ps. That was wrong. Using my USDNOK parameters and comparing them to going long eminis at 3650 with a stop loss at 3489, the eminis made more than double the USDNOK. This does not mean you should never use FX as a proxy for stocks; you should just be aware the basis is gigantic when you pick the wrong expression.
Choosing the correct expression and structure of a view is a complex part of trading that new traders and non-traders have a hard time fully appreciating. “I was right, and I lost money” and “I was right, and I barely made any money” are common and painful outcomes.
Finally, the baseball World Series begins tonight. The Houston Astros are heavily favored to beat the Philadelphia Phillies. The last four times Philadelphia won the World Series were: 2008, 1980, 1930 and 1929. If you can guess what those years have in common, you are a good student of financial history.
This is an excellent example of how meaningless patterns appear when you compare two data sets. And yet, if the Phillies win, you might subconsciously raise your deep US recession probability. Have a well-mapped out day.
https://i.redd.it/w4advbxl7ew91.jpg


This piece is mostly for people who are interested in backtesting