
Is there a free lunch in 1-year USDJPY calls (or EURUSD puts) when carry is high?
My (admittedly straightforward) analysis points to: Yes.

Is there a free lunch in 1-year USDJPY calls (or EURUSD puts) when carry is high?
My (admittedly straightforward) analysis points to: Yes.

Jimmy uses two hands
to hold a hamburger
September 2, 2022
We were talking on the desk yesterday about how the big move in short-term rates here in the US has substantially changed option pricing dynamics. Because options are priced off the fair forward, a large interest rate differential means that the at-the-money (ATM) strike for a longer-dated option can be surprisingly far from spot. For example, right now the 12-month USDJPY forward is 580 pips which means the 1-year ATM option is around 134.35 (140.15 spot minus 5.80).
Therefore, investors like to use digital options as a simple way to capture the carry and be long USDJPY. If you buy a 1-year ATM digital call in USDJPY, the strike is roughly 134.35 and therefore if USDJPY doesn’t move (or goes down less than 580 points), your option will finish in the money, and you win. This is a decent margin of safety, and it makes the optics of these trades attractive. See end of note for definition of digitals.
The optics in emerging markets can be much crazier because interest rates are so high, but the general vibe with high-yield emerging market currencies is that people tend to expect currency depreciation equal to, or in excess of the forward. For context, USDTRY spot is 18.22 and the 1-year forward is above 26. It almost sounds like free money but obviously it’s not.
While the EM currency depreciation tends to be the risk with carry trades, it’s not as obvious if that mechanism always exists in G10. I thought it would be interesting to look at some history of USDJPY and EURUSD and the level of the 1-year forward to see whether or not there is a free lunch. That is, when there is a large cushion offered by the forward, is there a greater than 50% chance spot will be above the forward one year later?
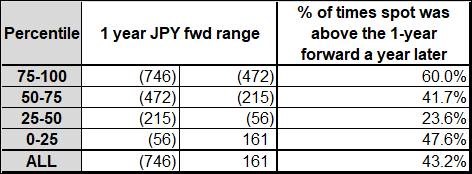
I am going to show the results two different ways, starting with a table. I broke the data back to 1990 into four buckets by percentile. The current forward of -580 is in the 88th percentile of all the data since 1990. The rightmost column shows the percent chance that USDJPY closed higher than the forward outright one year later.
Negative forward = higher US rates
The results are not wildly conclusive, but they do superficially suggest that owning 1-year USDJPY digital calls when the forward is wide like it is now could be positive EV. But if you drill more deeply into the data, it really just comes down to what regime you are in and whether or not that regime remains in force, or changes. The next chart gives you a nice history of the forward and USDJPY, along with whether or not spot closed above the forward one year later.

The blue bars are the forward, the black line is USDJPY and the purple binary indicator at the bottom is answering “Was spot higher than the 1-year forward outright, one year later?” In other words, did the ATM digital finish in the money? If yes, purple. If no, white.
The takeaways here are:
The USDJPY carry trade has two stages: 1) trend rally in USDJPY where you easily outperform the forward 2) crash. Up the escalator and down the elevator. My feeling is we are early still and USDJPY will remain on the escalator through the new year as Kuroda continues to press hard on the gas while every other CB slams the brakes. This sets up for an amazing “Kuroda is gone!” trade in 2023 and my bet is the market will start to anticipate Kuroda’s exit in approximately February 2023. Haruhiko Kuroda’s last day in office at the Bank of Japan is probably April 8, 2023 (renomination is highly unlikely, but not impossible.)
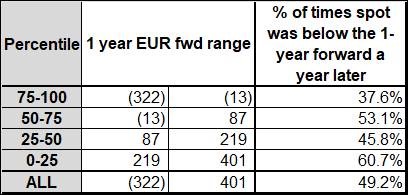
I was curious whether EURUSD looks the same, or different. Starting with the table again:
Positive forward = higher US rates
Again, when you have the 75th percentile forward or better on your side, you are around 60/40 to win. Past performance does not guarantee future results. The similarity of this table to the USDJPY table should not be a huge surprise since US rates and the USD are common factors in both analyses.

Takeaways:
My conclusion is that the 1-year forward, when wide, appears to provide a margin of safety for 1-year ATM options, especially if you get involved early on. The evidence is nowhere near conclusive. My analysis is pretty simple, and the trade relies on regime persistence, which may or may not be forecastable.
I think you buy 1-year 150.00 USDJPY digitals here and sell them in February before excitement builds about Kuroda’s departure.
I will run this analysis for a few EM currencies and publish that on Tuesday.
Next week: Monday is a holiday in US but not in the UK. Powell and Brainard both speak next week but I am not sure what they can add post-Jackson Hole. Their message (no pivot) has been received by the market. Now, we’re pricing 3.5% Fed Funds in early 2024. In July, markets were pricing 2.7%. Here are the curves:
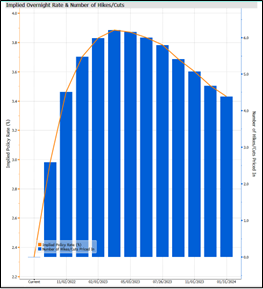
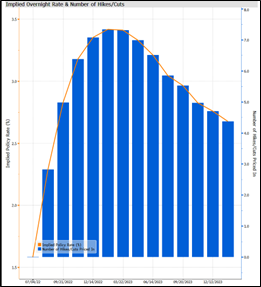
The curve past mid-2023 will always include some risk premium. Paying rates out there is always a bit like being short an SPX put. As such, there’s only so much it can move from here.
I hope you all have a golden weekend.
Happy birthday Craigger (t+1)
A digital option is a binary option that pays off if spot is above the strike (for a call) or below the strike at expiry (a put).
If I pay 20% for a 3month 1.34 digital in USDCAD .. spending 200,000 let’s say .. if USDCAD is above 1.34 at expiry in three months .. I get 1,000,000. It’s a binary bet; you either win or lose .. They are only available to institutional and private bank investors (as far as I know, no retail). More here:
https://bookdown.org/maxime_debellefroid/MyBook/classic-options.html (section 7.3)
https://corporatefinanceinstitute.com/resources/knowledge/trading-investing/digital-option/


This piece is mostly for people who are interested in backtesting

