BoC hike or no hike? Also, a question about gold.

SEC sues plasma ball at center
of solar system for closely
resembling bitcoin logo.

BoC hike or no hike? Also, a question about gold.
SEC sues plasma ball at center
of solar system for closely
resembling bitcoin logo.
Long USDCAD @ 1.3436
Stop loss 1.3244
Take profit 1.3644
Short EURGBP @ 0.8634
Stop loss was 0.8756, now 0.8681
Take profit 0.8444
June 7, 2023
The dollar selloff is not helping my USDCAD bull view, but I remain committed to the idea that the BoC will not hike today. There is a possibility that my trade idea could lose money, even if I’m correct, due to the mistimed entry point. This is always a challenge when you are focused on an event. If you get in early and it moves your way, you get a nice cushion and you mitigate some of the gap risk. If this happens, you end up with “good idea / bad outcome” issues due to tactics.
I went into USDCAD early on purpose because of the price action in oil, so it wasn’t random, it was just wrong. But now oil bounced and the USD is soft on the back of Nikkei jitters, the rebirth of AUD on rising RBA credibility, and general reflationary vibes over the past 12 hours. FX is mostly rangebound until next week’s CPI and FOMC.
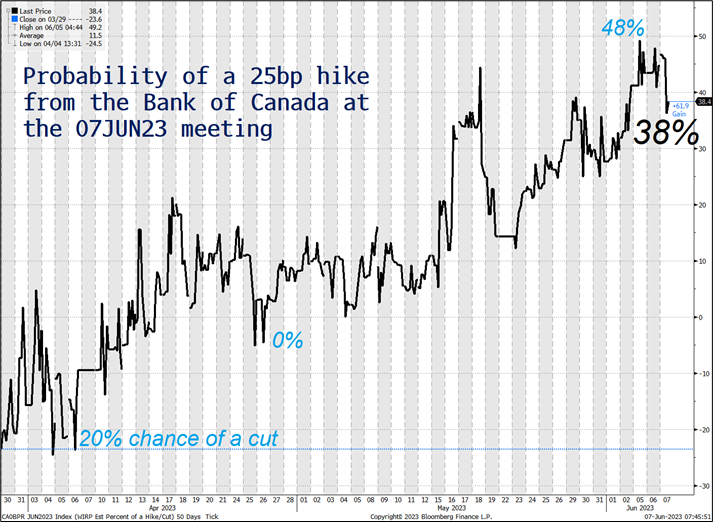
The question now is: how much will USDCAD move on the various outcomes? First of all, here is what is priced in. The odds of a hike at today’s meeting have moved slowly higher over the last two months, from a 20% chance of a cut in April to a high of a 48% of a 25bp hike and we go in with a 38% chance of a hike today. I think the real odds are more like 10%.
And here are the 60-minute moves after the last 10 BoC meetings:
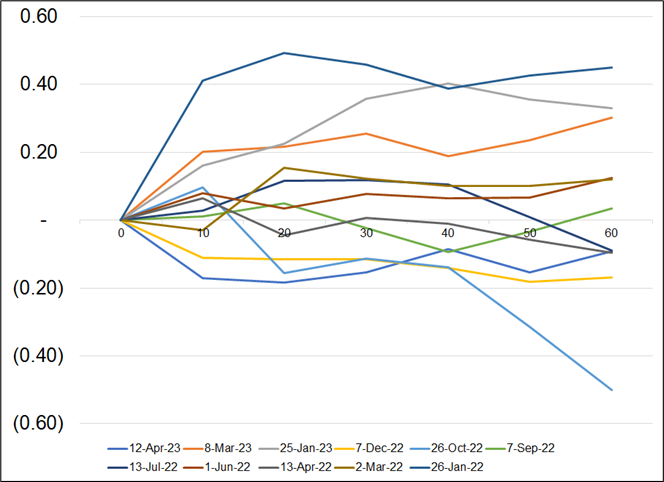
The average range in USDCAD these days has been around 82 pips (61bps). So knowing that past 1-hour moves on BoC day have maxed out around 40bps and average daily range is 61bps, you can’t really expect more than 40-50bps reaction from USDCAD. With pricing close enough to 50/50, that means 1.3460 or 1.3320 are about the most you can expect from no hike, and yes hike respectively. After that, it will be up to other markets like oil, NASDAQ, and the US bond market to decide the fate of the smoke-soaked CAD.
Chart-wise, 1.3450 is short-term resistance and 1.3300 is major support.
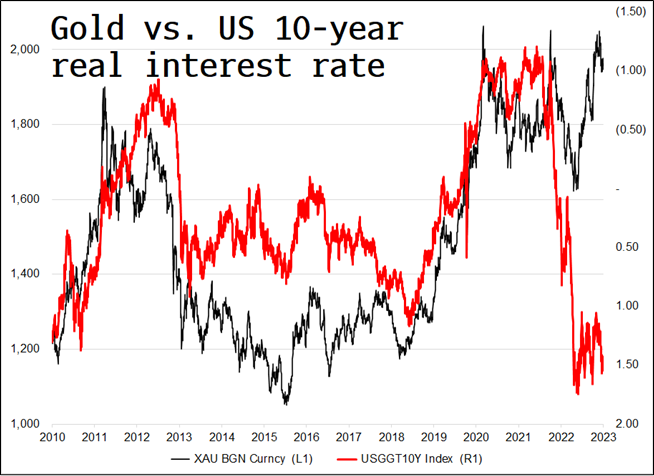
Other than central bank buying, does anyone have a good explanation for this? That triple top looks so ominous!
This Reuters article features an interesting and creative idea for wealth redistribution in Japan—but it feels a bit too much like shaking a magic money tree. Nikkei traded heavy overnight but I can’t imagine this story coming true anytime soon and even if it did, there would certainly be long lockups and/or vesting periods.
And… USDTRY did another 8% overnight.
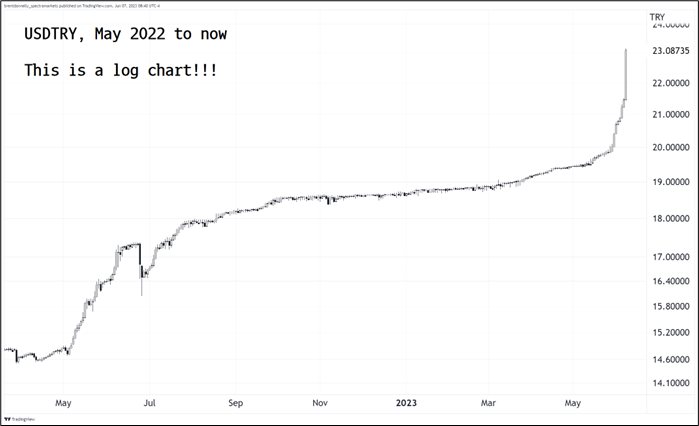
Finally, just a reminder next week is huge with US CPI, FOMC, ECB and BOJ next week. I know it’s only Wednesday but I like to look forward.
Have an almost (but not actually) circular day.
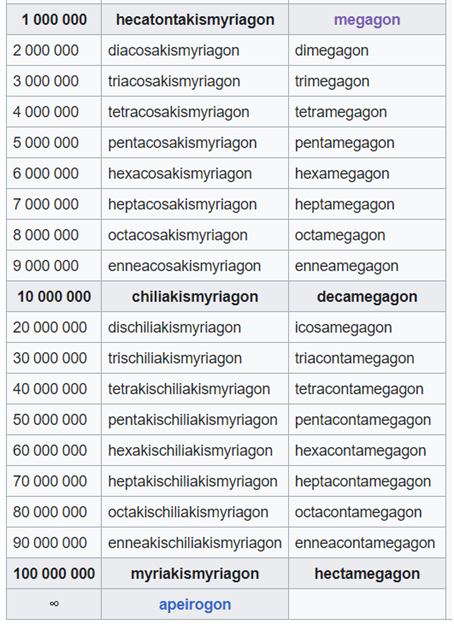
A megagon is a regular polygon with one million sides. To the unaided eye, it looks like a circle, but we know better. Each internal angle is 179.99964 degrees.
https://en.wikipedia.org/wiki/Megagon