July 17, 2023
China
One of the hallmarks of the period from the end of the Global Financial Crisis in 2010 to the start of the COVID response in 2020 was low global economic volatility. US CPI came in as expected every month, US yields were slow moving, jobs data was easy to predict, US GDP was mired in secular stagnation and China fired off GDP figures that were right on target the way dotcoms always beat earnings by a penny in the late 1990s.
In contrast, before 2008 and after 2020, stuff actually moved.
China GDP came out much weaker than expected last night and provides an excellent example of this pattern.
China GDP, Actual vs. Expected 2000 to now
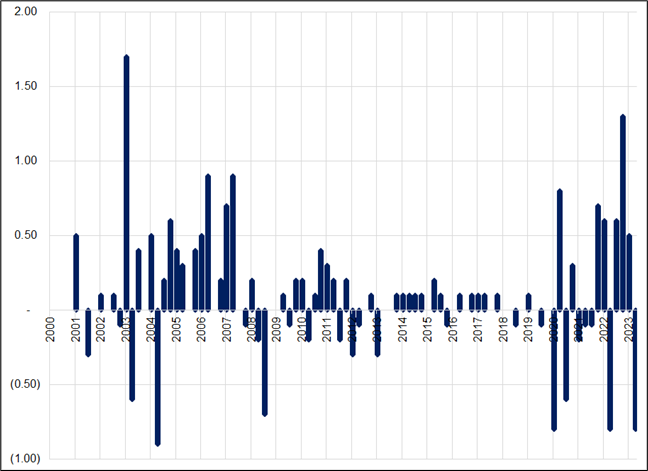
Note how often China GDP was better than expected in the years after they joined the WTO in 2001, and how volatility of GDP surprises disappeared post-GFC as China central planners hit the bullseye on GDP targets quarter after quarter. Now, with China mired in a balance sheet recession and pushing on a string as they try to revive the moribund consumer, volatility of GDP is back. Keep in mind: nominal China GDP was $2 trillion in 2004 and it’s $17 trillion now, so lower % GDP growth is mostly a reflection of the reality that the Chinese economy is now ginormous—and ginormous things don’t grow as fast as small things. Especially when they have horrendous demographics.
While China has been making more bullish noises re their tech leaders and this is viewed as a positive, I’m not sure that has much of a read through to anything other than those specific equities. Half-baked stimulus plus a policy shift on big tech might be good for KWEB but I don’t think it’s particularly bullish for commodities, AUD or NZD.
The secret plan to kill the US dollar
Whenever US officials meet with Chinese officials, a flurry of conspiracy theories follow as everyone speculates on the secret agreements that must certainly have been reached in these whisper-filled clandestine meetings.
This weekend, I read a variety of Substacks and Twitter threads that leaned on a variety of hypotheses, including mostly these two exact opposite theories:
- China smashed the USD upon Yellen’s arrival to show the US who is boss.
- China, (maybe Japan) and the US have agreed to a weaker USD in order to help grease the wheels of global liquidity and maintain the stability of the yuan (and maybe the yen.)
I mean… Sure? These sorts of explanations are appealing, especially because the USD drop started right as the wheels of Yellen’s plane hit the ground, and because the fall in the dollar has been extremely difficult to explain as the greenback has decoupled significantly from US yields. See here:
US 10-year yield vs. DXY, hourly back to November 2022
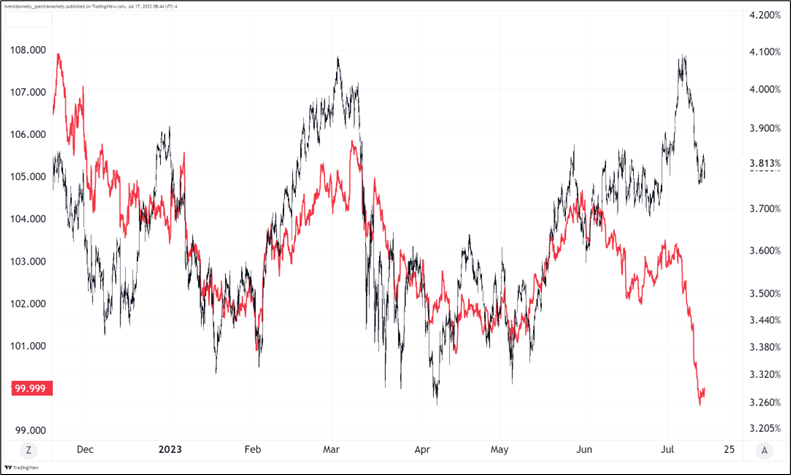
Did Yellen and Chinese officials agree on a weaker USD? Did China smash the USD to show who’s boss? Did Yellen trip out on hallucinogenic mushrooms? I mean, sure maybe. But recall the unbridled excitement about the secret Shanghai Accord in 2016? This next chart shows how the dollar traded around two US Treasury Secretary visits to the US and also around the “Shanghai Accord”.
DXY and China / US conspiracies
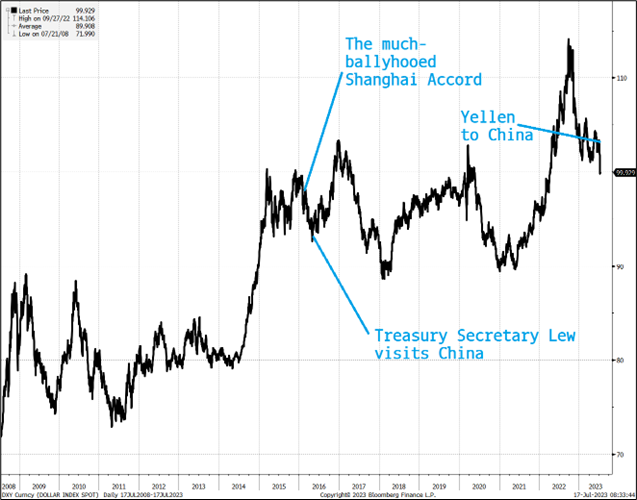
Again, I see the appeal of this sort of conspiracy theory because the USD weakness has been hard to explain, and the timing of the Yellen visit appears more than coincidental. But a world without coincidences would actually be harder to rationalize than one where coincidences take place now and then. I’m going to go with “coincidence” and chalk this USD move up more to CTA unwinds in USDJPY, real money buying of GBP, weak CPI, and renewed dreams of peak Fed Funds.
Here’s a good article on coincidences. https://www.theatlantic.com/science/archive/2016/02/the-true-meaning-of-coincidences/463164/
Canada CPI
Tomorrow we get Canadian CPI, and there is a correlation between not just US and Canadian CPI (of course there is) but also the misses in those figures vs. economist expectations. In other words, the US release contains information that can help you predict the direction of the miss in Canada CPI.
As longtime readers know, I’m always looking at these things from a probabilistic point of view—there are no sure things. But if you simply look at all the months US CPI was weak, you will see that the probability of a weak headline number in Canada has been closer to 60/40 than 50/50. This first chart simply looks at all months when headline CPI was weak in the US and sums the miss in Canadian CPI for each of those months. A lot of weak prints in Canada follow weak prints in the USA.
Cumulative sum of Canada MoM CPI misses when US MoM CPI is weak
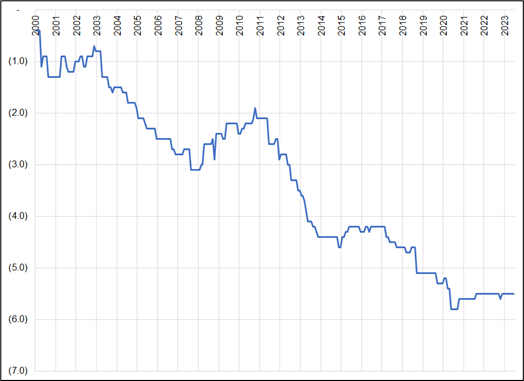
This next chart shows the raw monthly data for Canadian CPI miss or beat, only for months where US Headline CPI missed by exactly 0.1 (a somewhat common occurrence, and the case for the most recent US release).
Canada CPI (MoM, actual vs. expected) only in months where Headline US CPI missed by 0.1%
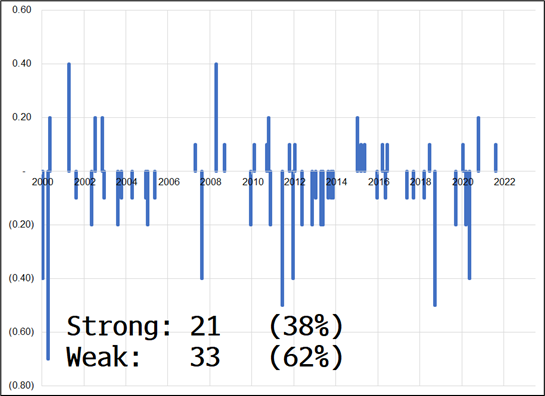
It is worth noting that US Core CPI does not seem to have any relationship to the Canadian Core Trimmed Mean or Core Median YoY series put out by Statistics Canada. Those outcomes look pretty random / unrelated to the US.
US Retail Sales
Tomorrow, we get US Retail Sales. Retail Sales has not been a huge market mover this year because the US economic focus has been on inflation and employment, not consumer spending. I think consumer spending will start to matter again and therefore US Retail Sales is worth watching closely. The days of the plump consumer gorging on stimmies are drawing to a close at some point in the next six months, probably, and Retail Sales should help determine the timing of the drawdown in excess savings and any angst over the restart in student loan payments.
As inflation comes down, it will be tougher for Retail Sales to perform because it is a nominal series. Economists seem to have underappreciated this fact in their estimates this year as you can see in the chart below.
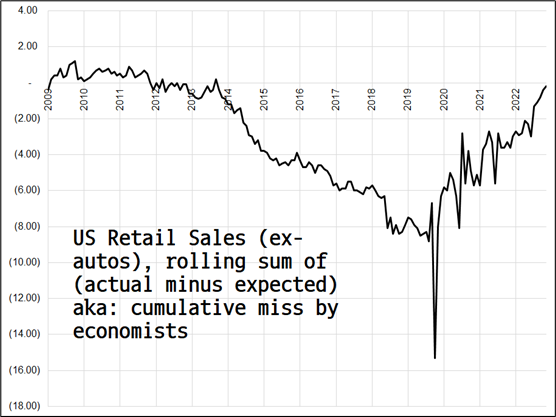
The chart shows the rolling sum of Retail Sales misses (actual vs. expected) back to 2000. You can see that economists persistently overestimated the consumer from 2014 to COVID as secular stagnation and zero price pressures created a malaise of sorts (i.e., Retail Sales were mostly weaker than expected) and then economists underestimated the roaring nominal revenge spending once the COVID masks came off. Higher prices raise Retail Sales, even if volumes are flat. This has been a focus of Sam Rines as he has nailed the Price over Volume theme all year. See here and here.
Wonky sidenote: there has been much hand wringing over the Johnson Red Book numbers, which have turned negative year-over-year. I built a simple model using the monthly change in Johnson Red Book to predict the official Retail Sales data and it was a good predictor from 2011 to 2019 but became an inverse predictor during and after COVID for some reason. As such, I would not place any weight on Johnson Redbook right now because post-COVID there is something in their black box that does not match the black box used by the Department of Commerce.
I’m not taking a strong view on Retail Sales because the BofA card data was weak, but in the other direction it seems like economists have been overweighting Johnson Redbook since COVID and for whatever reason, it’s been a faulty indicator or red herring. This chart shows a rolling index comparing the Johnson Redbook prediction vs. the official data. If Johnson Redbook is correct, you add 1 and if it’s wrong, you subtract 1. You can see it was most often right before COVID and wrong afterwards. With stronger consumer confidence of late, Retail Sales is a mixed bag. No prediction.
Index of the performance of using the Johnson Redbook to predict US Retail Sales vs. Bloomberg median Economist prediction (+1 if Johnson Redbook was better than economists, -1 if it was wrong)
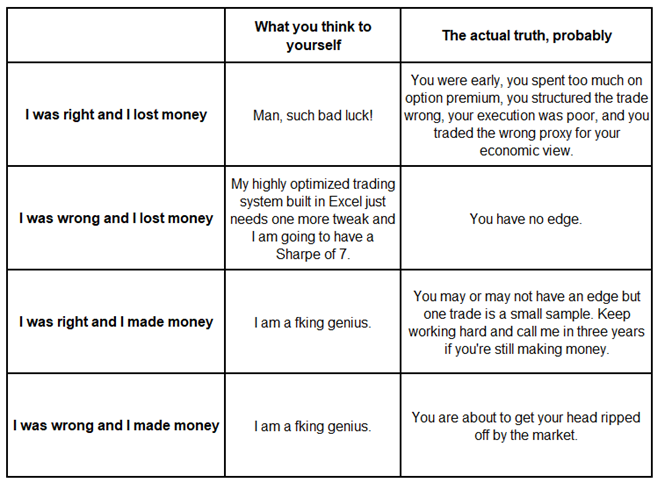
Good decision, bad outcome
Here is a quick excerpt from last week’s Friday Speedrun that explains the four ways you can make or lose money in the markets…
Final Thoughts
My view remains that this USD selloff is mildly suspect and USDJPY should now hold in a bullish consolidation 138/141 (as discussed in Friday’s piece). As long as EURUSD is above 1.1080 and GBPUSD is above 1.2980, I cannot be short either one because those are such epic daily chart breaks. NZDUSD shorts look interesting as well, but I need to do a bit of work on the CPI data there (out tomorrow night NY time) before I consider getting involved.
I remain bullish USDCAD into tomorrow’s Canadian inflation data (see sidebar) and I’m starting to think EURCHF and USDCHF are interesting longs as inflation has peaked in Switzerland and is below the 2% cap and the entry points are looking interesting. No call to action on the CHF yet, though, as I need to identify some sort of timing catalyst first.
As always, see page 1 sidebar for live trade ideas.
Have a Marvelous day. Snikt.
good luck ⇅ be nimble