
The economic and political calculus in a world of falling inflation, strong jobs, huge UST issuance, and solid growth is… Complicated.

The maximum size for a pdf is 381km X 381km

The economic and political calculus in a world of falling inflation, strong jobs, huge UST issuance, and solid growth is… Complicated.
The maximum size for a pdf is 381km X 381km
January 25, 2024
First of all, I used PredictIt data from Bloomberg to plot Trump vs. Biden odds yesterday, but I was informed that those odds are wrong. The real odds look like this:
US Election Odds (from a gambling website aggregator)

https://electionbettingodds.com/ Thx LB!
That’s much different from an even race. People sometimes say, “Well yeah but the gambling odds are often wrong!” That’s true, but the point of the exercise here isn’t to forecast the outcome of the election, it’s to identify what is priced in. These gambling sites have decent if not UST-like liquidity. These figures are as good as it gets in terms of measuring the broad consensus.
Second, I dug into a few ways to slice and dice tomorrow’s Core PCE release and came up with no strong signal. While it’s tempting to think that the drop in PPI or today’s GDP Price Index miss are useful information, it seems that they are not. If you filter for only the months where PPI missed, for example, PCE and Core PCE do not miss, on average. Economists’ models most likely include PPI (of course) and the GDP Price Index is too noisy (and only quarterly) to offer any heads up on PCE.
I will say, you would be hard pressed to find someone out there who is positioned for a strong PCE tomorrow. The lean is heavily towards flat or lower. I don’t see much point in positioning into PCE because we have FOMC and QRA next week, but the shock release would be a 0.3.
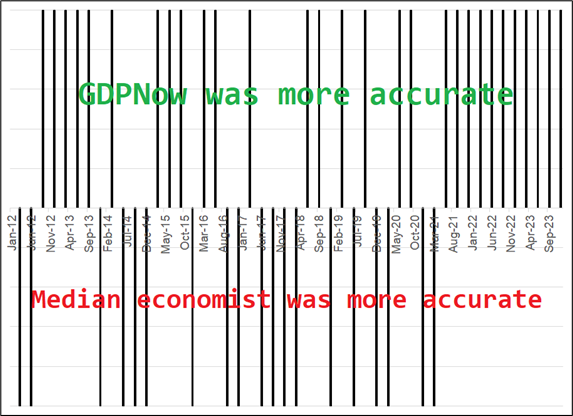
And while the number is already out, just a reminder that GDPNow is much better at forecasting GDP than economists are. The Atlanta Fed measure has now correctly predicted the direction of the miss in GDP for 11 straight quarters. And it’s not like it just predicts strong every time. It was right on the downside 5 times and the topside 6 times. It’s a useful indicator. It’s doing the same thing economists are doing (incorporating incoming data into a model), but it has no bias.
Here is the history, which shows 29 out of 40 correct for GDPNow and a nice streak hitting 11 of the last 11.
Quarterly GDP, actual vs. expected—who wore it better?
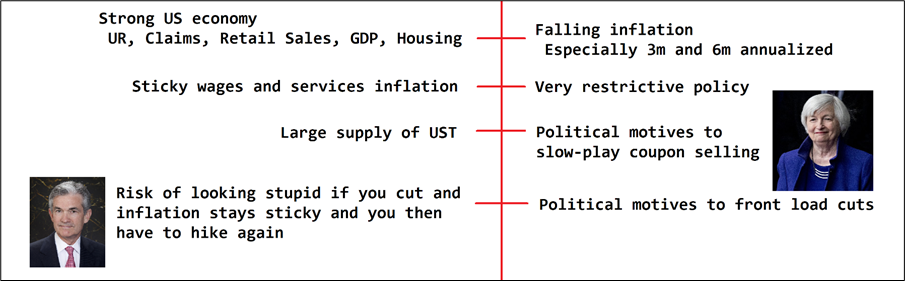
Nobody wants to be long USD right now because of PCE, QRA, and FOMC. This makes sense, but there is a divergence between the data and the policymaker lean. US data remains strong, disinflation is here but not confirmed to be entrenched. Again, all the shock factor would be the hawkish outcomes but I have no real reason to believe Yellen or Powell will be hawkish. They don’t seem to be too worried about sticky services or high wages or any of that stuff. The current regime has enough variation in data that everyone can choose their own adventure. Wanna be hawkish? Look at services and wages and UR and Claims and Retail Sales and GDP. Wanna be dovish? Look at 3-month or 6-month inflation annualized.
Looking at those short-term annualized figures seems fraught to me given housing continues to chug higher, wages are not coming off, and the US economy is strong like bull. But then you also have to sprinkle 10 or 15 teaspoons of politics onto the whole mixture and game theory the policymaker incentives and objectives. Is Powell more scared of cutting and then having to hike again because he called inflation wrong? Or is he more scared of Trump 47?
I’ll tell you on February 1st. The complex situation in graphical form:
One of the most interesting macro writeups I have read in a while here from Paulo Macro.
The David McWilliams Podcast is very, very good. The one covering the Milei speech (here) was particularly interesting—David’s style (edgy funny + super smart) resonates with me. Thanks Stephen for the heads up.
Also, check out Jason Cummins (Brevan Howard’s Chief Economist) on Odd Lots. His views are interesting but even more interesting are his frameworks and some of the cool words and terminology he uses “e.g., designer indicators”.
Possible Mercator projection issue here, probably not a perfect square
Beginning with PDF 1.6, the size of the default user space unit may be set with the UserUnit entry of the page dictionary. Acrobat 7.0 supports a maximum UserUnit value of 75,000, which gives a maximum page dimension of 15,000,000 inches (14,400 * 75,000 * 1 ⁄ 72). The minimum UserUnit value is 1.0 (the default).
15 million inches happens to be exactly 381 km.


This piece is mostly for people who are interested in backtesting

