
Cracks are appearing as there is an unmistakable trend in the post-SVB US data.
subscriber-only
Cracks

Current Views
06APR 0.6800 AUD calls
for around 32bps off 0.6762 spot
26APR 11.10/10.90 EURNOK
put spread ~34bps
11.30 spot
Short EURNOK @ 11.30
Stop 11.5610 / Take profit 10.9150
21JUN USDJPY
123 digital put @ 20%
spot 131.30
20JUN USDCHF
0.8850 digital put @ 20%
spot 0.9275
April 5, 2023
Cracks
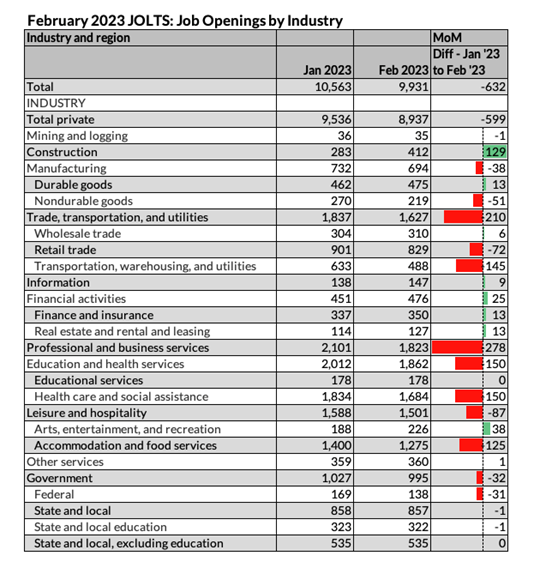
The reaction to yesterday’s data is perhaps the most interesting thing going on in markets right now. Stocks rallied on Monday’s weak ISM release but then turned lower on Tuesday’s weak JOLTS. The whole bad news is good or bad news calculation is fiendishly complex and generally comes down to what kind of landing is implied by the data. I think Monday’s ISM, with its weak guts (new orders and employment each down 3 points MoM) was more worrisome than the drop in JOLTS, but perhaps it was the bam bam double shot of bad data that mattered, not JOLTS in isolation.
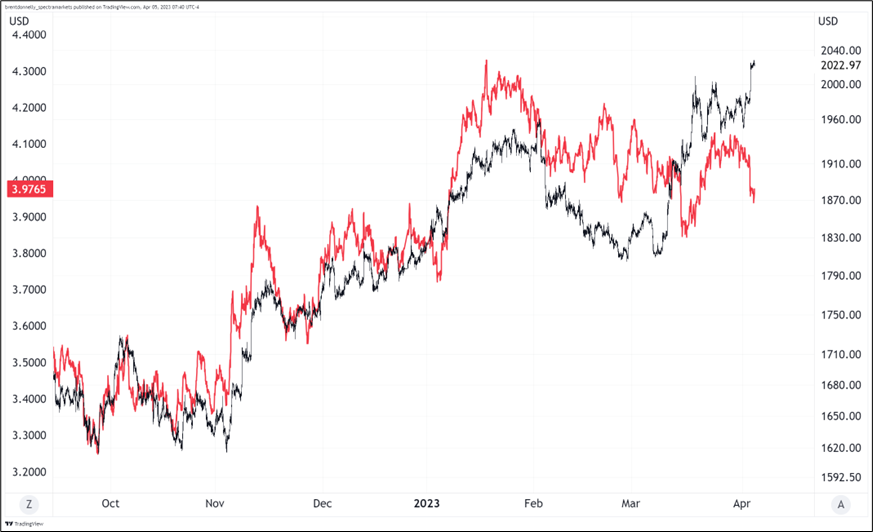
The other notable reaction was the aggressive decoupling of gold and copper as you can see in today’s first chart. Of the 8000+ trading days since 1993, only 0.5% have seen a move up in gold of >1.75 SD and down in copper >1 SD. I mapped these days against yields and a few other things, but I could find no signal.
Gold and copper hourly back to September 2022
My thesis on the USD short trade was “get short US economic surprises” as a brittle and nervous economy and commentariat would react quickly to the tightening of lending standards that was already happening before SVB and CS and is likely to accelerate thereafter. I chose a 3-month tenor on those options because it’s hard to know how quickly this stuff will show up in the data. Given the format of the ISM questionnaire is essentially: “How you feeling compared to last month?” It makes sense we have seen a quick drop there. Then again, the timing of the survey matters because the banking stress didn’t start until March 9th.
The thesis is playing out well, so far, but today’s ISM is a critical test because now everyone is leaning that way. Still, my feeling is that the guts of Monday’s release were bad enough that now-stale forecasts for ISM Services are likely to be too high. That is, I think the number will miss.
On the other side of the ledger, my thesis on AUD (RBA hawkish) and NOK (benign risk environment and a major bottom in oil) are looking bad. I am experiencing the asymmetry of NOK as I described in “am/FX: Long NOK is not long Norway.”
If the USA is truly slowing, and the US labor market has peaked, that is not good for MXN. If you are long MXN, I would keep a particularly close eye on ADP today and claims tomorrow. A significant percentage of observers believes that MXN strength is reliant not just on high real rates (check!) but also on a steady flow of remittances from the US. If the US labor market cracks, expect MXN to crack, especially as carry trades like long EURMXN remain crowded.
USDCHF
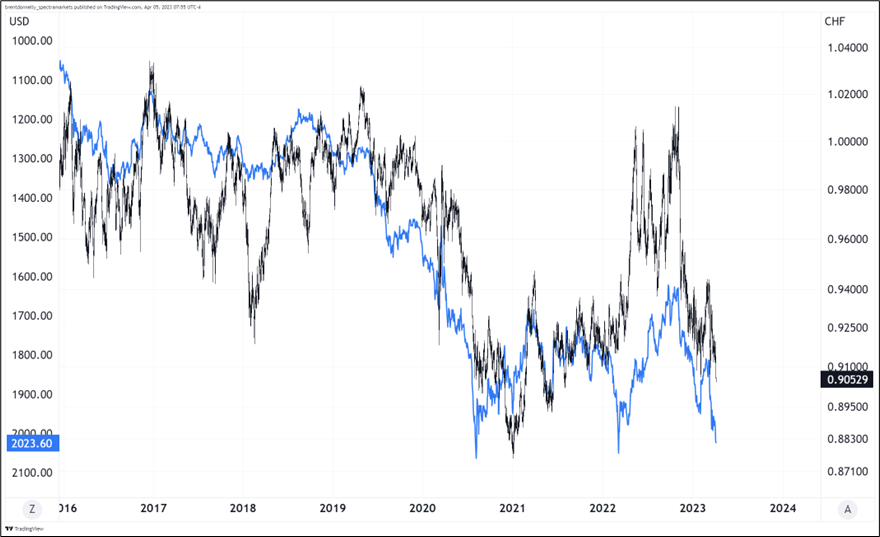
USDCHF doesn’t get much airtime these days because it’s mostly just EURUSD with a random EURCHF factor, but there is a level of economic weakness and equity weakness where the EURCHF kicker helps you. We are probably close to that point and that’s why I like USDCHF a bit better than EURUSD. This is especially the case with gold exploding as USDCHF is a bit more correlated to gold than EURUSD.
Here is USDCHF and gold on the daily chart, just to give you a sense of it.
USDCHF and gold (inverted) hourly back to September 2016
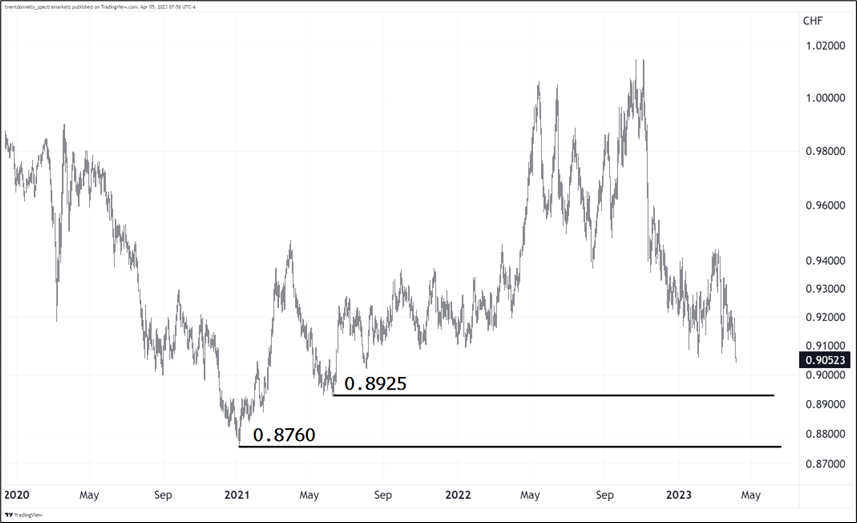
And here’s USDCHF with the major supports marked.
USDCHF back to January 2020
Final Thoughts
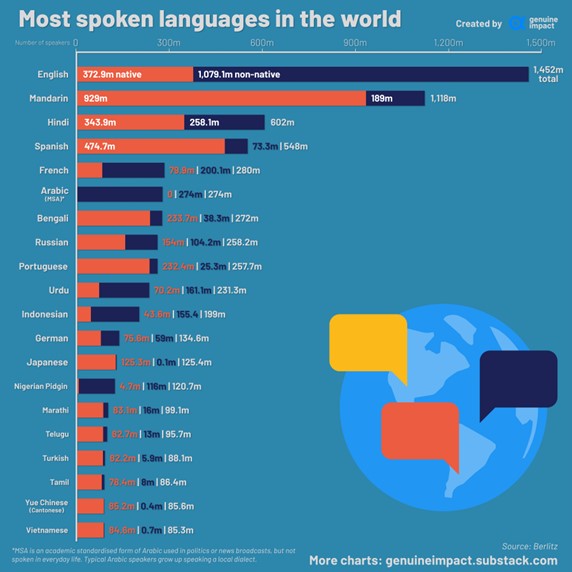
Nice table from @danielbzhao on Twitter:
Don’t forget to tell any students or juniors you know to sign up for Friday Speedrun.
Have a linguistic day.