The BOJ / MOF / JPY setup and result are the same as December 2022.
Full chart (including the most enjoyable activities) at bottom of am/FX

The BOJ / MOF / JPY setup and result are the same as December 2022.

Full chart (including the most enjoyable activities) at bottom of am/FX
Sell CHFJPY 171.89
Limit order
Stop loss 173.65
The BOJ followed the December 2022 playbook and joined the MOF in spurring another yen revival. The JPY, recently left for dead, is now back to levels not seen since… Three months ago. Given the similarity of the setup and the move to the hawkish BOJ meeting in December 2022, the first thing I want to do is see what happened that time. Here it is.
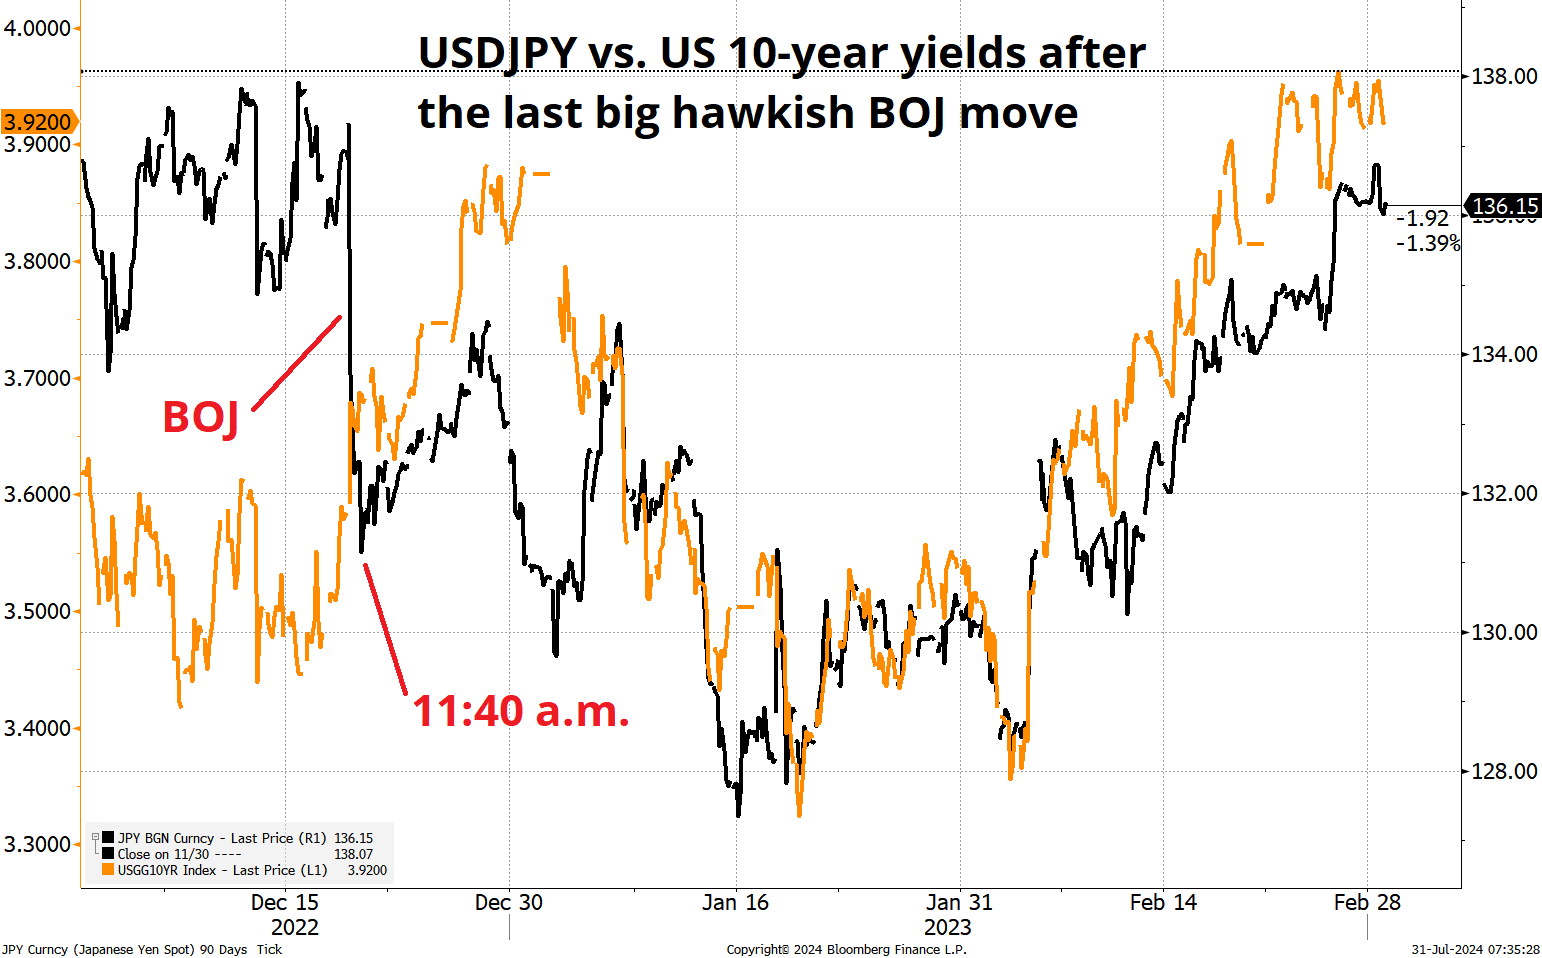
The orange line shows US 10-year yields, and the black line is USDJPY. I show the price action from the start of December to the end of February, with the December 20th BOJ meeting marked.
You can see that USDJPY bottomed at 11:40 a.m. the day after the BOJ announcement and then simply went back to following US 10-year yields. This makes sense as BOJ moves tend to be one-offs for USDJPY, while US yields remain the defining anchor most of the time.
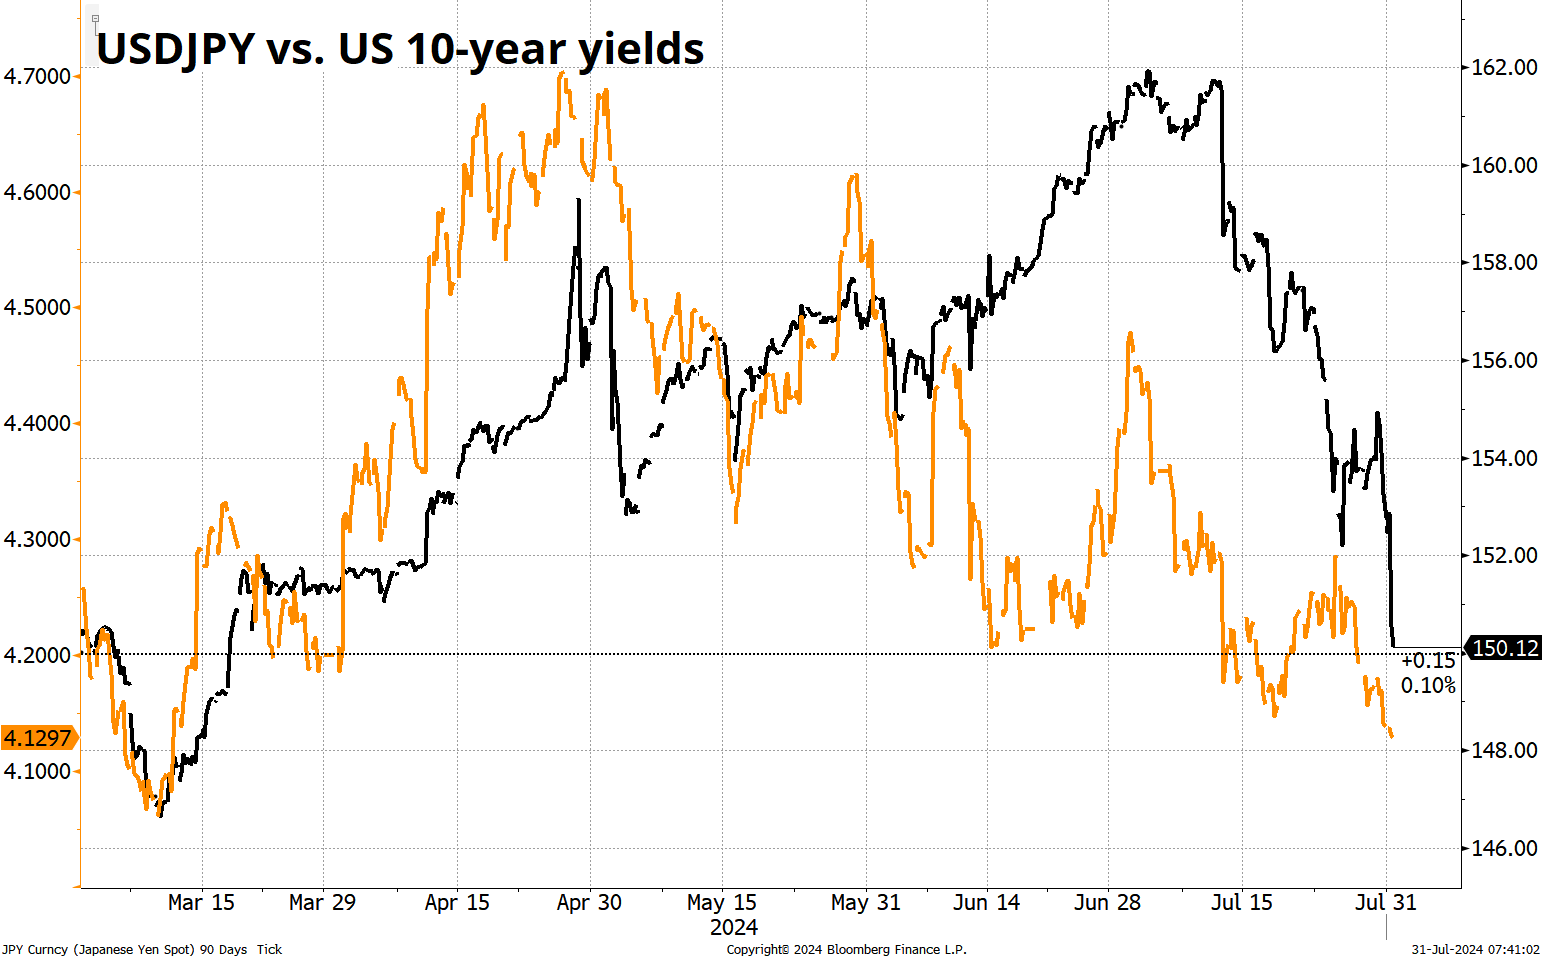
If you look at the exact same chart for March 2024 to now, you see a different pattern but a similar story as US 10-year yields have been leading for ages and now USDJPY has finally caught up.
Perhaps a more informative chart is the spread between US and Japanese yields.
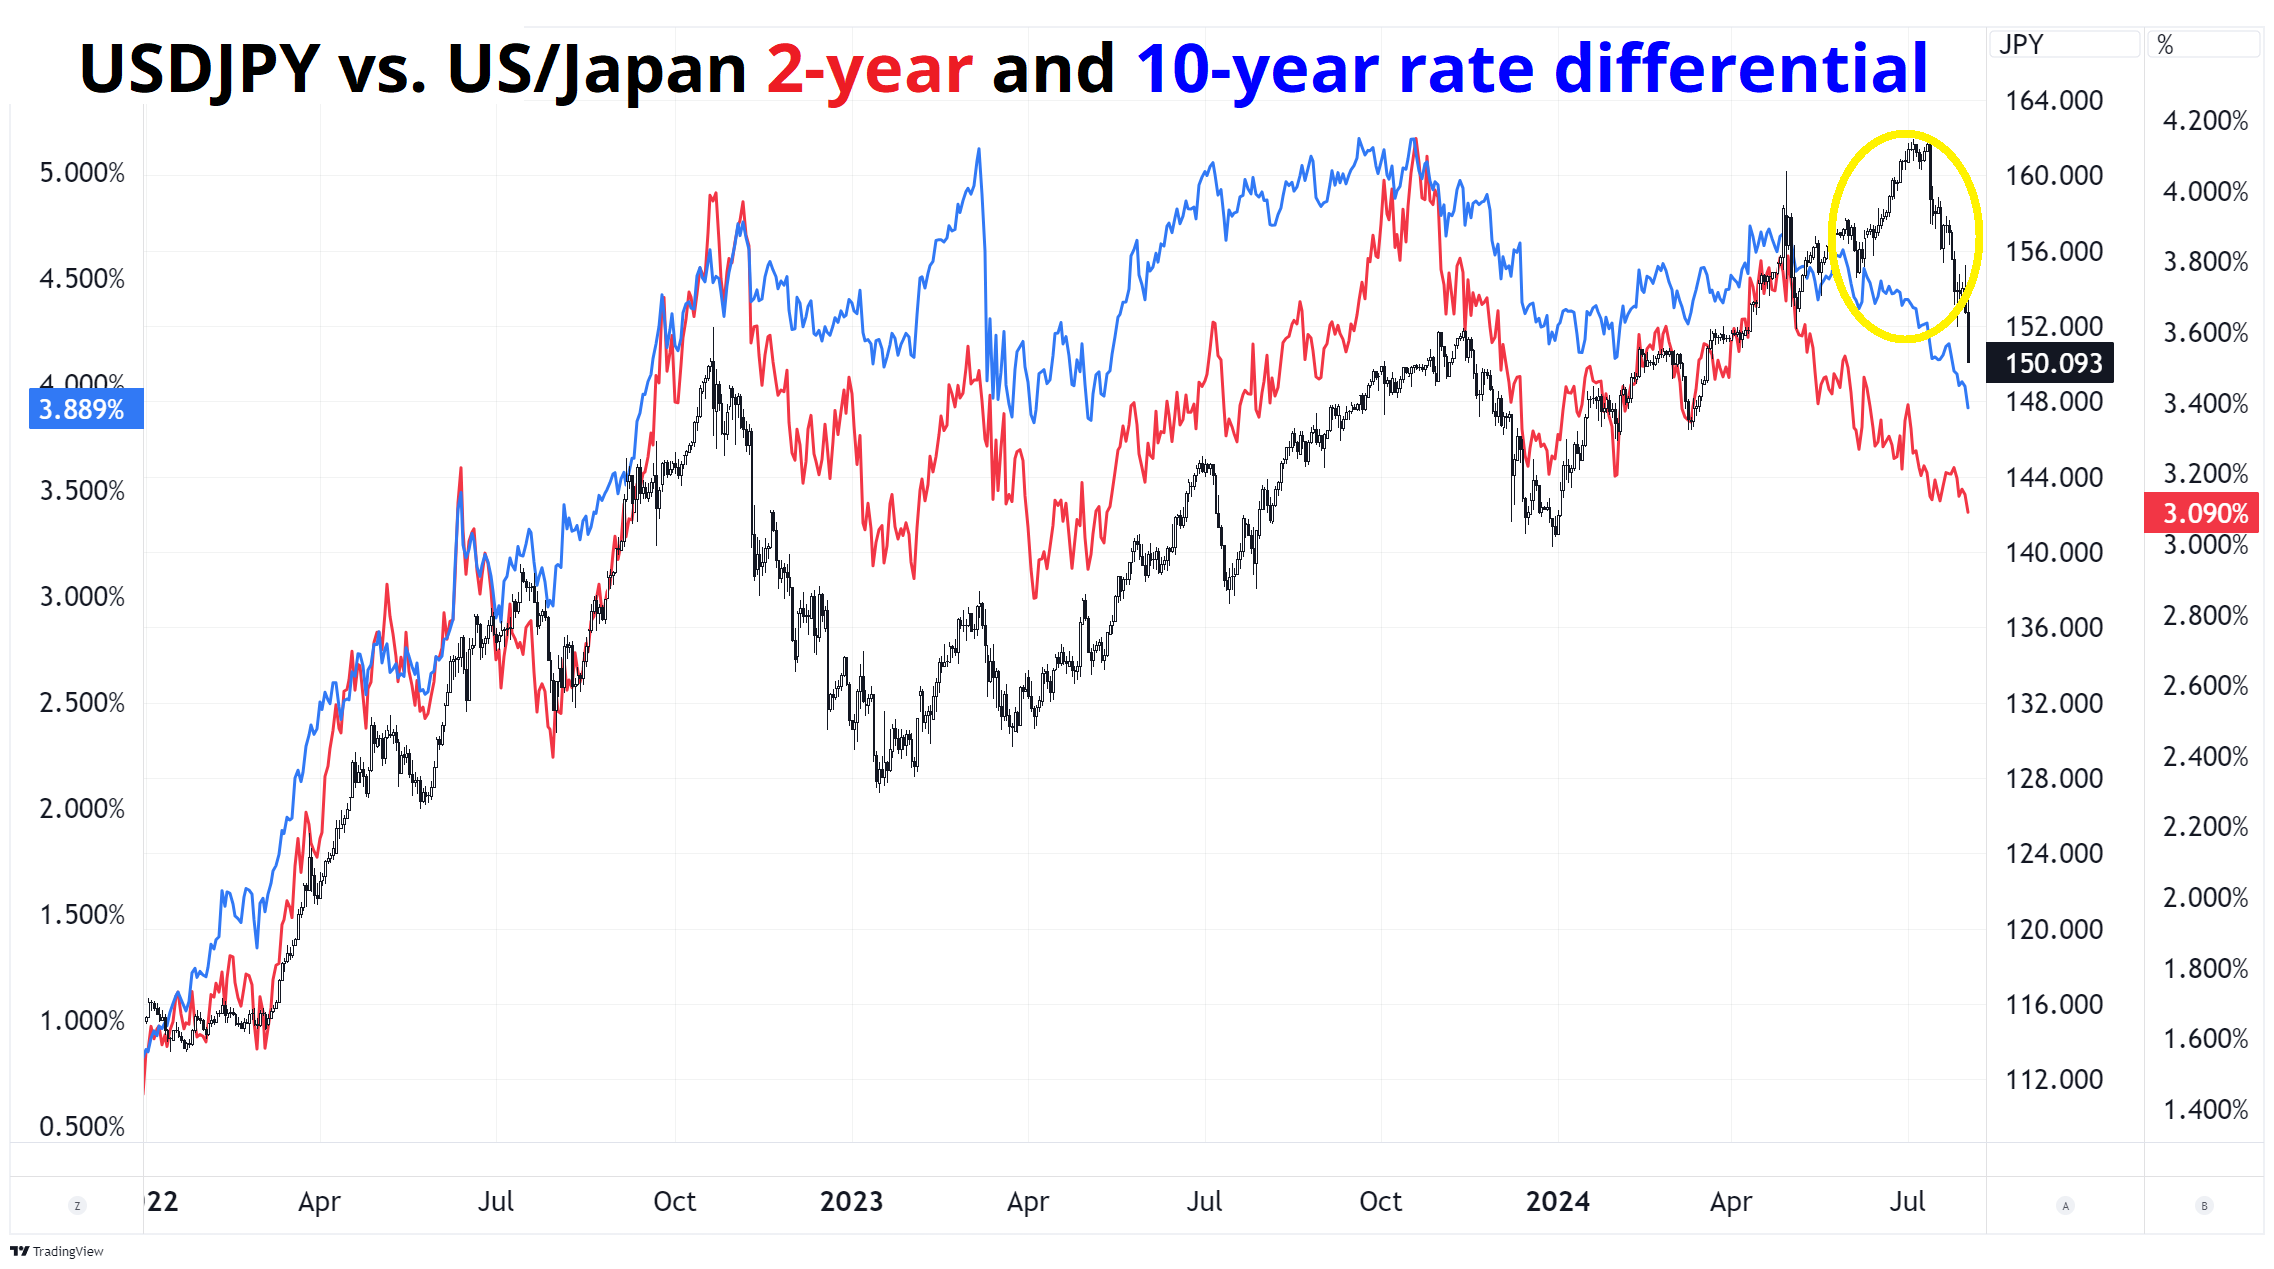
That yellow circle was a period of extreme pain for anyone trying to trade USDJPY off rate differentials as the turn lower in yields started in early June and USDJPY proceeded to rally another 500 pips before peaking and now finally reconverging with a lot of help from the MOF and the BOJ in tandem.
I am biased to something similar to December 2022, where we find a bottom today in NY and then return to watching yield differentials. These will primarily be driven, once again, by the US story. Chart-wise, the epic 152 level is absolutely the one to watch, still. Now that we have sliced cleanly through it, 151.85/95 is the sell zone. If you are bearish USDJPY based on what just happened with the BOJ, I would wait to sell there.
One more observation on USDJPY: There are barely any major strikes down here. That is interesting and informative. It probably means that very few people have caught this move via options. See the chart.
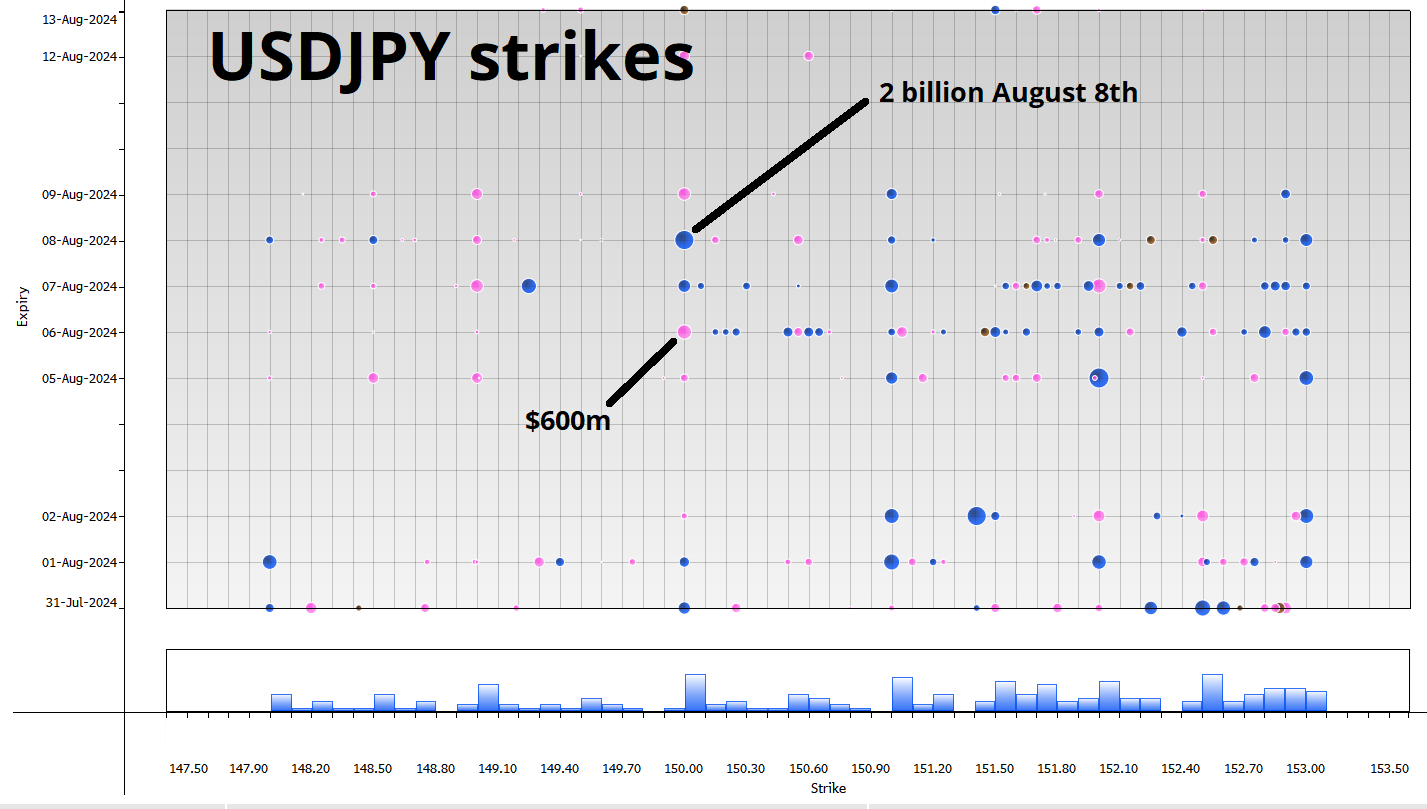
I labelled the $2 billion on August 8th and the $600 million on August 6th so that you have a sense of perspective on what the bubbles mean. Larger bubbles = bigger strikes.
Meanwhile, the Kamala Harris story continues to percolate and while we have spent all year discussing the Trump Trades, maybe it’s time to think about the Kamala Trades instead. If she gains a bit more momentum, the betting odds will likely shift to 50/50, and forward-looking markets will need to think about:
At the margin, politics, yields, and economic momentum are starting to suggest a lower USD is coming.
The standard model for month end trading is when US equities get hammered, you see USD buying into 11 a.m. on the last day of the month (and vice versa). That said, I don’t think we will see any predictable move today because:
The chart below is the craziest thing I have seen in a while. Swiss yields are below Japanese yields now and the momentum in CHFJPY has turned. Sure, short CHFJPY was the widowmaker for ages. But maybe no mas. The CHF trade is a baby getting thrown out with the bathwater on the carry blow up, but if anything this action by the BOJ makes the CHF more attractive as a funder, not less. In today’s sidebar I recommend selling the rally in CHFJPY.
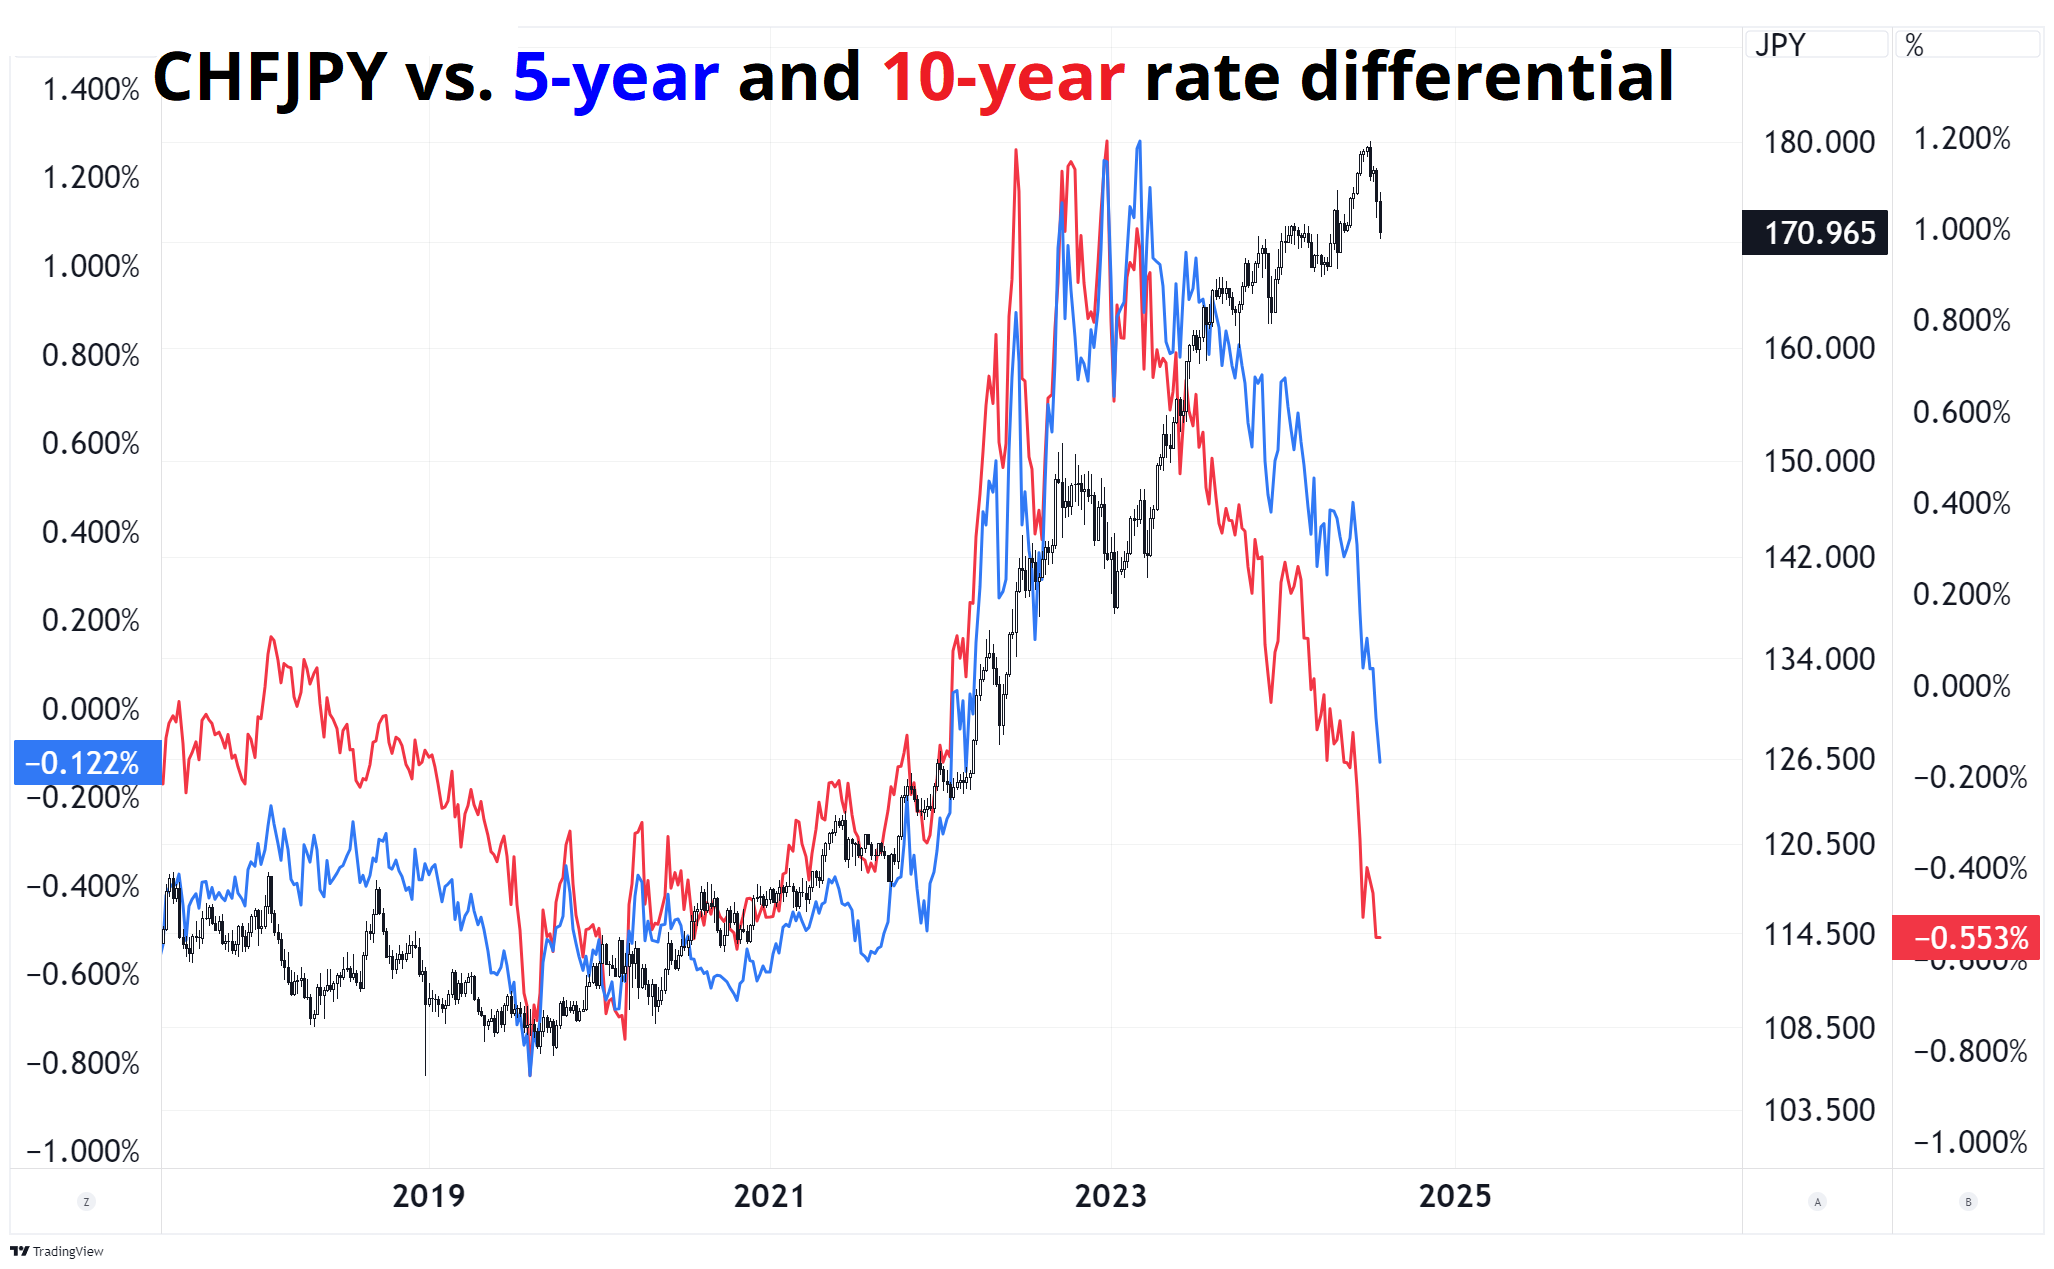
2-month downside also makes sense as we could get a very rapid move now that the momentum has turned. 2-month 165 or 162 digitals are juicy. You can also replicate the digital with put spreads.
Verdad has written another interesting piece. This time, they attempt to model similarities between regimes to identify which periods are most similar to today. If you’ve been trading for 20 years or more, you could do this in your head and probably come up with a similar answer… But still, it’s a cool framework!
Verdad: Analogous Market Moments
The gambling odds are around 57/40 in favor of Trump, still. I find that surprising given the polls are tightening and the Kamala vibes feel so radically different than the Biden vibes. US election opinion polling.
Have an enjoyable day.