
Gold as a release valve for US deficits and an update on the Magazine Cover Indicator

Canadian hero Gord Downie died on this day in 2017.
Yes, Nirvana opened for The Tragically Hip on July 7, 1989

Gold as a release valve for US deficits and an update on the Magazine Cover Indicator
Canadian hero Gord Downie died on this day in 2017.
Yes, Nirvana opened for The Tragically Hip on July 7, 1989
24OCT24 GBPJPY put
193.00 strike off 194.57 spot (cost 32.5bps)
Today’s am/FX is not about the ECB or the election. You have read enough about those lately, so I’m just going off in two random directions. I’ll keep it short. First, one of the great mysteries of the gold rally in recent years is how the yellow metal has decoupled from real interest rates. I have a theory!
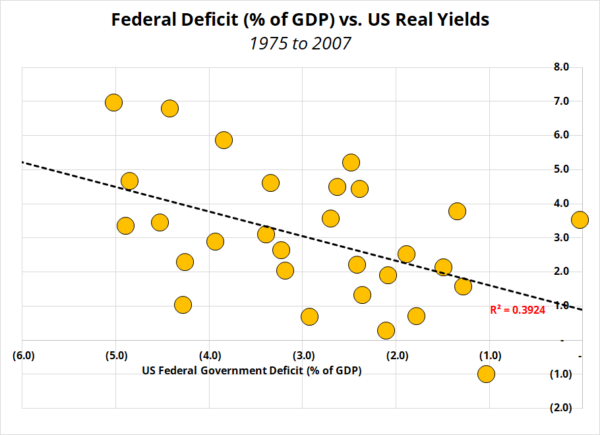
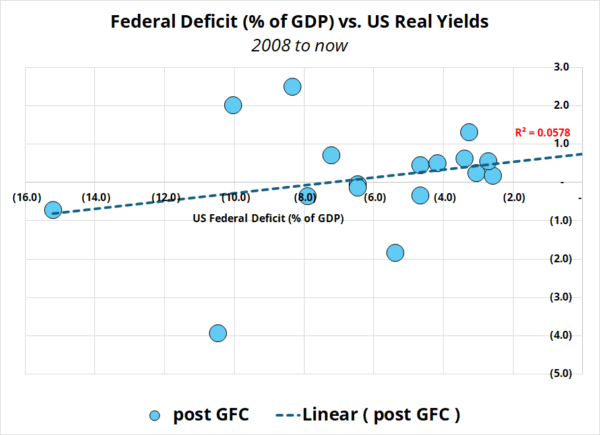
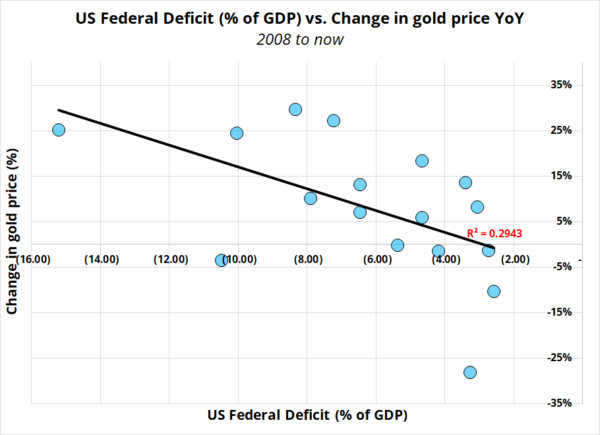
The theory is pretty simple, and I have some charts to back it up. Theory: Before QE and financial repression began in 2008, larger deficits led to higher real interest rates as the bond market extracted compensation for the higher risk premium implied by those larger deficits. Post-2008, government intervention in bond markets broke that relationship and drove gold, not yields, to become the new release valve.
While the government has not been buying securities of late (in fact, QT means the opposite), there is an implied put in the bond market as Janet Yellen showed us when the US 10-year yield hit 5%.
As such, the bond vigilantes are hampered by the visible fist of government as it remains cocked and ready to punch back if bond speculators don’t behave.
If you look at my first two charts, you will see how the relationship between deficits and US real yields made sense pre-GFC and now does not. Investors buying bonds at higher deficits are no longer compensated for the risk of doing so.
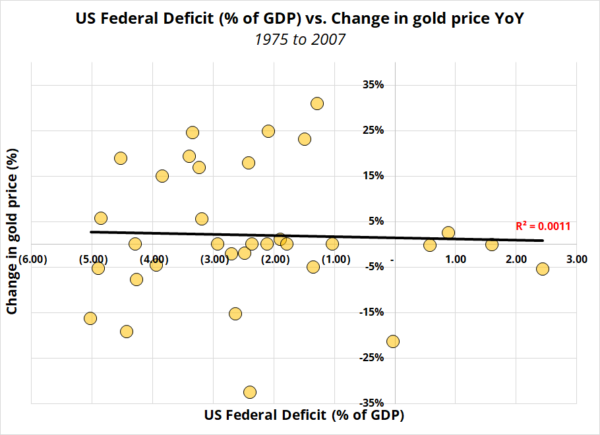
So there has to be a release valve. And as Luke Gromen and others have pointed out, that release valve appears to be gold. These charts are the same thing as above, but instead of showing deficits vs. real yields, I am showing deficits vs. the price of gold.
You can see that pre-GFC, there doesn’t look to be much of a relationship, while post-GFC, the trendline has snapped onto a relationship that looks similar in terms of slope and r-squared to the old relationship between real yields and gold. That is to say: Real yields used to be the release valve for larger deficits, now gold is the release valve. Neat.
The Economist has not been a great contrary indicator recently, despite consistently batting around 65% as a contrarian indicator on a 1-year time horizon both in sample and out of sample back to 1997. Their most recent cover is out. There it is.
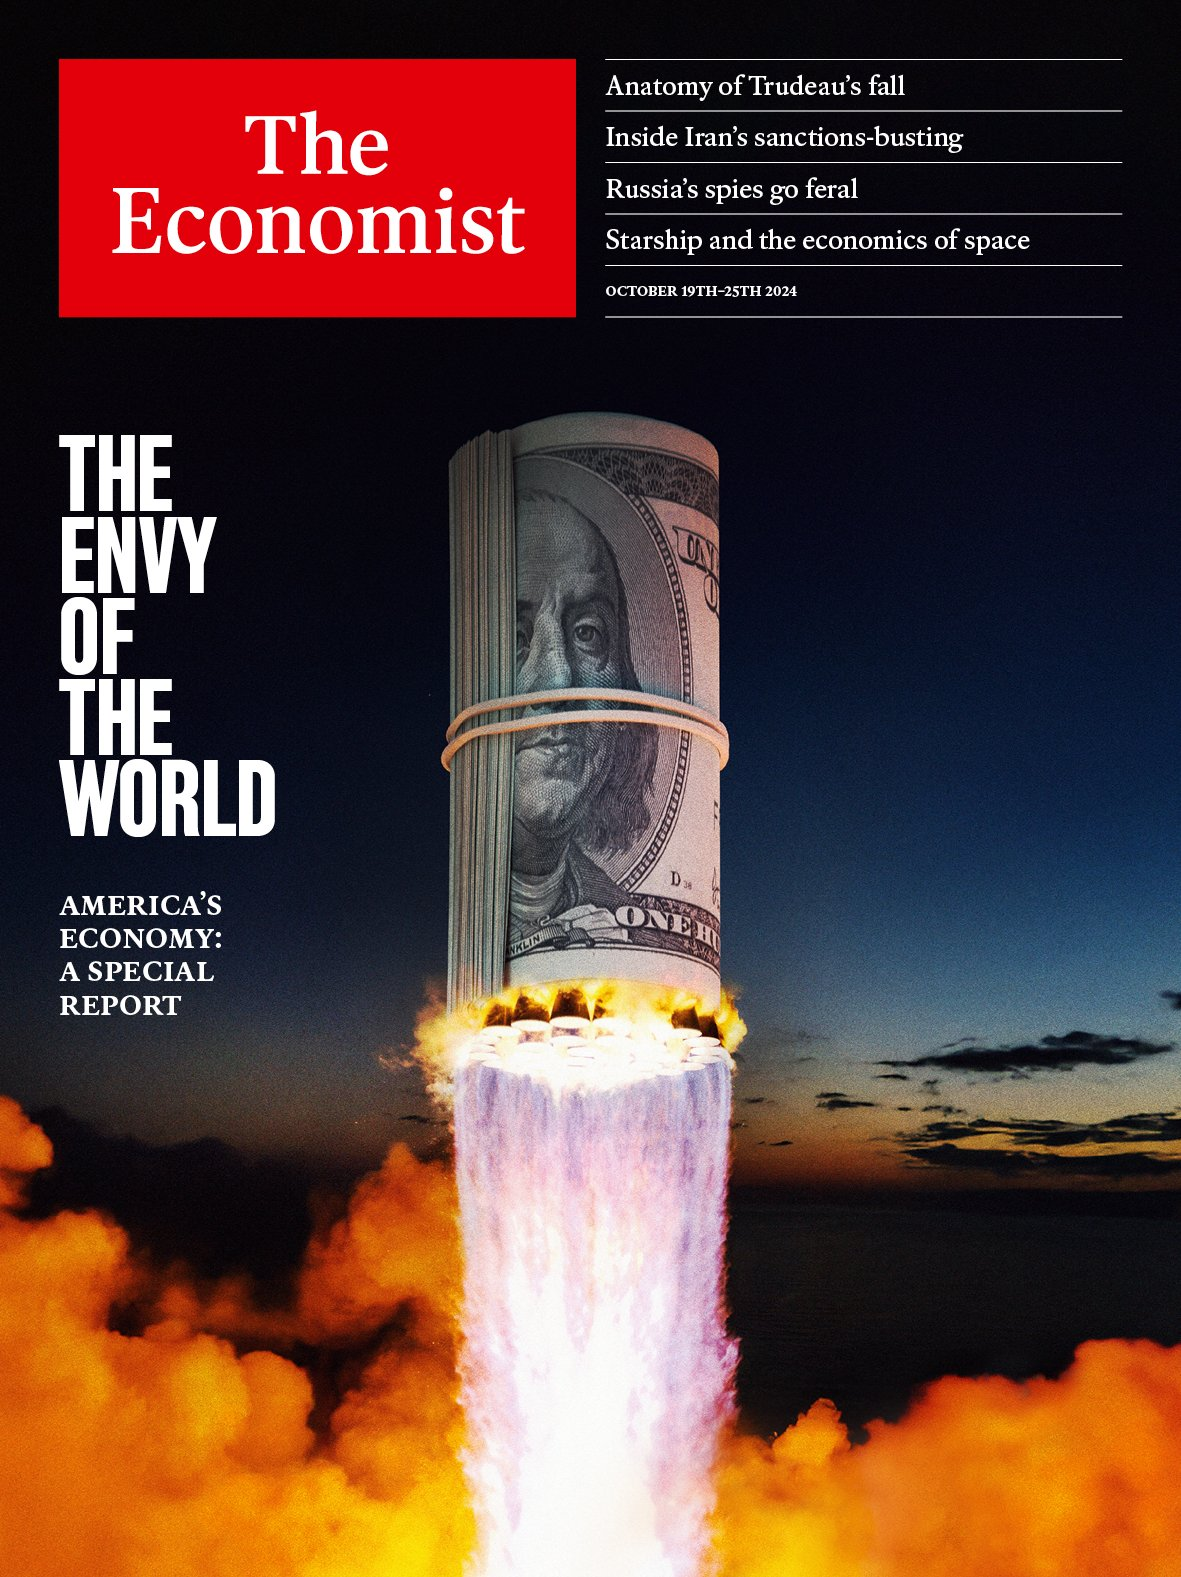
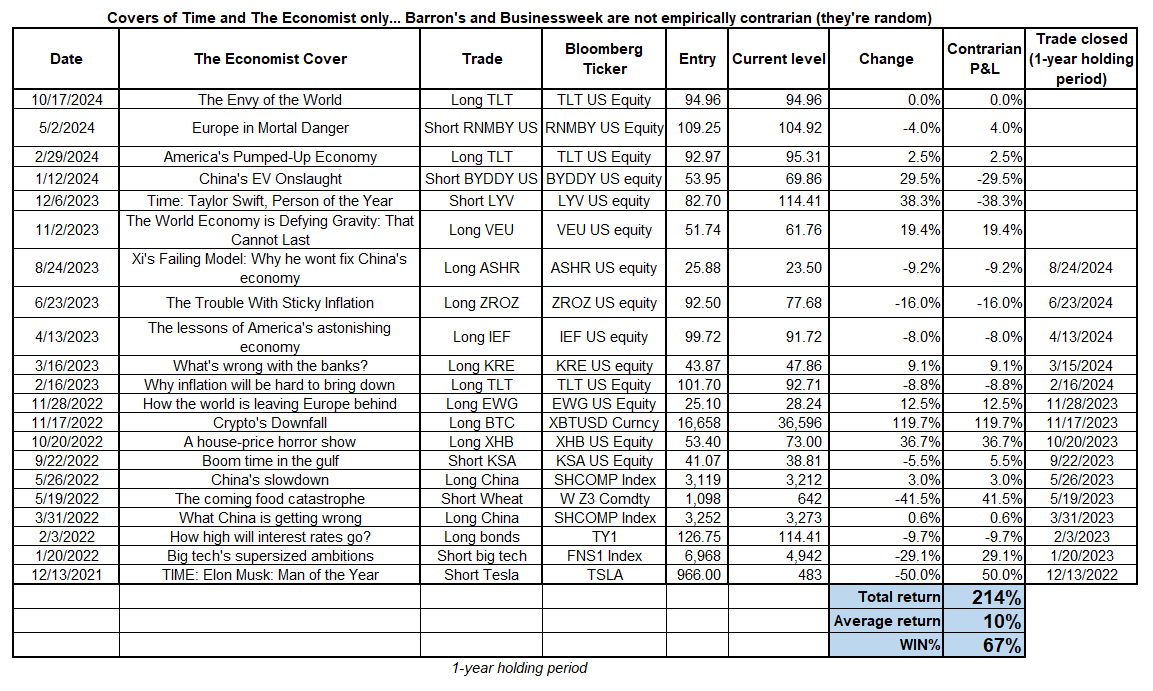
One could argue this is a bearish USD cover because the greenback is flying up like a SpaceX rocket, but I decided the story is about the US economy and the pure play to short the US economy is bonds, not the USD. As such, Magazine Cover Capital (the fictitious entity I created to track these trades in real time, starting in late 2021) is going long TLT.
The portfolio was already long some TLT on the back of a February Economist cover: “America’s Pumped-Up Economy” featuring a buff American Chad in a hideous white Speedo.
See below for all the trades, going right back to 2021 and please see here for a full explanation of why Economist covers are contrarian.
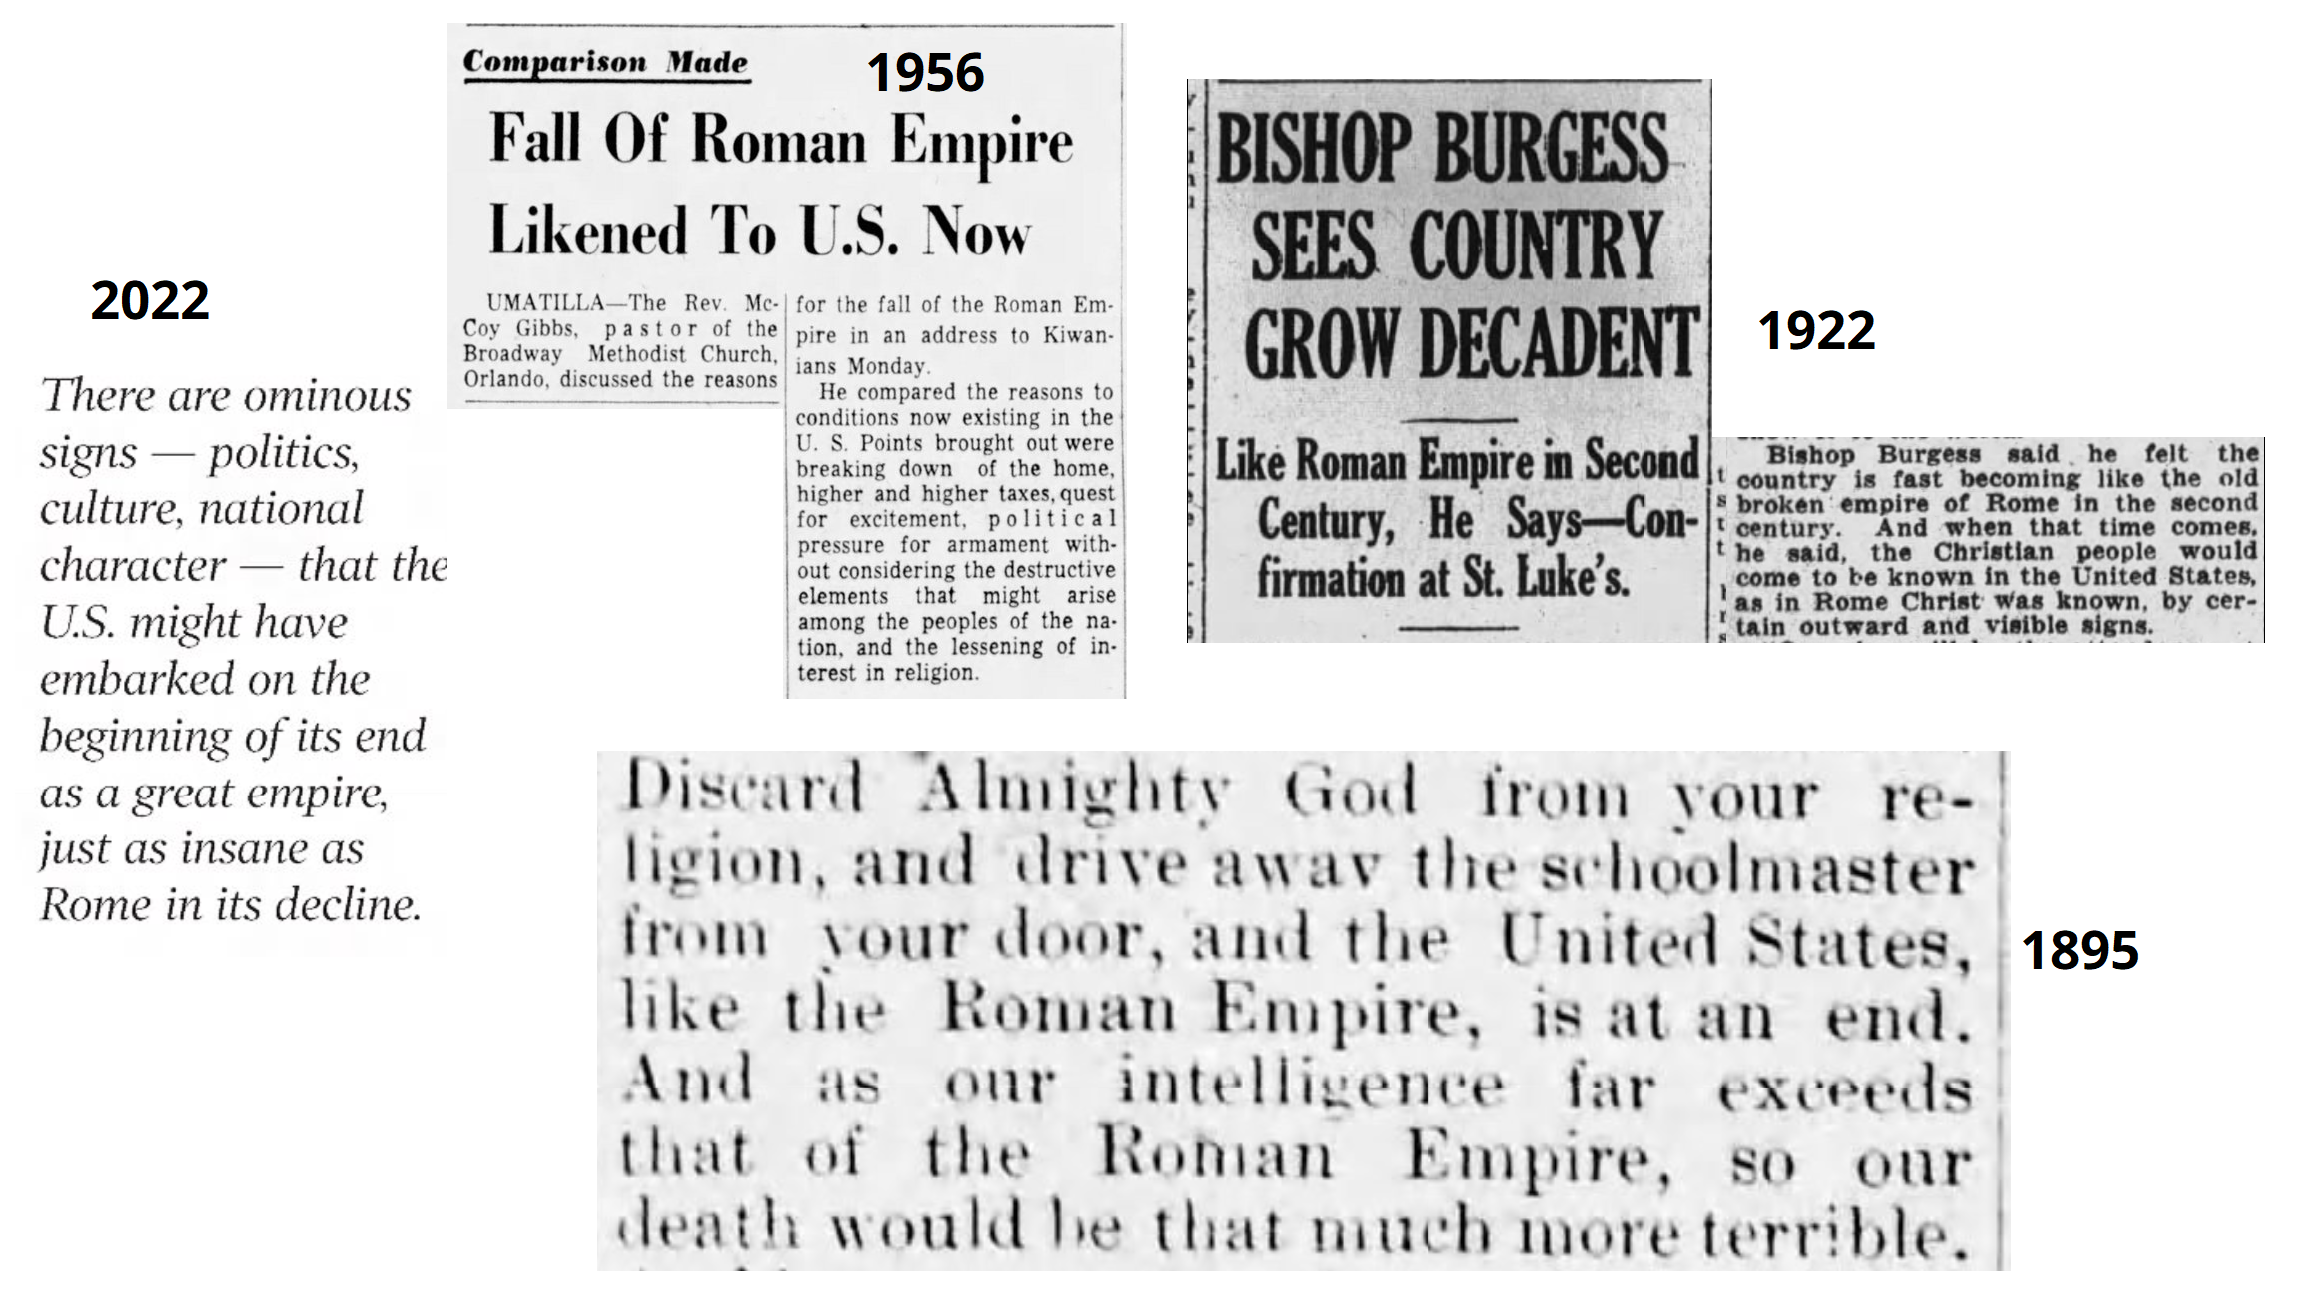
If my view that yields will top out around here as Trump momentum hits a peak and soggy commodity prices weigh on inflation expectations is correct, the US 10-year yield should not close above 4.15%. Currently 4.07%. It’s hard work being bearish America! This country keeps outpacing expectations, decade after decade and century after century.
Source: https://x.com/paulisci/status/1708970126358552693
“We live to survive our paradoxes.”
– Gord Downie, Springtime in Vienna.
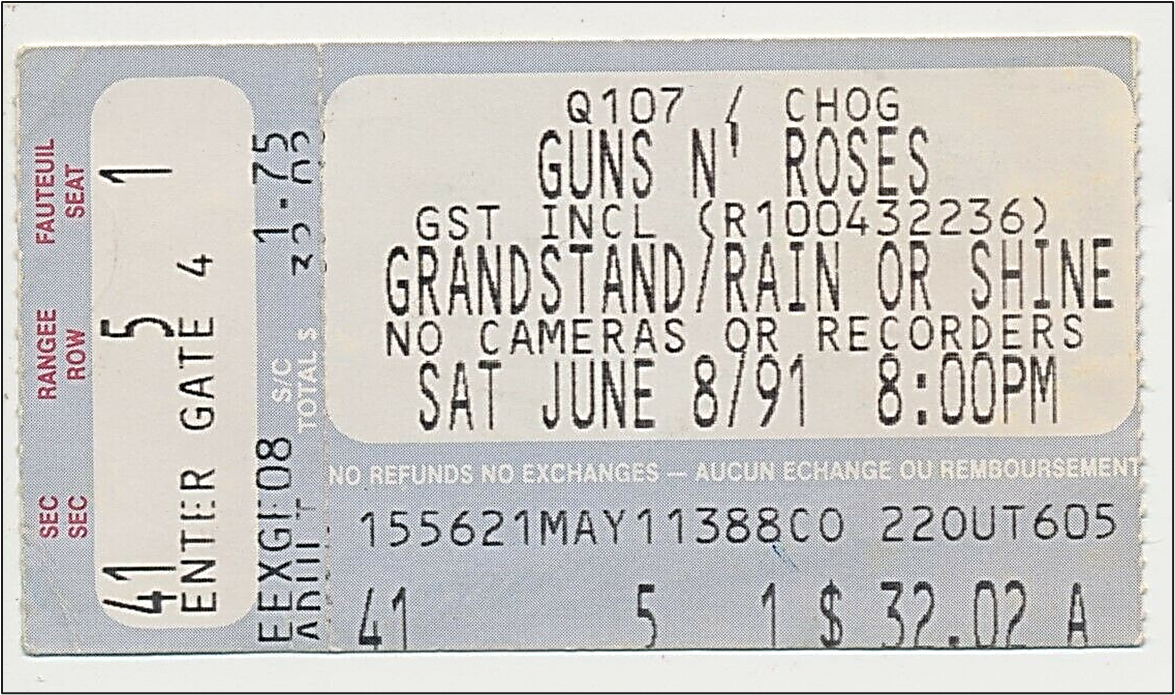

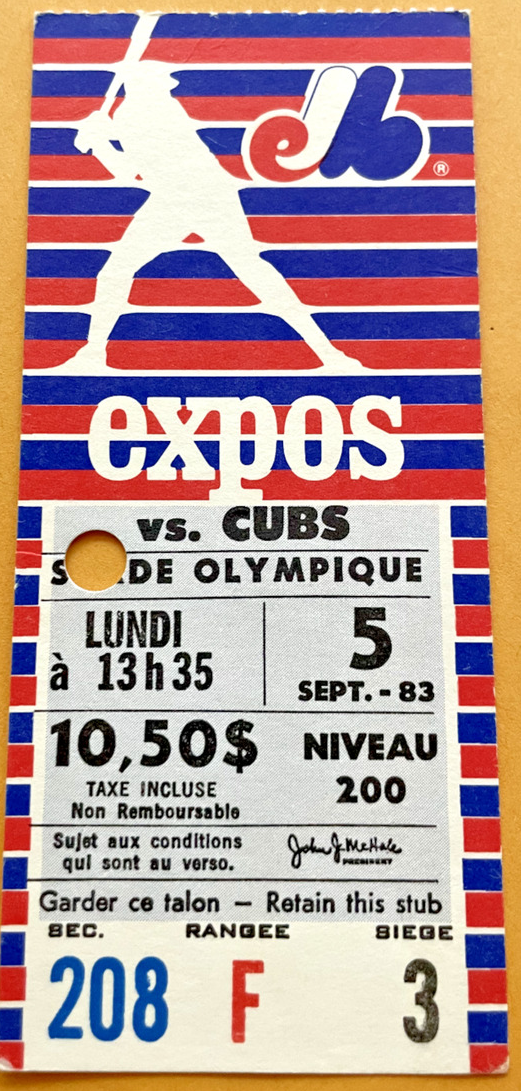
Those born too late will never know the joy of collecting ticket stubs from favorite sporting events and concerts.


This piece is mostly for people who are interested in backtesting

