Today I go through an exercise to flesh out how we get to six or more cuts in 2024.
There are many assumptions, but they are not especially heroic.

Today I go through an exercise to flesh out how we get to six or more cuts in 2024.
There are many assumptions, but they are not especially heroic.
05JAN USDJPY call 142.50
for ~30bps off 141.75 spot
Long EURCHF @ 0.9292
Stop loss 0.9224
Take profit 0.9424
January 3, 2024
My first table today is a quick exercise to see what conditions and assumptions could yield the six cuts priced by the market in 2024.
The top row is a set of assumptions for where you think the Fed wants real rates. The left-most column is a set of assumptions for year-end PCE. Red boxes show scenarios where market pricing is too conservative and the Fed cuts more than priced. Green is where the market is priced now, and white is where the market is too aggressive.
The Fed has a Core PCE estimate of 2.4% (latest SEP) and Fed Funds at 4.75% while it looks like the market is pricing a target real rate of 1.5% along with PCE in the 2.0%/2.2% plus an important probabilistic fudge factor for a shock that takes Fed Funds down more than 150bps.
Fed Funds at end of 2024, using different assumptions for PCE and short-term real rate target
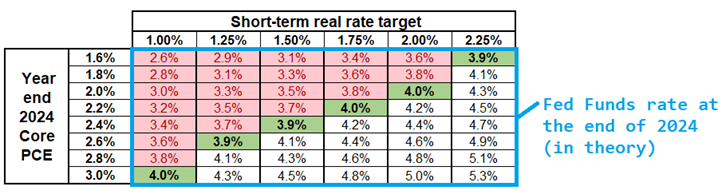
These are destinations, while the six-cut path faces many challenges because it requires a cut at 6 of 8 meetings in 2024, or bigger cuts at some point down the road. There are too many paths to show a full simulation, but if we stick to 25bp cuts, a linear decline in inflation towards 2% and a target real rate of 1.5% gets you six cuts exactly. So the pricing is not egregious, but many things need to click into place for this outcome to come true. Most obviously, inflation needs to continue its smooth descent.
It’s also worth noting that whatever the Fed’s happy place is on real rates, they are going to be more likely to cut with inflation annualizing below 2% than they would be if it’s ticking back up. That is, there is a nonlinear reaction function as the Fed starts to believe sub-2% inflation is in play.
The obvious question if we’re trying to find the landing strip on that table is: What sort of real rate would the Fed be happy with? While the long-run dots suggest r* (aka r-star) of 0.5% (2% PCE vs. long-run dot of 2.5%) Laubach-Williams have r-star around 1.1% or maybe 0.8% while some private firms have it as high as 2% and the Lubik-Matthes model has it at 2.17%. And the long-run dot has dropped from 4.25% in 2012 to 2.5% now and could rise or fall again in future. And the end of 2024 isn’t the long run, so you can’t exactly compare r* to this amorphous idea of a short-term real rate target. It’s complicated.
Remember too, that r-star is unobservable and procyclical and as Claudio Borio (head of the BIS Economics Department) put it:
r* is very imprecisely estimated and contains little information beyond that provided by other variables, such as potential output or the natural rate of unemployment. As a result, r* is not really needed when setting the policy stance ex ante, although it can play and does play a role when interpreting the stance ex post.
That is: r* is not real, but it’s fun to talk about.
Still, it’s a useful concept, even if we cannot measure it very well ex-ante. It’s safe to assume that the low end of estimates will be used in Fed policy because given a choice, the Fed always prefers to be too loose, not too tight, and mop things up later with emergency rate cuts. If you think they’re happy with real rates at 1%, the PCE assumptions to get to 6 cuts become considerably less heroic.
Using current PCE to calculate real rates (instead of market based future estimates) is not super rigorous, but it’s easy to understand and somewhat reasonable. Here is how that real rate has evolved over time:
Fed Funds minus PCE, 1975 to now
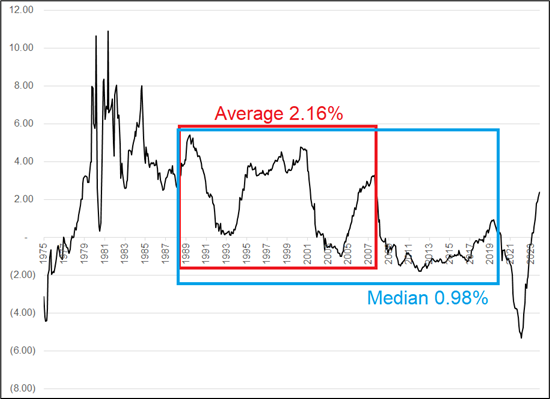
I calculated the average for the pre-GFC period but used the median for post-GFC because of the extreme impact negative numbers have on a mean. I don’t think anyone at the Fed supports a negative real rate as the base case going forward, though demographics and technology might have something to say about that in the future.
Conclusion: Fed pricing is not irrational, but it requires either a high probability of imminent recession in your EV grid, or some strong assumptions about how quickly the Fed wants to get real rates down in a world of stable and falling inflation. If there is a hard landing or if inflation stays sticky or reaccelerates, the pricing is off. Inflation data matters more than growth data unless growth completely craps out.
If you have a view of 2% core PCE and that the FED is targeting ~1.5% real rates, fed pricing looks right. I don’t; I think housing is coming back too fast and wages and employment are too strong and PCE will stick and then bounce. Related, this headline just dropped, which is exactly what I was saying yesterday.
*BARKIN: DROP IN LONG-TERM RATES MAY STIMULATE DEMAND FOR HOMES
My ISM vs. Korea Exports analysis yesterday had a flaw. Fortunately, the conclusion remains the same, but the flaw is significant enough that I should tell you about it. When you look at Korean exports, it’s good to take out semiconductors because those can distort the series and can be subject to variations that are not necessarily indicative of the health of the global economy.
When I searched for Korea Exports ex-semiconductors, I saw this:

And my brain said: “South Korea Exports minus Semiconductor YoY”. But it turns out that thing is a dash, not a minus sign. Using the correct data (taking the raw export data minus the raw semiconductor data and finding YoY change) you get a chart that looks similar to the one I sent yesterday, but less dramatic.
Korea exports (minus semis, 3m smoothing) vs. ISM Manufacturing, 2010 to now
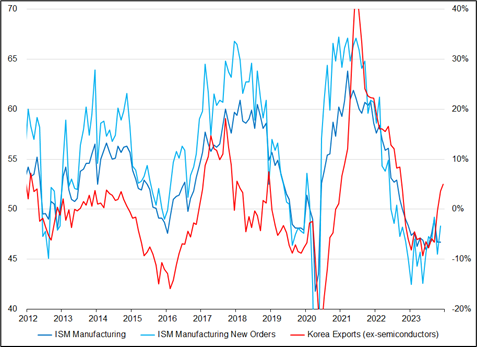
Apologies for the error. My bias is still that risks to ISM are to the topside, but the S&P Global PMI yesterday didn’t help my view. A more exciting possibility is some strong hawkish words in the FOMC Minutes.
Bitcoin is fun to watch.
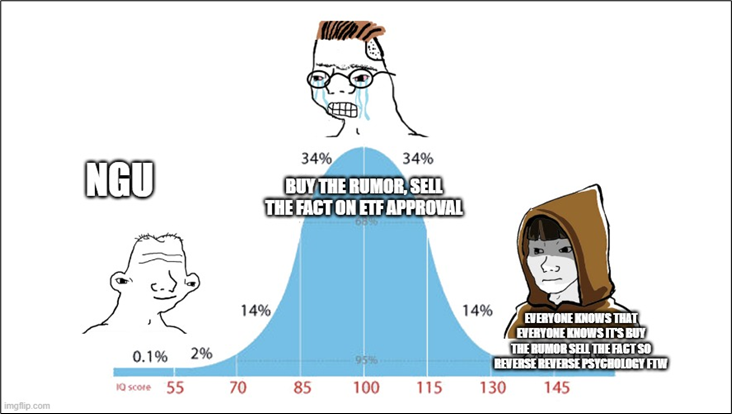
Normally the midwit meme clearly makes fun of either the midwits or both the intellectually disabled and the geniuses. I think this image at right captures the current BTC setup, but I truly don’t know who is right and who is wrong here. I find myself gyrating back and forth between the middle view and the right hand side view.
Hope you have a high-res day.
The Spectra FX Positioning and Momentum Report
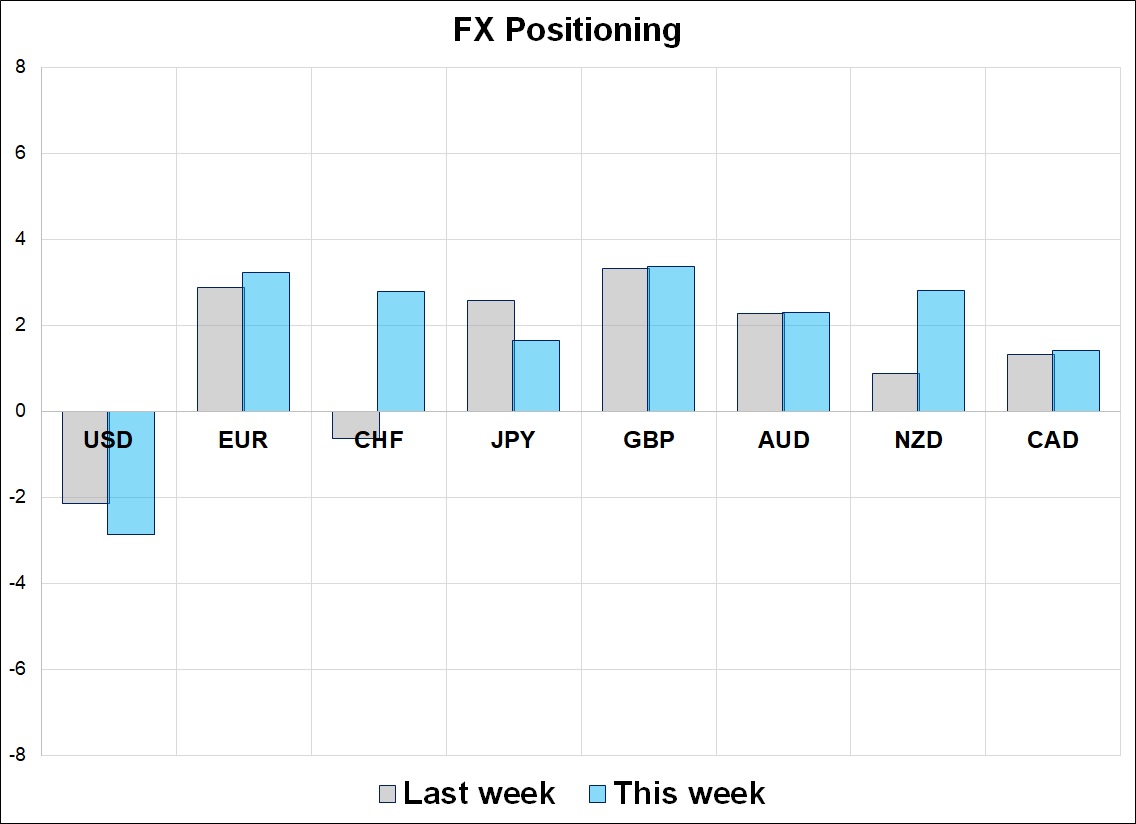
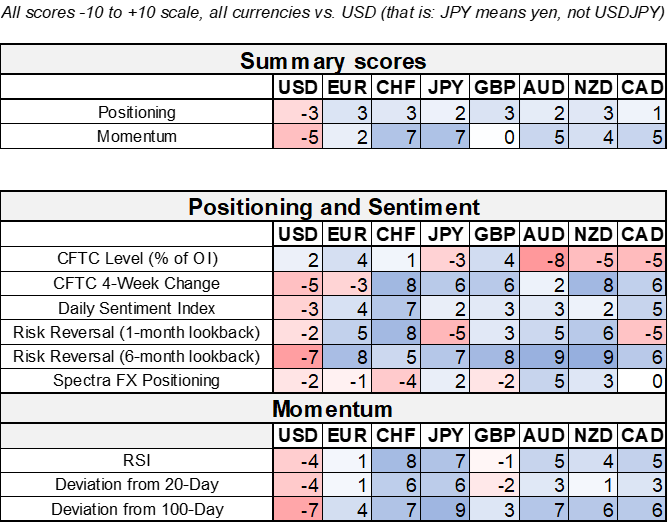
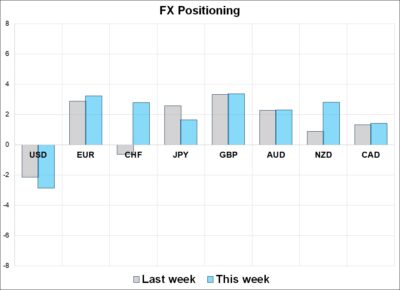
Hello and welcome to the first positioning report of 2024! These arbitrary calendar breaks are always good for reenergizing the spirit. The market is short dollars in a controlled way, so it’s an interesting setup with Fed pricing so extreme… But there is no aggressive contrarian signal because our netted metrics show +2 or +3 out of 10 short USD scores. This shows that there is room for the market to add to the prevailing view but also significant firepower for a reversal / big USD rally if the data does not ratify the six Fed cuts currently priced in.
Two Observations
1. If you scan the vertical column for CHF in the grid on the next page, you will see that the CFTC, DSI, and options markets are all still pointing to CHF longs, while the Spectra FX Positioning readout is short CHF. This relates in good part to the interest we have seen to buy EURCHF and EURCHF calls here at Spectra in contrast to blistering downward momentum in USDCHF. Options markets and CTA positioning are driven more by momentum, whereas the bearish CHF view in macro world comes from a combination of the year-end overshoot in CHF, the dovish SNB (they can now sell CHF again if they so choose), and the very low inflation readings in Switzerland. This is an interesting, not-often-seen dynamic. Most of the time, macro positioning follows price.
I looked back at the history of our data to find other times when this happened, but there were only three occasions and the forward results look completely random. All it tells you is that macro turns a bit faster than CTAs and options markets. Whether those markets follow the macro turn depends on subsequent price action. Trend followers wait longer than macro for price confirmation. We are nowhere near the 20-, 40-, or 60-day moving averages where CTAs will start to get exit signals in USDCHF.
USDCHF with the 20-, 40-, and 60-day moving averages
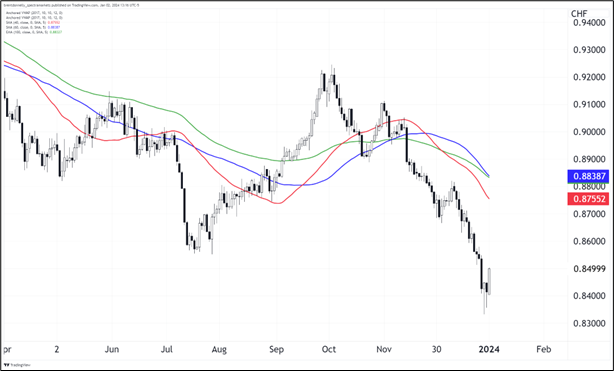
In EURCHF, these same lines all come in at 0.9520/50.
2. Bitcoin is one of the most interesting setups I have seen in ages as the market is resolutely committed to staying long into the ETF announcements even as everybody knows that everybody knows it’s going to be buy the rumor / sell the fact. The reverse reverse reverse psychology begins.
It’s a bit of a game of chicken at this point as the FOMO is always strong when trading Veblen goods because everyone also knows that everyone also knows that momentum is good predictor of future returns in BTC. I believe the risk in BTC remains to the downside over the next few weeks, but I’m surprised it has traded this well in the new year as I expected some tax-related selling on Day One and if there was any, it lasted about 6 hours before the big whoosh higher.
There is no call to action from positioning this week; it is all about the data and FOMC Minutes.
—
G10 FX Positioning and Momentum Scores
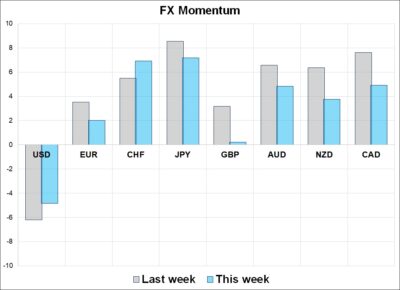
That’s this week’s report. Thank you for reading.


This piece is mostly for people who are interested in backtesting