UK inflation knocked over a bunch of overbought dominoes but doesn’t mean much for global macro.
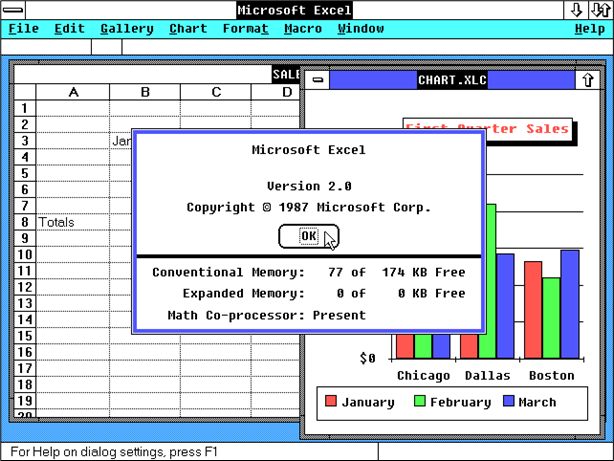
The original design of Microsoft
Excel is still recognizable in the
current version. Quite amazing
given Excel for Windows came
out ~36 years ago.

UK inflation knocked over a bunch of overbought dominoes but doesn’t mean much for global macro.
The original design of Microsoft
Excel is still recognizable in the
current version. Quite amazing
given Excel for Windows came
out ~36 years ago.
20JUN USDCHF
0.8850 digital put @ 20%
spot ref. 0.9275
21JUN USDJPY
123 digital put @ 20%
spot ref. 131.30
April 19, 2023
Quite an aggressive correction in a huge and random variety of assets overnight with KRW, HUF, NOK, ETH, oil, and gold all hammered. Hot UK inflation gets the blame as it led to a wicked domino effect as the market hit a pain point as yields rose. This five-minute chart shows the extreme domino effect as it ripped through all these somewhat unrelated assets. The red line dropping is the US 10-year bond falling right at 2 a.m. NY when the UK data came out. ETH cracked last at 4 a.m.
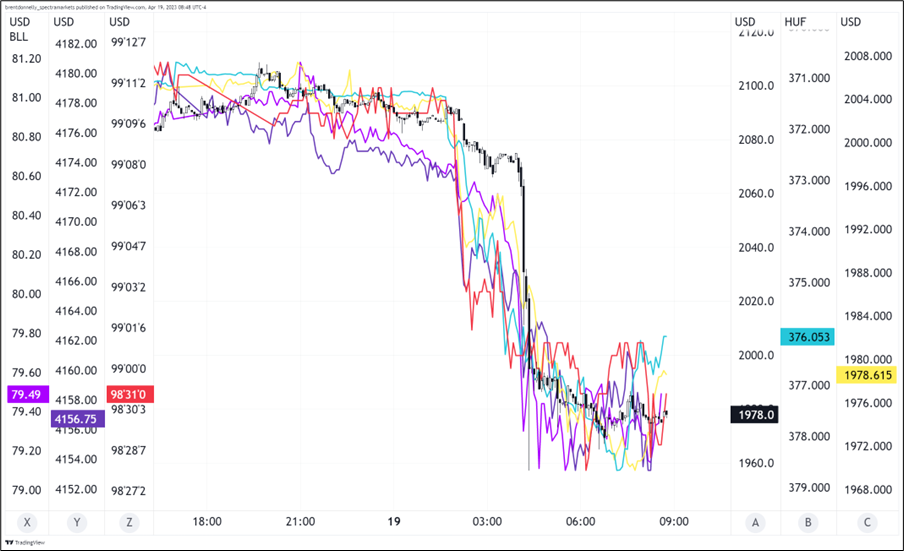
If we had breached some sort of epic level in US 10’s, I could see how this would make sense, but we are just right at the big resistance zone for US yields, not through it.
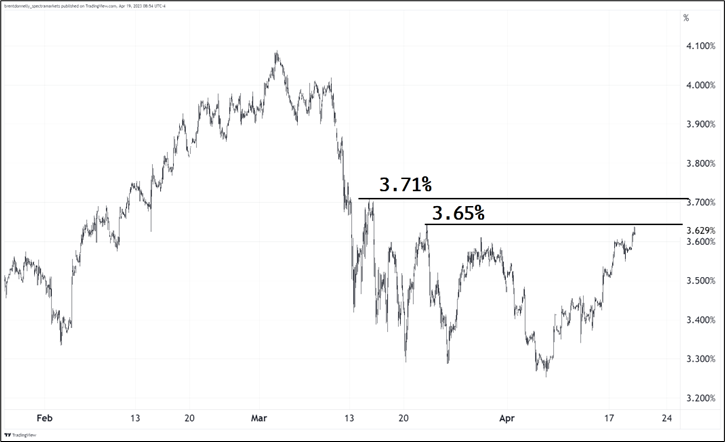
I am sitting here bearish USD and not enjoying these moves. If US 10-year yields trade at 3.75%, I’m going to capitulate on my view and give up. For now, this again feels like a big short-term wipeout that has little bearing on the bigger picture. Higher UK inflation was the proximate cause of the wipe out and it smoked overbought positioning in the perkiest liquidity sponges, but overall, I still don’t think the story has changed.
I find it particularly interesting how aggressively USDJPY has rejected the topside this morning as New York comes in selling USDJPY hard. Positioning there is completely cleaned up at this point, I think, as discussed in in today’s Positioning Report (see pages 4 and 5).
False break of 135.00
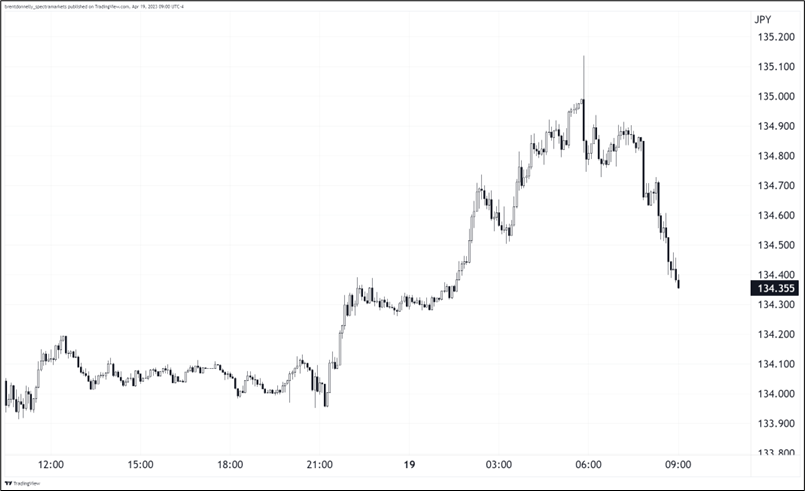
I acknowledge I am showing a lack of nimbleness here as I have been sticking with the USD bear view for weeks. Sometimes that is the right thing to do!
I plan to write about the debt limit next week, but today I give you this lovely chart from Matt Gittins (reproduced from this tweet). Tax receipts are tracking about the same as last year, which is a superficial disappointment if you see nominal GDP up >7% YoY. Then again, every investment account got destroyed in 2022 as risk parity and crypto collapsed, so it seems less obvious to me that tax receipts should be up this year. This article is a good explainer of why the debt limit date is moving to the left.
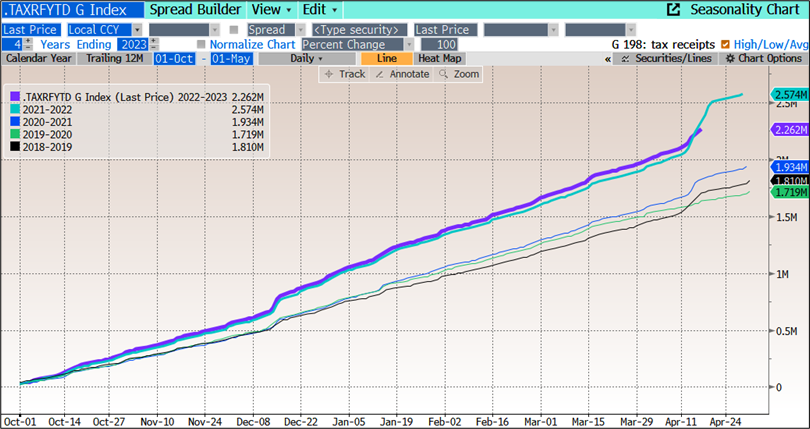
Key excerpt from that article:
On Tuesday, analysts at Goldman Sachs warned that the date could arrive sooner rather than later due to less robust revenues coming into the IRS. “While the data are still very preliminary, weak tax collections so far in April suggest an increased probability that the debt limit deadline will be reached in the first half of June,” Goldman’s Alec Phillips and Tim Krupa said in a research note.
The analysts said their base case is now focused on late July, “but this could easily change to a base case of early June if tax receipts continue to undershoot.” If the Treasury can make it past early June, then late July becomes the next potential date, since there is typically a burst of tax revenues in mid-June that should keep the Treasury flush for a few weeks.
The debt limit story is annoying because it’s 99% politics and theatre, but traders cannot completely ignore it because it can become a big scary monster every ten years or so as politicians deliberately push things to the brink. 2011 is the most salient example of that. As mentioned, I will do a full am/FX on the debt limit and its implications for the USD and risky assets early next week.
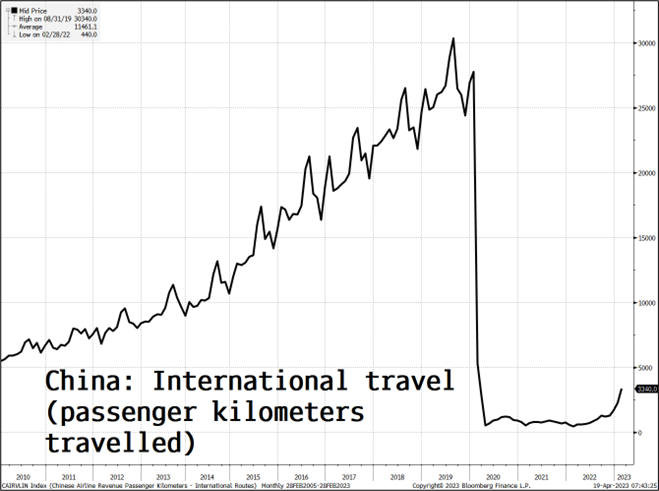
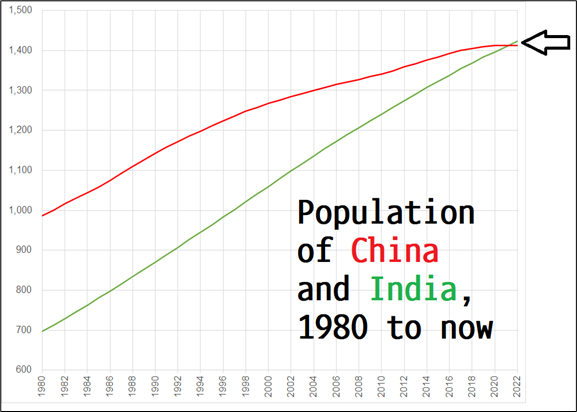
Two completely unrelated charts.
She knew Sam was trouble when he walked in.
Have an Excel-ent day.
Word.
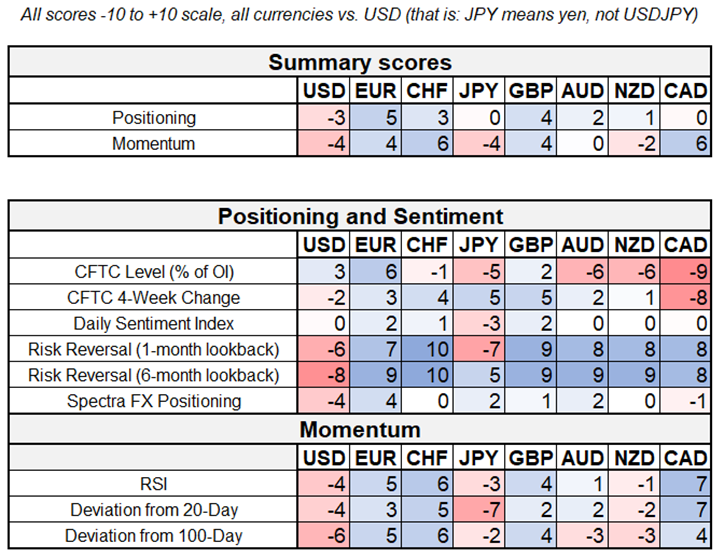
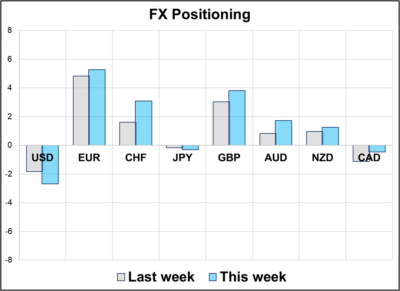
There was a 1.5% reversal off 1.1075 high water in EURUSD over the turn of the week, and positioning appears to have played some role in that. Then again, May Fed pricing, Waller, bank earnings, and Empire State all took a bite out of the short USD narrative in the last few trading days, so perhaps it’s more about fundamentals than positioning. China data remains strong, and the ECB is on track for more hikes. We remain in the middle of the dollar smile with USD shorts mostly focused on EUR. USDJPY looks to be cleaned out now, pretty much.
1. Those who went to the IMF meetings this past weekend all reported a similar vibe: “Everyone I talked to is bearish USD!” This is mildly concerning to me because I am also bearish USD. That said, the fundamental backdrop of slowing USA and OK rest of world (plus low / falling vol, solid commodity prices, and stable risky assets) makes me think you can still make money short dollars from here.
EURUSD remains the most crowded pair in G10 FX while positioning is now extremely light in USDJPY, USDCAD, NZDUSD and AUDUSD. There are some GBP longs now, and GBP calls are trading at their largest premium since Fall 2021.
2. The CFTC short position in stocks (see last week’s Spectra Positioning and Momentum Report for charts) is getting a gentle squeeze as the US economic news is not bad enough—or good enough—to justify lower equity prices. Much as there is a dollar smile, there is an equity frown right now that looks something like this:
True right now, but not always
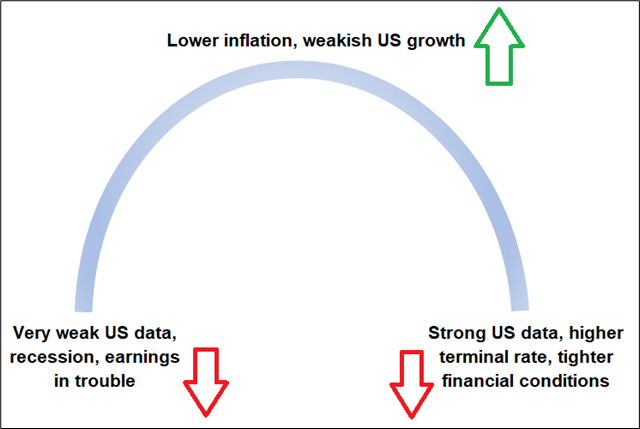
The reaction function of stocks does not always look like this because sometimes very bad can be good, too. But right now, I believe this frown accurately shows the stock market reaction function to US data.
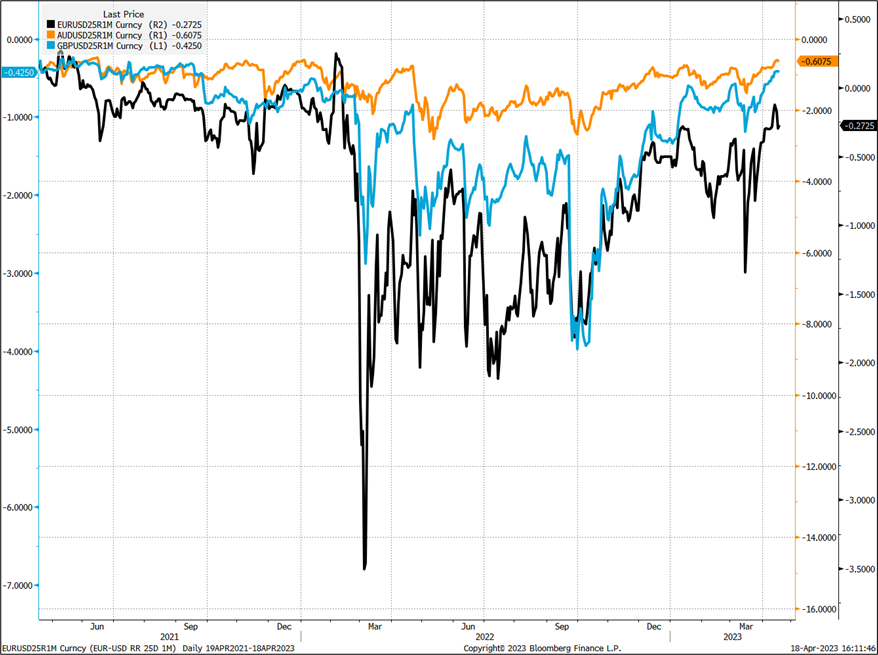
3. Risk reversals in G10 FX are back to levels from before the invasion of Ukraine. This is not necessarily a contra indicator, but it gives you a sense of supply and demand for FX options. People are no longer clamoring for USD calls like they were for most of 2022 and some parts of 2023 and there is no stress at all priced in G10 FX option markets.
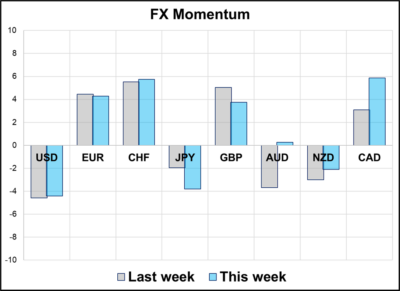
4. CAD stands out with CFTC max short and momentum turning somewhat positive (i.e., lower USDCAD). CHF and CAD have the best momentum scores this week and there is usually a point at which CTAs will reverse positions when momentum goes against them. USDCAD must be getting close to this point, though the CFTC can be stubborn for long periods, so this is no layup. The large short CAD and short SPX positions at the CFTC seem out of step with an increasingly benign global outlook.
Then again, if the benign outlook right now leads to more Fed hikes, there is perhaps a feedback loop effect where the better things are now, the worse they are later as the Fed will be destined to overtighten. Waller and others seem to have forgotten about long and variable lags and want to keep tightening until the real-time data cooperates. Tighter for longer eventually means more stuff will break.
That’s this week’s report. Thank you for reading.
It’s hard to appreciate how incredible Microsoft Excel is because we take its amazingness for granted after all these years.
Is Microsoft Excel the best software ever written?¹
Its influence on business and productivity over the last 36 years or so has been immeasurable.
—
¹ Excluding operating systems like UNIX and Java etc.


A sort of almost unbelievably large move in Brazil. Plus: Short CADJPY.

NZD has a bunch of bullish kickers: Election, seasonality, and inflation