Seasonality is real
Before we get started, The Spectra Markets 2027 Trader Handbook and Almanac is now available for purchase. This is the fifth year for the book, and I can confidently say that it’s the nicest-looking edition so far. You can buy it here for under $30. After a break-even 2025, the signals were back on fleek in 2026. Here is the raw performance of the signals (out of sample, of course, because we publish them months before the start of the year). If you vol-adjust the signals, you get similarly stellar results. Equities and crypto are the strongest asset class returns while FX is the worst, fwiw.
|
2023 |
2024 |
2025 |
2026 (as of 01SEP) |
| Total Trades |
136 |
176 |
181 |
121 |
| Wins |
86 |
96 |
88 |
67 |
| Losses |
50 |
80 |
93 |
54 |
| Win Rate |
63.2% |
54.5% |
48.6% |
55.4% |
| Average Win |
4.2% |
4.6% |
3.3% |
5.2% |
| Average Loss |
-3.4% |
-3.6% |
-3.1% |
-3.6% |
| Total Return |
190.3% |
153.6% |
0.0% |
156.9% |
| Average Holding Period (days) |
31 |
24 |
28 |
27 |
These results are raw returns without sizing for volatility and with no stop loss; they are to be taken in that context. We have tested with vol-adjusting and the results are not significantly different.
I use seasonality as just one input as I try to layer multiple small edges overtop of each other in an attempt to find a trade with a large edge. Some funds trade seasonality systematically, but I use it as one of many discretionary inputs.
Europe remains in the spotlight, though the pressure has come off France somewhat as there is the possibility that Friday’s wides of 160bps (France over Germany) prove to be a sentiment extreme. Below, the updated chart of OATs/Germany vs. EURCHF. You can see they are still moving tick-for-tick.
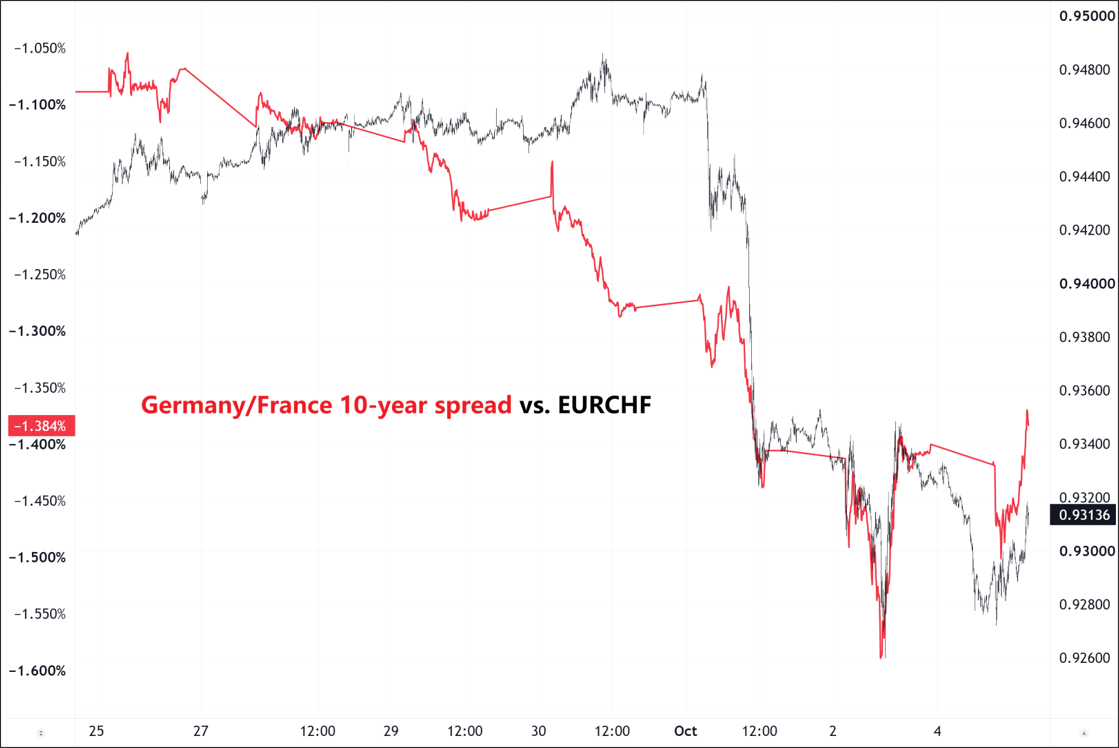
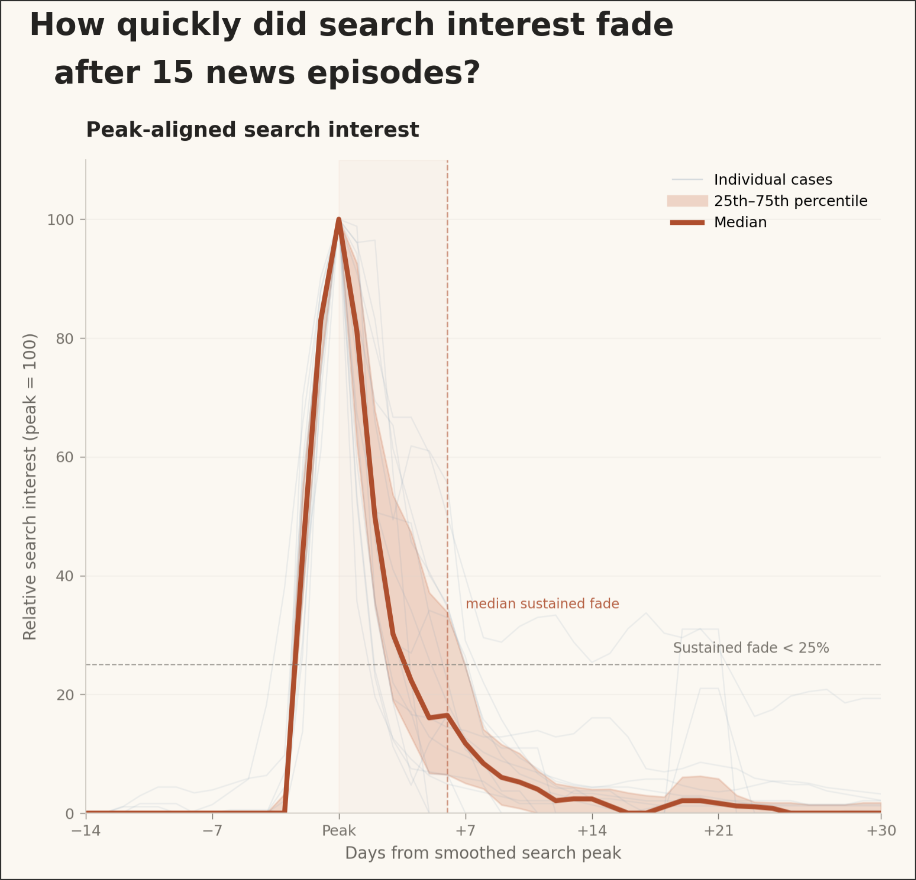
While these things usually have to get worse before they can get better, the narrative decays pretty fast and so it’s not unreasonable to stay open minded as we have seen this movie before: Twice with the UK, over and over with Japan, with the USA in April 2025, and so on. The fiscal sinners get punished for a while, then the market gets bored and moves on. France is likely to remain in focus, off and on, until the election next year, but the heat can’t stay at HIGH every single day.
Interesting
On the topic of seasonality, here is an interesting academic paper that came out last week.
Credit when it’s due: Corporate bond factors on a schedule
Abstract:
We document that the first five trading days of the month (24% of trading days) account for 73% of individual bonds’ credit returns, 51% of premia across 103 long-short bond factors, and 83% of the US corporate bond market credit premium. During these days, credit market beta explains 76% of the cross-sectional variation in average factor returns, compared with 6% using full-month returns. These findings suggest that apparently distinct premia in the corporate bond factor zoo partly reflect a common credit premium earned on the same days. An equally weighted portfolio of the factors has an annualized gross Sharpe ratio of 1.11 in this window, versus 0.52 on the remaining days. The share is nearly 80% for high-yield bonds, and credit default swap factors exhibit a similar pattern. Why compensation for credit risk follows this schedule remains an open puzzle despite extensive tests of economic mechanisms and measurement effects.
The key table.
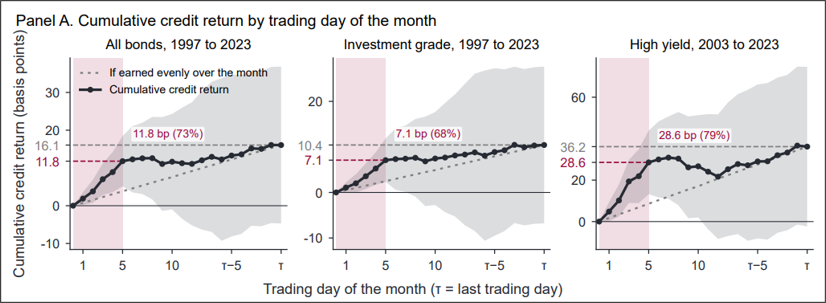
The authors find this result puzzling and struggle to explain it. It seems to me that this is a simple story where strength in equities at the start of the month due to passive inflows from 401k flows drive all risky assets higher. Credit should be no exception. The pattern there is quite similar to the intramonth equity pattern I describe in my 2023 piece: Seasonality is Real.
Here is an updated version of my chart from that piece, showing the average cumulative performance of the S&P 500 over the course of each month (data back to 2000).
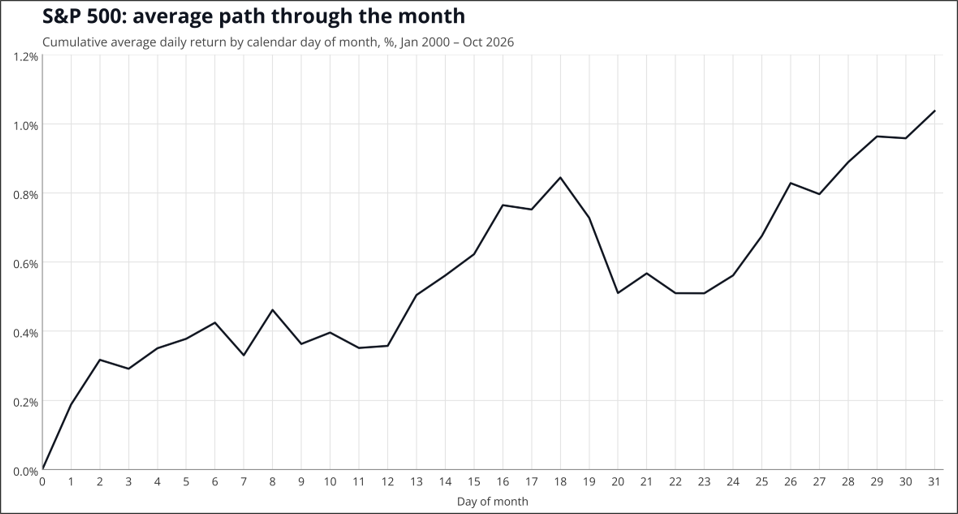
There are academic studies that agree with my chart. For example, these folks conclude the same thing and explain it quite well. Here’s their chart, which is arguably harder to understand, yet saying roughly the same thing. The paper is good—worth a read!
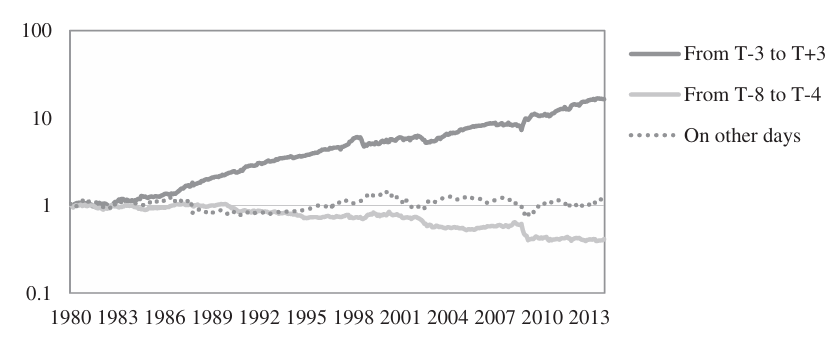
Dash for Cash: Monthly Market Impact of Institutional Liquidity Needs
We present broad-based evidence that the monthly payment cycle induces systematic patterns in liquid markets around the globe. First, we document temporary increases in the costs of debt and equity capital that coincide with key dates associated with month-end cash needs. Second, we present direct and indirect evidence on the role of institutions in the genesis of these patterns and derive estimates of the associated costs borne by market participants. Third, and finally, we investigate the limits to arbitrage that prevent markets from functioning efficiently. Our results indicate that many investors and their agents, including mutual funds, suffer from liquidity-related trading.
Reading academic papers can be boring but even short-term traders can find inspiration therein.
Calendar
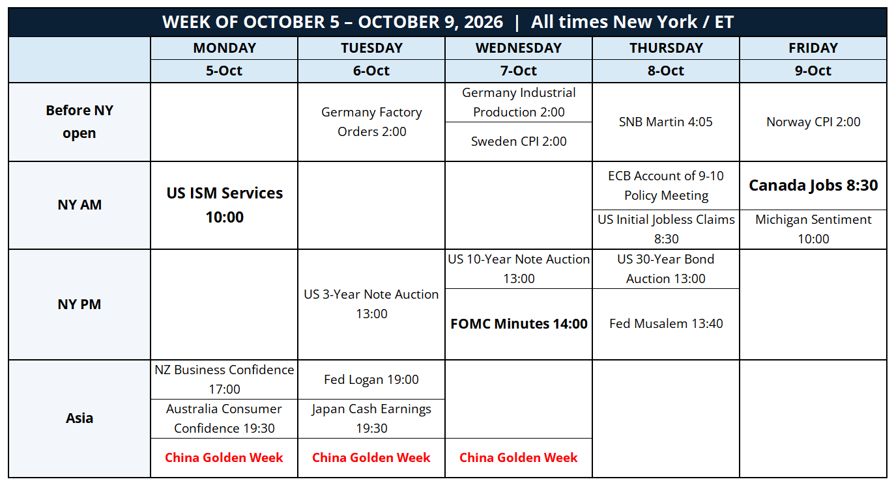
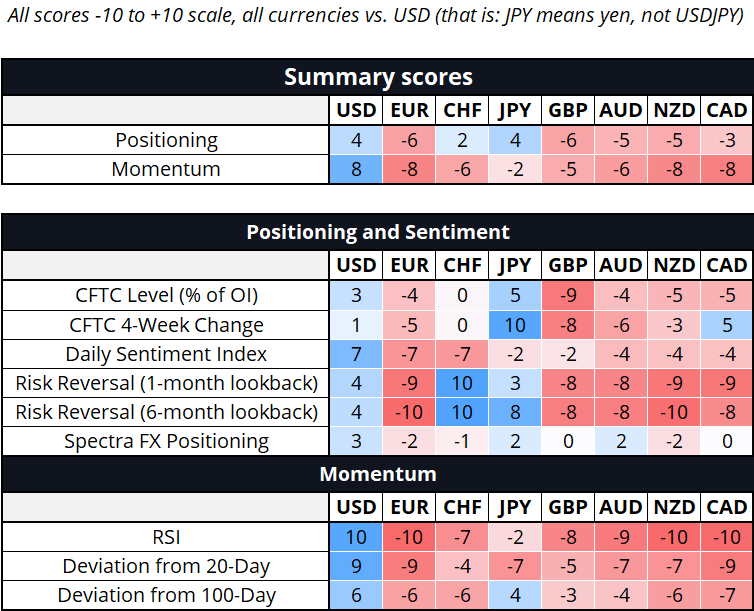
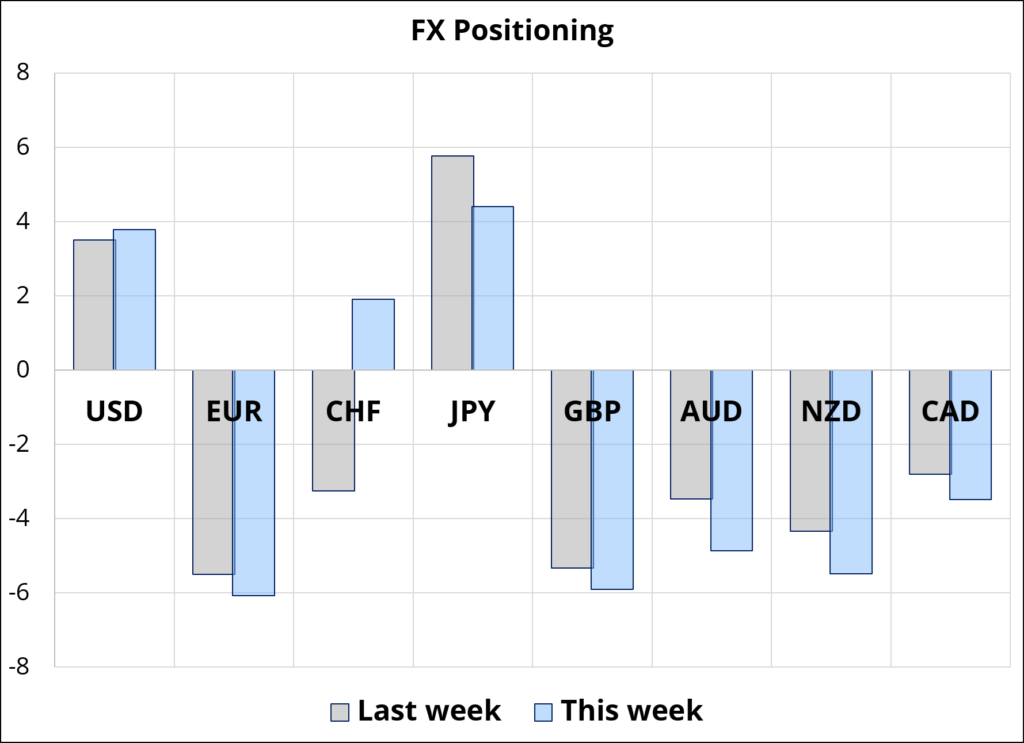
The calendar this week rates very low on the Scoville scale. There is barely anything of interest in there and so we will stare at French spreads and see what happens. Positioning report follows. Have a great week!