Today’s data doesn’t really change anything, I don’t think. If anything it’s mildly on the strong side.
And a big yummy altcoin visual.

Today’s data doesn’t really change anything, I don’t think. If anything it’s mildly on the strong side.
And a big yummy altcoin visual.
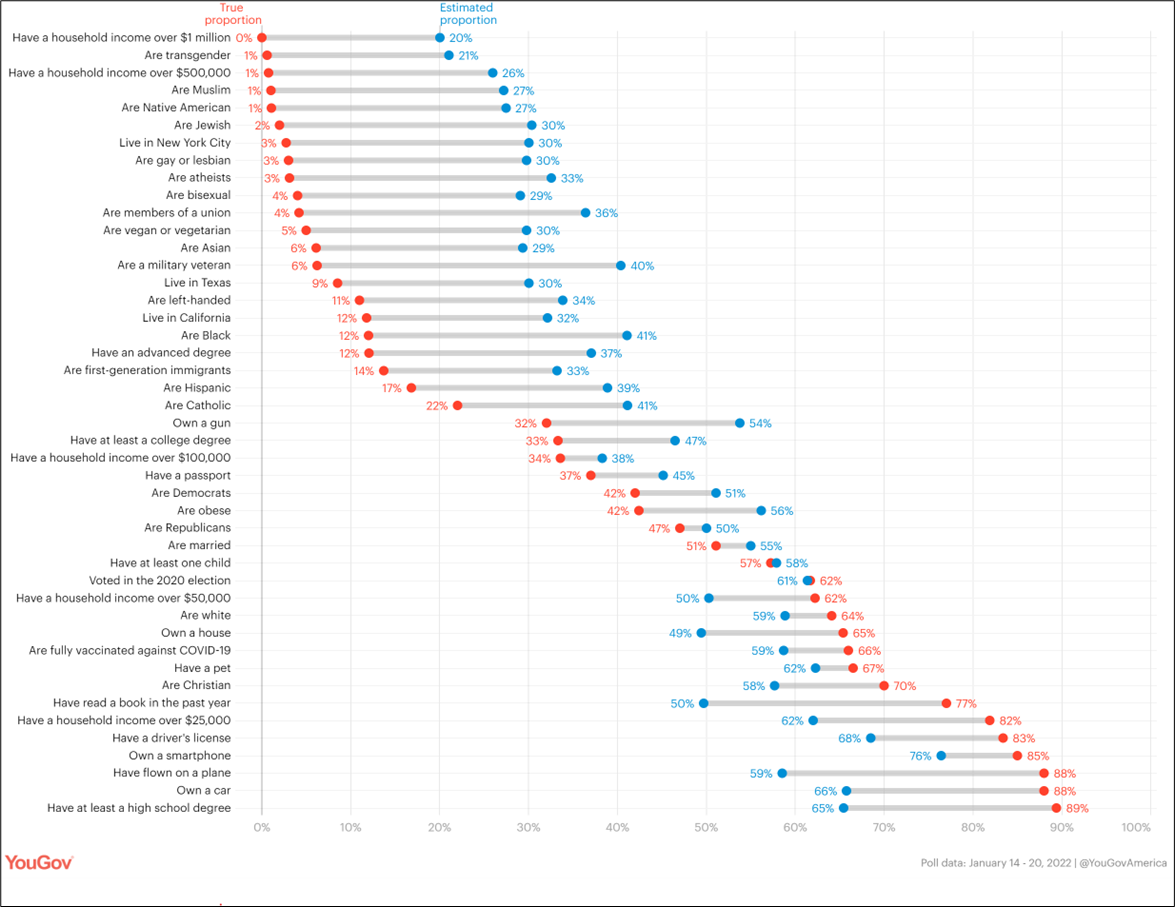
What percentage of Americans
has a household income
over $1,000,000?
What percentage of Americans
have at least a high school degree?
Answers on last page
Long USDCAD @ 1.3436
Stop loss 1.3244
Take profit 1.3644
June 13, 2023
Today’s core reading is 0.436%, which is on the high end of the 0.3%/0.4% forecast distribution. With almost all economists expecting either 0.3% or 0.4%, you could argue today’s reading is a smidge on the strong side. The market is keen to sell USD, but I don’t really think that is the play, especially with FOMC tomorrow and people’s desire to hold risk through that event likely to be low.
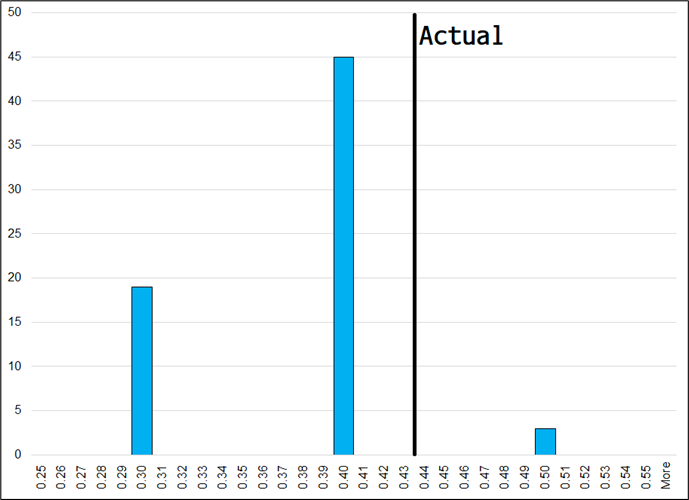
Speaking of FOMC: This graphic from BNP is pretty cool:
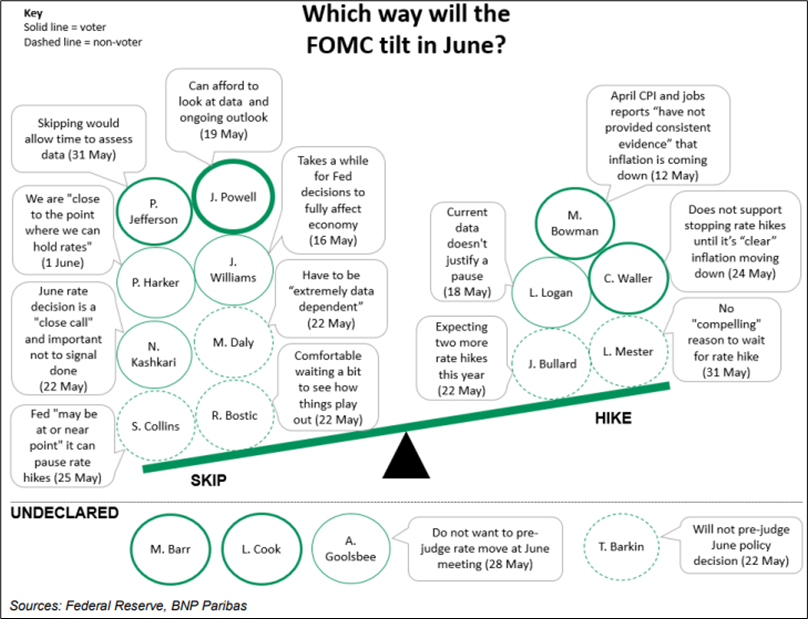
I think today’s data supports the hawkish skip and doesn’t change things much.
Yields dropped initially on the release, but I don’t think we get any follow through. We are in a weird situation here where the rate of change is good news (inflation is falling) but the level is not great (inflation is 5.2% vs. 2.0% target). It almost feels like we have gone to a vibe where the only thing that matters is direction. As long as inflation is slowing, everything is awesome. As we saw in Canada and Australia, if the second derivative stops moving, the central bank will get antsy pretty quick.
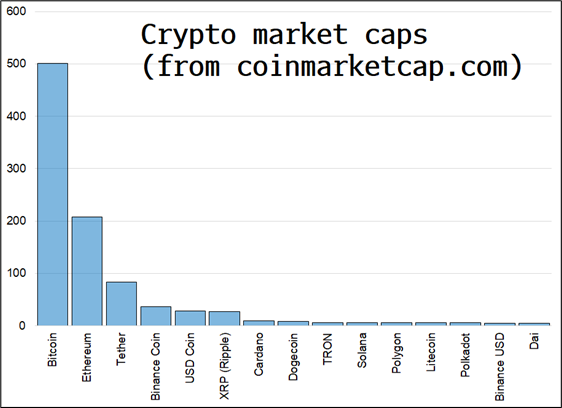
Every six months, I update my chart that shows the evolution of crypto market cap. Here is the update for June 2023.
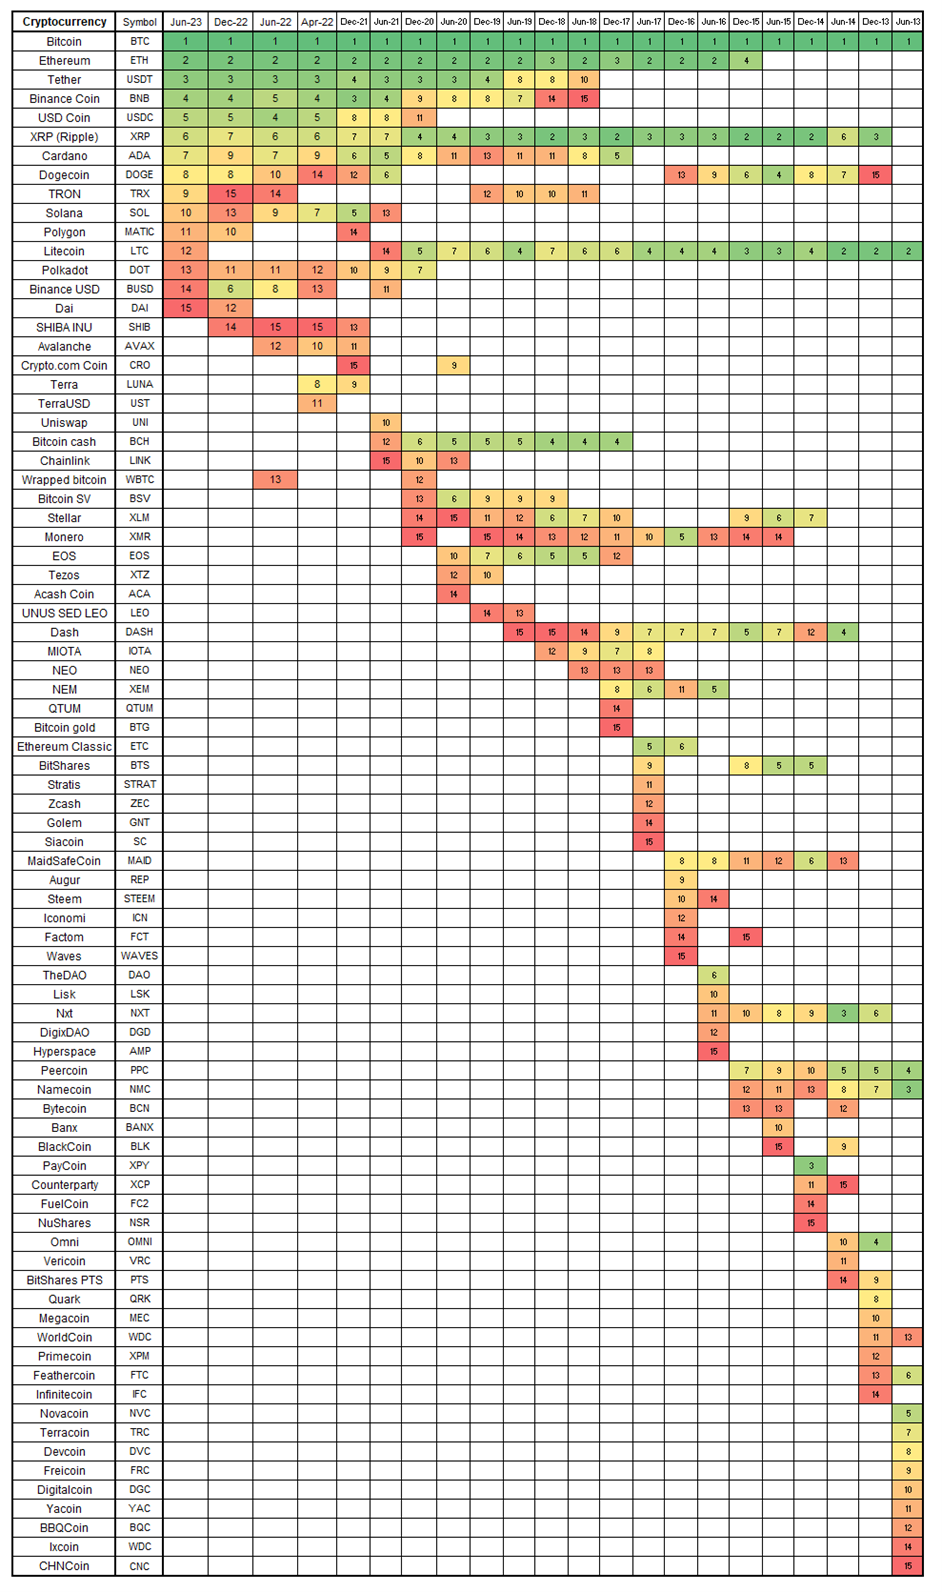
The big movers are Tron, which goes from 15 to 9 (despite Justin Sun charged by the SEC), while SHIB drops out and Binance USD loses out. BNB remains number four, despite the investigations there, and Solana has recovered some of its drop after the FTX bankruptcy.
It’s important to note that the Top 3 absolutely dwarf the remaining tokens.
Cool chart from John Authers today.
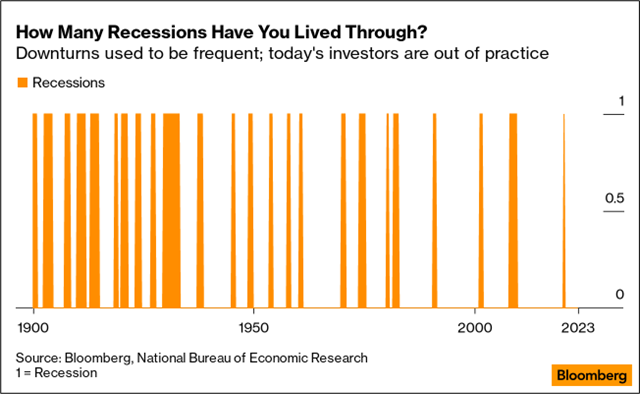
Either a) the economy is less fragile than it used to be or b) central planning is “succeeding” in stamping out recession and ending Schumpeter’s creative destruction. I’ll go with b).
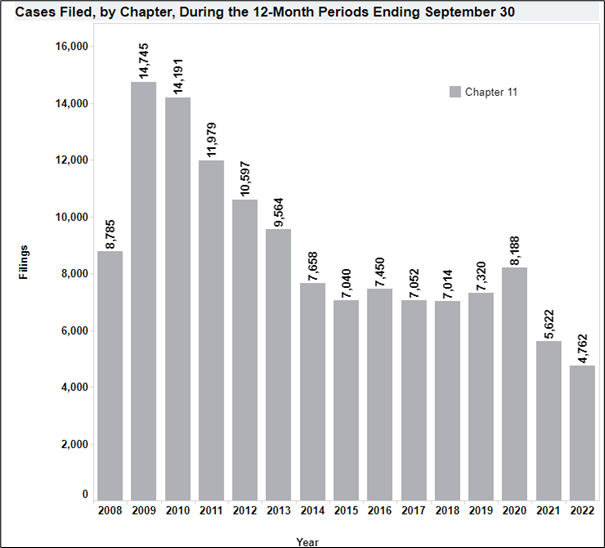
One of my favorite quotes of all time is:
“Capitalism without bankruptcy is like Christianity without hell.”
– Frank Borman, ex US astronaut and chairman of Eastern Airlines.
The Spectra Positioning Report is below. Have a well-calibrated day.
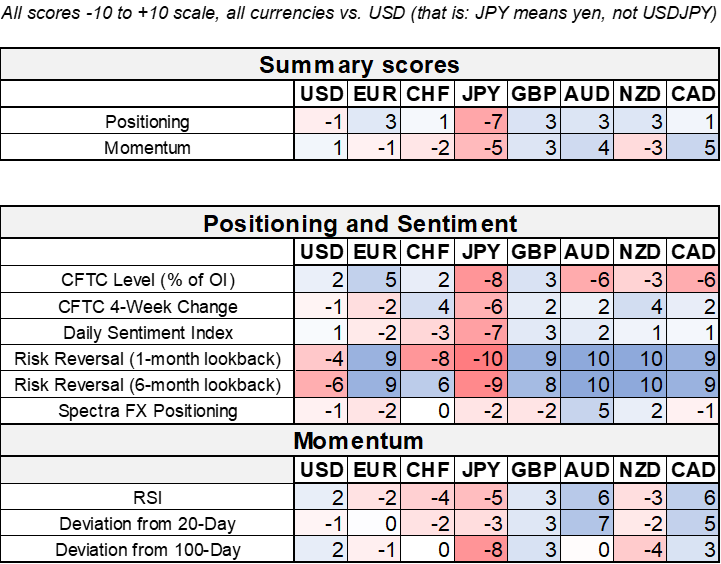
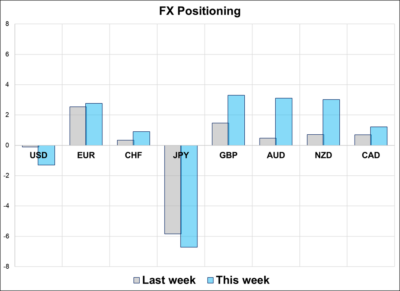
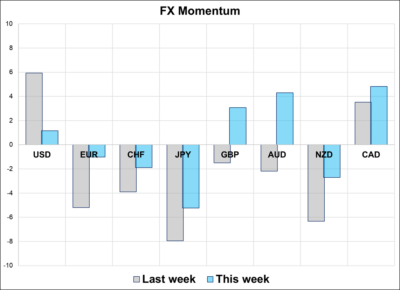
Hi. Welcome to this week’s report. FX traders are rather disengaged compared to usual after so many false starts and narrative flip flops so far in 2023. There have been some worthwhile tactical FX trades of late, but no meaningful macro FX trends other than USDCNH higher and the massive bull market in FX carry. Specs in G10 FX have been asleep and dreaming about the technicolor carry radiating from their huge EM longs. This week (CPI, FOMC, ECB, BOJ) should shake up some interest in the majors and perhaps reveal this summer’s USD direction vs. G10.
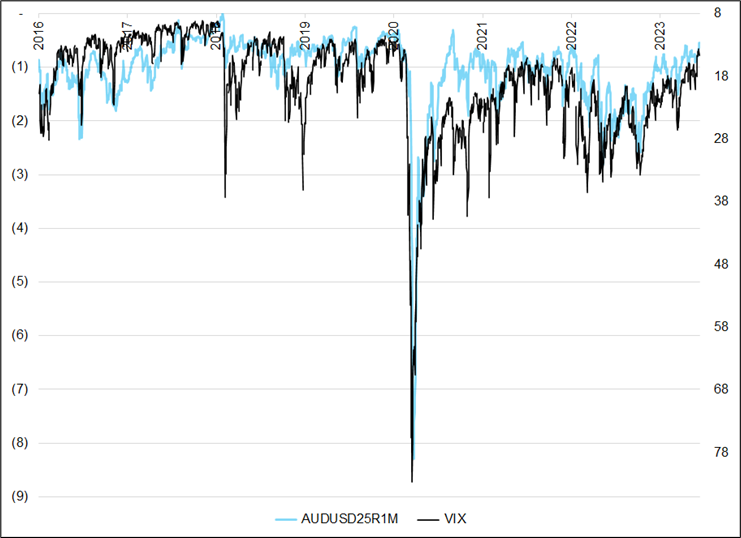
1. AUDUSD was the favorite way to play China reopening (long) and then China slowdown (short) but the story is back to positive AUD as the RBA finally plays catch up on rates. Recent hikes in Australia appear to have pushed the skew of 1-month options to its narrowest level since June 2021. This may have more to do with the low volatility regime in global capital markets than the efforts by the RBA to normalize, however. Generally, AUDUSD volatility and the AUDUSD risk reversal follow global capital market vol as you can see in this overlay.
2. The market’s general grumpiness and disdain for currency markets here likely indicate people are light on FX risk. Even long USDCNH, which is working, has seen more profit taking than risk-additive trades as it stalls in this 7.11/7.16 zone. Often, when something trends like USDCNH has, with a good Sharpe, you see people adding at the highs. That is not the case here.
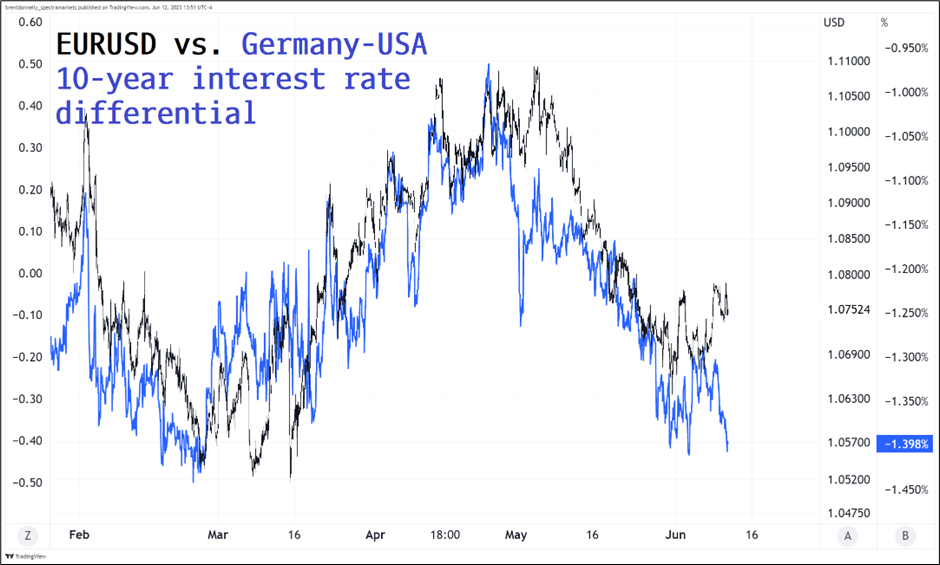
3. Overall USD momentum vs. G10 is mixed as USDJPY and USDCNH maintain decent upward thrust while AUDUSD and USDCAD (for example) offset that because they went down this week. Most traders still see 1.05/1.06 as a major buy zone in EURUSD and therefore it’s hard to get excited about short EURUSD here, even though interest rate differentials point lower (see chart below).
—
That’s this week’s report. Thank you for reading.
From 2022. Estimated proportions are calculated by averaging weighted responses (ranging from 0% to 100%, rounded to the nearest whole percentage) to the question “If you had to guess, what percentage of American adults…” True proportions were drawn from a variety of sources, including the U.S. Census Bureau, the Bureau of Labor Statistics, and polls by YouGov and other polling firms.
Fascinating.