January 5, 2024
PDF version
Payrolls
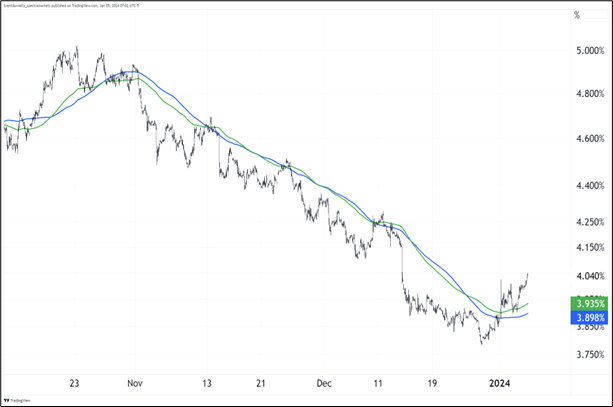
2024 looks a bit like 2023 so far. Yields up, USDJPY up, etc. The overshoot at year end is gaining a bit of momentum as equities buckle under the weight of 99th percentile positioning in megatech and 10-year yields are now above the 200-hour moving averages and have retested them and held.
US 10-year yield (hourly): Trend turn after 60 days of trending lower?
Green is 200-hour EMA and Blue is 200-hour simple MA
And the two most popular currencies coming into 2024 (JPY and AUD) are two of the three worst performers so far. In G10 FX, AUD is 8th SEK is 9th and JPY is 10th place YTD. FX is hard.
On payrolls today: My instinct was that if Initial Claims are bobbing along the bottom of the chart, economists would be braced for strong payrolls numbers and their models would factor in the low claims figure and maybe even overweight it. In other words, knowing that nonfarm payrolls averaged a miss of 14k from the year 2000 to 2019, my theory was that it would miss by more than that during periods of low Initial Claims. This is wrong.
In fact, here are some stats (I excluded 2020 because it blows up the data):
- All NFP releases with Initial Claims below 225k beat 19 and missed 12 times (61% of releases stronger than expected).
- All NFP releases with Initial Claims below 225k, average beat +10k (vs. average miss of 14k for all the data).
- 68% of all NFPs with Claims below 225k were above 172k (today’s forecast).
Here is a histogram of all the NFP headline releases (actual, not revised) when Initial Claims were below 225,000.
Histogram of NFPs when Initial Claims <225k
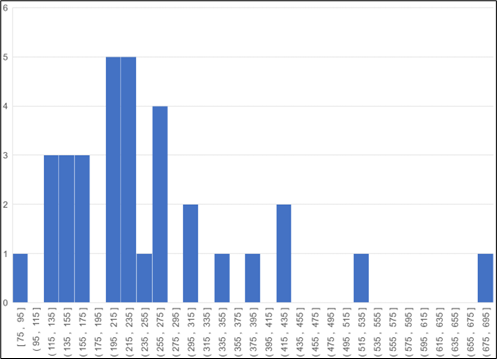
So, I went from thinking maybe weak to maybe strong. Then I realized the effect you see is entirely from the post-pandemic period where the economists just had no idea that the jobs market would be so strong. If we look at pre-COVID only (a regime I would argue is much closer to the current regime now that the 2020-2023 fiscal hypercycle is over), the data looks random.
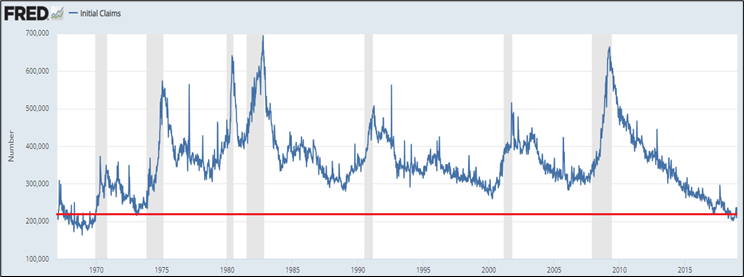
From 2000 to 2019 (i.e., pre-COVID), there were 17 months where Initial Claims were below 225k going into payrolls (they were all in 2017, 2018 or 2019). In those months, NFP was below 172k 53% of the time and missed economist estimates 47% of the time. A coin flip. In case you are surprised, as I was, to hear that Initial Claims were never below 225k in the entire 2000 to 2017 period, here’s the chart:
US Initial Claims, 1967 to 2019 (red line is 225k)
So, my study comes to no conclusion. The null hypothesis prevails as the only thing we have learned is that Claims were low after COVID, and economists badly underestimated the strength of the US jobs market. We already knew that. I sometimes like to publish my studies, even when they come up empty, because:
- The null hypothesis can still be useful, and it can tell you what not to focus on. If you thought something was true, at least it tells you that it’s not.
- It shows I’m not p-hacking my way through the parameters to get sexy results every time. I start with a hypothesis grounded in some sort of logic. I test it. And I get out. I hope as a reader you view these null hypothesis reports as kind of boring but also useful information. And I hope they raise your confidence that when I do publish a study with interesting results, it is the outcome of a single positive test of a logical hypothesis, not a parameter-o-rama ‘til I find something cool.
What to do?
I’m still of the view that the market is pricing in too many cuts and yields should go higher, but the data is more important than anything else and CPI next week matters more than NFP. The whole Fed targeting real rates narrative that we are in right now means that Fed pricing is about the pace of disinflation and it’s not about growth. Obviously at the extreme, jobs and growth matter, but if they are within the standard cone of uncertainty, they will be trumped by news and data on inflation.
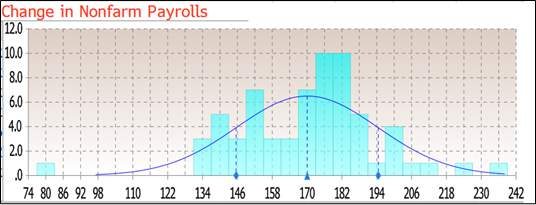
Here is the distribution of forecasts from Bloomberg. The top 5 forecasters (as ranked by Bloomberg) all have 175k or higher. The UR surveys are almost all at 3.8% with a bunch of 3.7%s and just three of 63 at 3.9%. AHE is pretty much everyone at 0.3% MoM with six at 0.4% and nine at 0.2%.
I am not even certain that a medium-strong or medium-weak number will yield an orthodox reaction in rates or FX. I could see 244k NFP, 3.7% UR, and 0.4% AHE and USDJPY goes 146 paid 144 given. For example.
Here are the parameters for an undeniably strong or weak number that should lead to an orthodox and actionable reaction in bonds and FX. The parameters are wide because NFP importance is currently high second-tier, not first-tier.
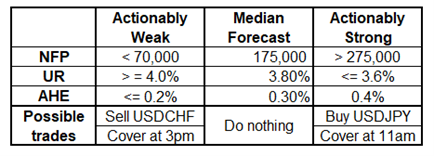
If either side of the table hits or nearly hits the trifecta, I put some quick trades that would make sense. USDJPY has come a long way, but I could see more pain at least until 11 a.m. on the super strong scenario. USDCHF could continue longer, that’s why I put “Cover at 3 p.m.” for that one and cover at 11 for USDJPY. I acknowledge that I placed my parameters so wide that the probability of either side hitting is low.
Calendar
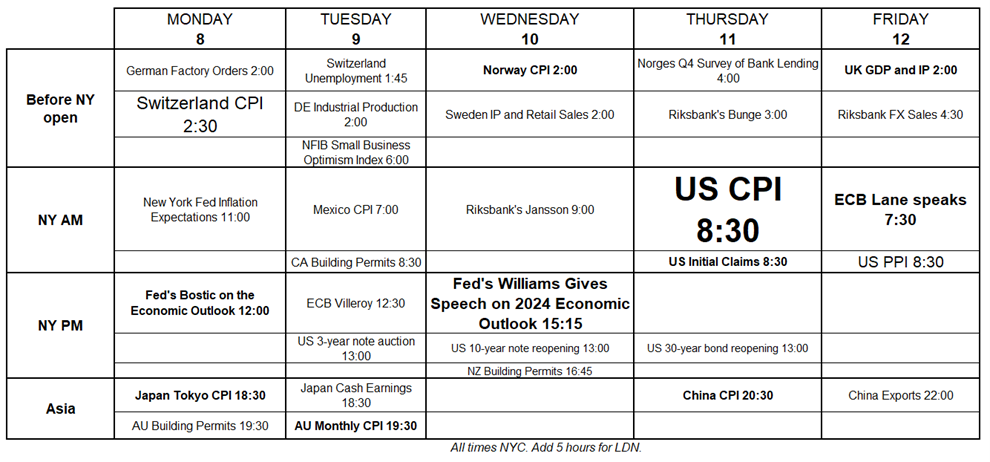
Next week is light on data in most countries. US CPI is the highlight, by far, while a speech from Williams on Wednesday afternoon has some potential. As mentioned above, I think US inflation data is really the only truly tier-1 economic data right now as the immaculate disinflation narrative is what matters most. Probably going to be a low vol week with Thursday a huge exception. Try to trim some theta.
Final Thoughts
Bruce Mehlman’s slideshows are always must-see, and this quarter’s effort does not disappoint! See it here.
Human beats Tetris for the first time. Video here.
Have a strangely-ordered day. Please note I’m out Monday, back Tuesday.
good luck ⇅ be nimble