I think broad EUR is peaking, even if the USD stays weak.

Maps create distortion

I think broad EUR is peaking, even if the USD stays weak.
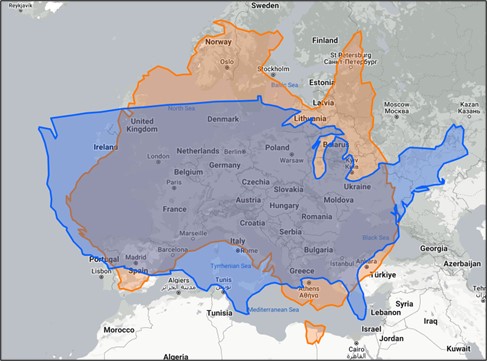
Maps create distortion
08JUN EURMXN
19.50/19.20 put spread
(spot ref. 19.65,
cost ~38.5bps ballpark)
20JUN USDCHF
0.8850 digital put @ 20%
spot ref. 0.9275
May 8, 2023
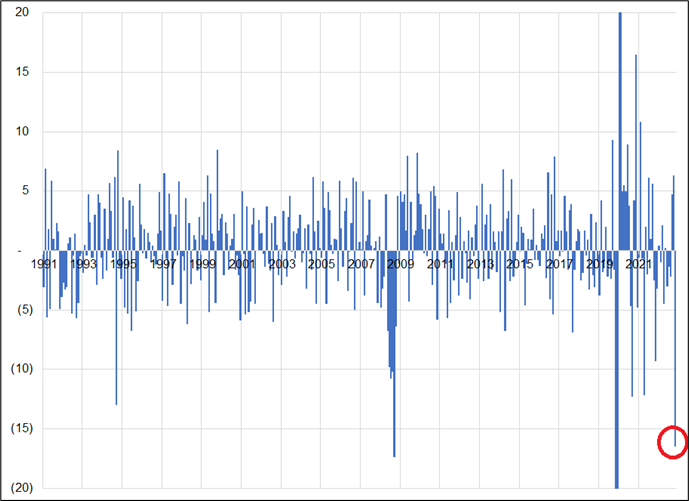
I am starting to think the broad EUR rally is done. We continue to bang up against 1.1100 in EURUSD, most EUR crosses have turned unambiguously lower, German inflation is toppy, the ECB meeting is in the rearview, and German manufacturing and Retail Sales data haven’t been this bad in combination in a single month since 2008. Here is the sum of month-on-month change for German Retail Sales, Industrial Production, and Factory Orders since the fall of the Berlin Wall.
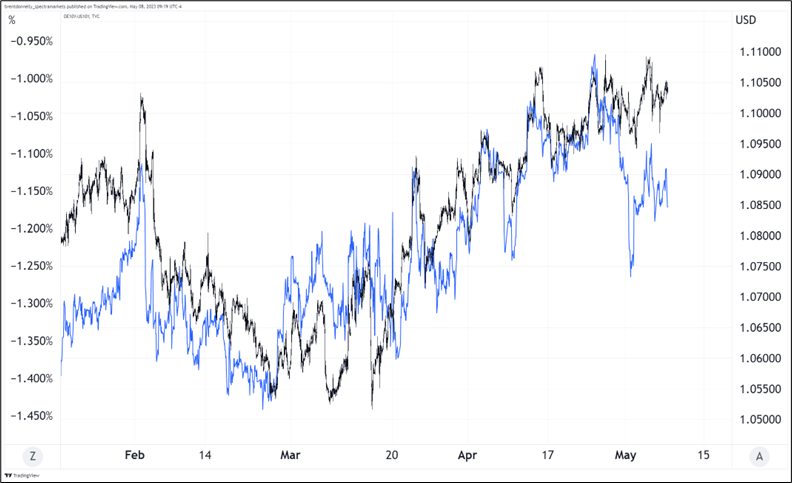
Meanwhile, the chart of EURUSD vs. the German/US 10-year is making lower highs.
I don’t want to be long USD this week with US inflation the main story and the debt ceiling in the background. Therefore a EURUSD short doesn’t work for me, even though it’s easy to risk manage with a stop above 1.1125.
I think the same way economists underestimated the speed of the rise in US inflation, they will underestimate the speed of the fall. Therefore, short EURUSD does not make sense. In a world where the US jobs market is still fine (see next section), inflation is coming off gradually, and there are very few economic events coming up, 1-month EURMXN downside makes sense to me. Keeping it simple, just buy a 1-month 19.50/19.20 EURMXN put spread. I am adding that to the sidebar. Spot shorts could work as well with a stop above 19.80 but the option is much easier to manage. I acknowledge that this trade is easy to do on the institutional side and much harder for retail traders given it’s a more esoteric pair.
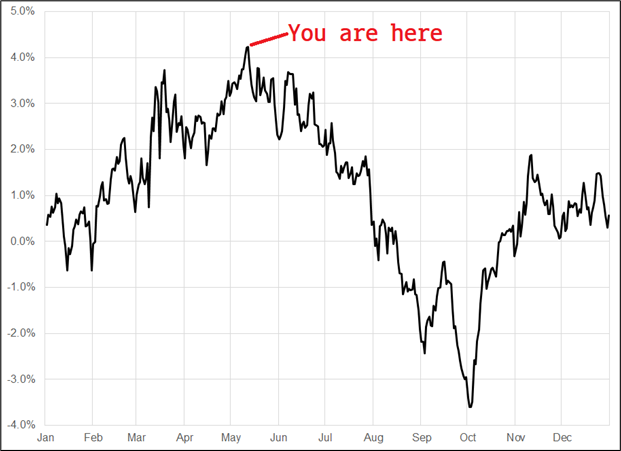
Short EURMXN via options is simple and I like it. I think long carry / short euros works as we stay in a somewhat moribund low-vol regime for FX. Meh seasonality for risky assets is offset by the large short SPX position and it’s helpful that seasonality for yields turns down from here (see next chart). I thought the post-Fed PACW news would lead to a risky asset melt, but again the megacap phoenix rises.
There was some pushback on the strength of the jobs number on Friday, much of it focused on the revisions. This makes sense because downward revisions in NFP tend to be associated with recessions. Here is the history back to 1997.
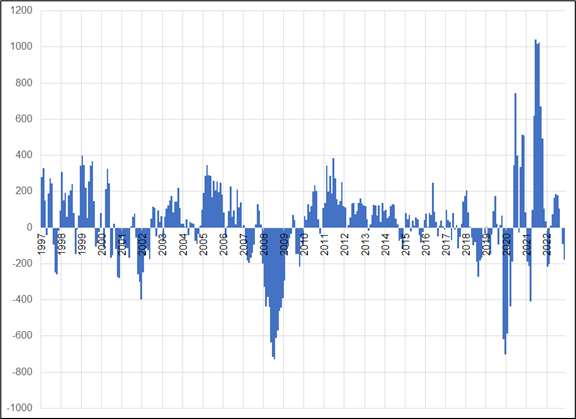
You can see the spate of downward revisions in 2001 and 2002, 2008, and 2020. If you make the chart go further back, you will also see the same thing in prior recessions. The issue with the data now is that this is the third bout of downward revisions we have seen post-COVID. We saw the same thing in mid-2021 and mid-2022 and neither offered a useful signal on the jobs market. In fact, the opposite was true, revisions turned massively positive, and the jobs market was generationally strong.
Net revisions in the past two years have been plus 1.4 million, so I’m not sure if a 3-month sum of -179,000 is enough to trigger alarm bells. Especially when that 3-month figure hit -408,000 in August 2021 and -217,000 in June 2022. After two false positives, the third signal is hard to get excited about.
People also said my chart showing thirteen stronger-than-expected jobs numbers in a row is not true net of revisions. That is accurate, though just barely. Here is NFP actual vs. expected, net of prior month revision.
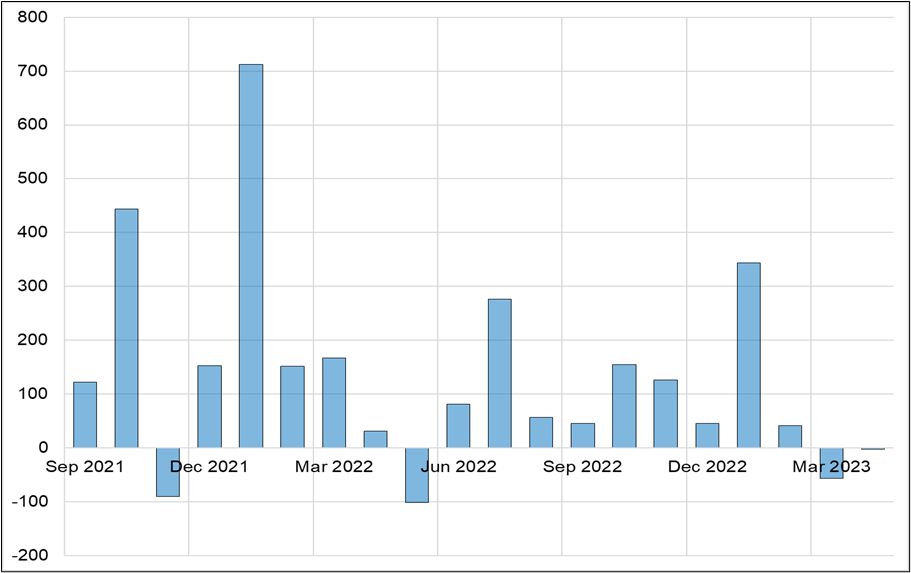
OK, sure, the streak is not valid, but the point remains the same: Economists are using the wrong model inputs to prepare forecasts in this cycle. The inputs that matter are on the supply side, and demand is consistently higher than supply. Until the COVID labor shortage is absorbed, workers returning to the work force (and the unemployed population) will continue to get vacuumed up. If you’re trying to predict a turn in the labor market, you need to look for the point where supply and demand equalize. That is more about levels in JOLTS, not changes in JOLTS.
JOLTS is not perfect. The methodology changed in 2009 and thus charts that go back further have some question marks. Also, the Dallas Fed did a nice piece on how more job postings these days are not as clearly for open roles (they are attempts to poach from other companies). You can read the piece here. Still, the JOLTS data is telling the same story as the Conference Board Index of Jobs Hard to Get vs. Plentiful comparison, so JOLTS seems fine to me.
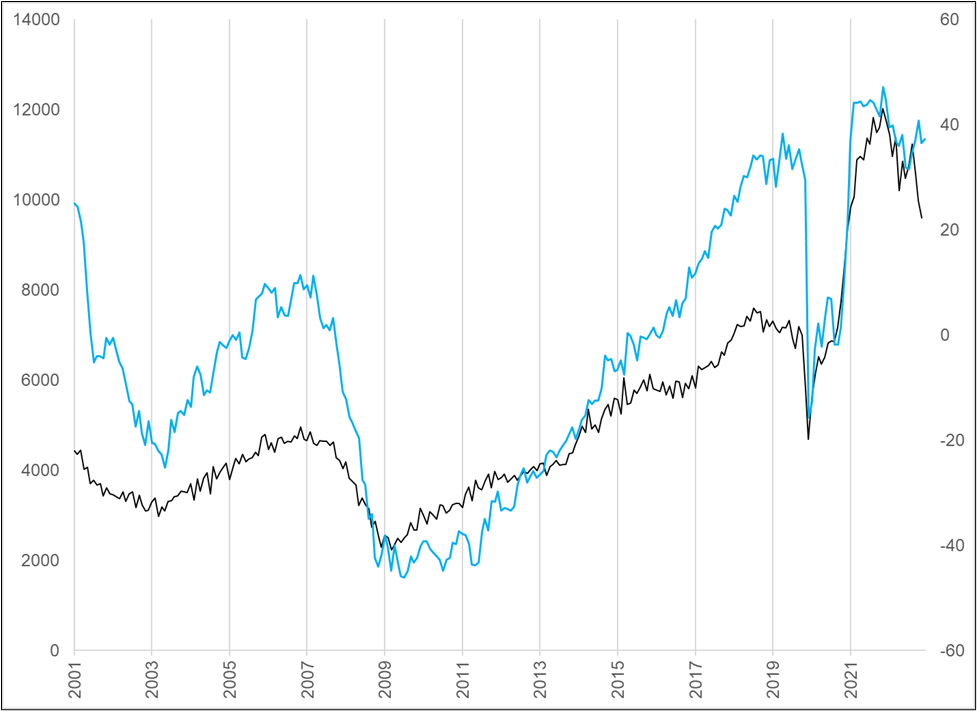
There are at least ten reasonable ways to slice and dice the jobs data. Skeptics will always find weakness in some details. For a while it was the household survey, but that survey is 100% noise and it caught up to the establishment survey so people stopped talking about it. I have covered this before, but if you ever hear someone talking about the household survey, they are almost always using it to support a prior bias. It’s just a much-noisier version of NFP and NFP is already a noisy series. The household survey is all noise, no signal. Here is the chart for your perusal. That red circle shows a period when some commentators were claiming the household survey revealed underlying jobs market weakness. The household survey then exploded to the topside immediately after and outperformed the establishment survey for months.
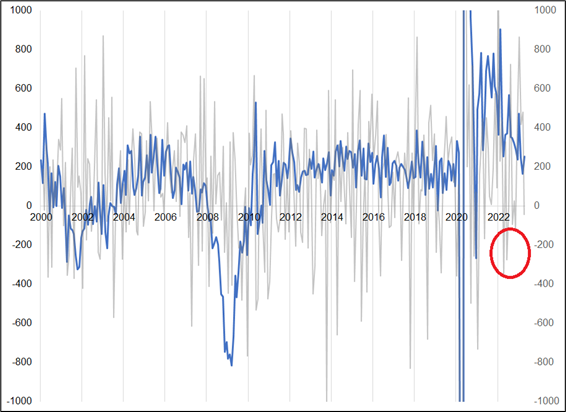
When the household survey rebounded, skeptics turned to the benchmark revisions, or the monthly revisions, or the change in the UR, or the participation rate, or the birth/death model, or hours worked, or the private jobs data. Still, the net of all the data in the past 24 months, and my observation while walking around my town, or NYC, or anywhere in the Northeast United States… Shows the tightest labor market in my lifetime. This jobs report doesn’t change anything. Regardless of all the caveats, the US jobs market remains in shortage.
The day the US labor market shortage is fully absorbed, we enter a different economic regime. But economists have been front running that regime change for more than a year and the data (and the real world) refuses to cooperate. The flip to labor market weakness once the shortage is absorbed could well be non-linear and we’ll probably know it when we see it. I doubt it will be subtle, and I doubt it will involve parsing particular elements of the data. The headline numbers will be bad, the unemployment rate will rise, and you won’t need to squint or strain your eyes to see it.
Have a well-mapped-out day.
https://unchartedterritories.tomaspueyo.com/p/maps-distort-how-we-see-the-world