The S&P Services figure was enough to decimate some short-term positions, but the damage has been contained as key levels hold. Could be more noise than signal.
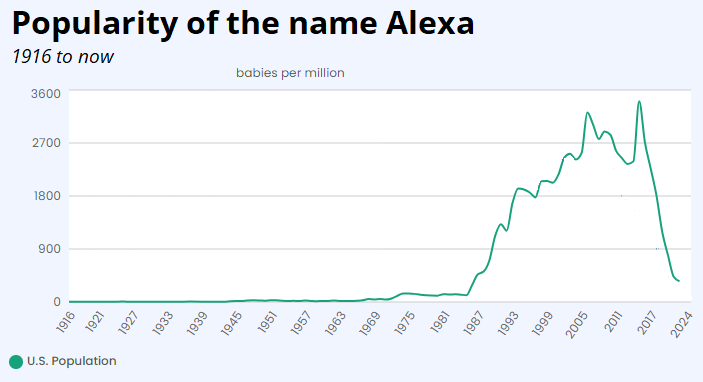
Amazon casualties include Barnes & Noble, Borders, and the name Alexa

The S&P Services figure was enough to decimate some short-term positions, but the damage has been contained as key levels hold. Could be more noise than signal.

Amazon casualties include Barnes & Noble, Borders, and the name Alexa
Flat
Yesterday’s Services PMI from S&P was a barnburner. They don’t let you look back more than three years without paying for the data, but here are the last 36 monthly misses (actual vs. expected) for the figure.

If we compare the S&P series to the better-known and longer ISM Services figure, we get an overlay that looks like this:
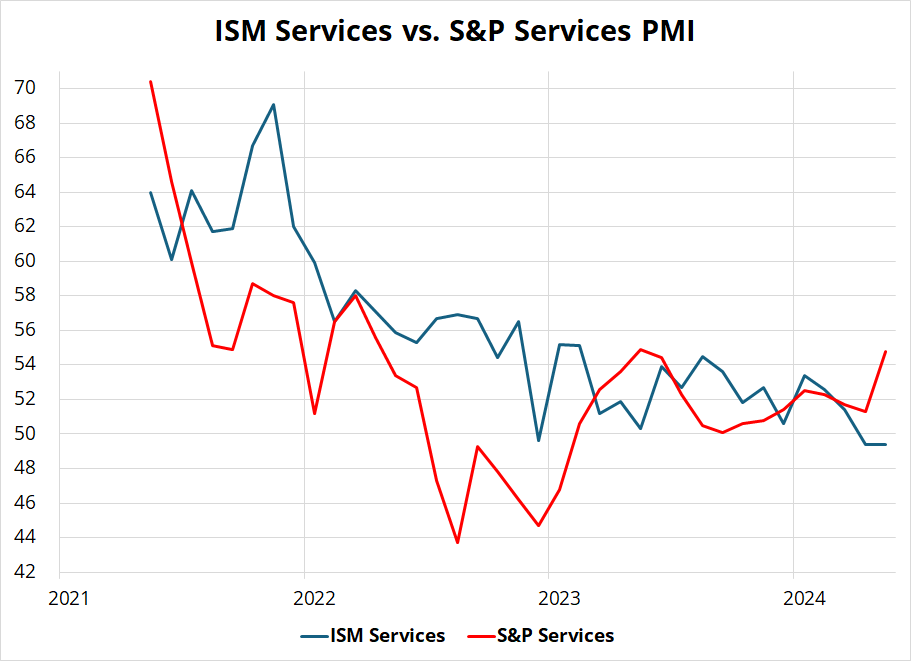
If you squint hard enough, you might see the red line leading the blue line lower, but there is probably more noise than signal in there as far as I can see. Digging into the monthly data, the monthly changes in the two releases look like a shotgun blast. See next chart.
The signs of the changes (i.e., comparing whether S&P Services and ISM Services are stronger or weaker vs. prior month) only match 20 out of 36 times and there doesn’t seem to be any correlation.
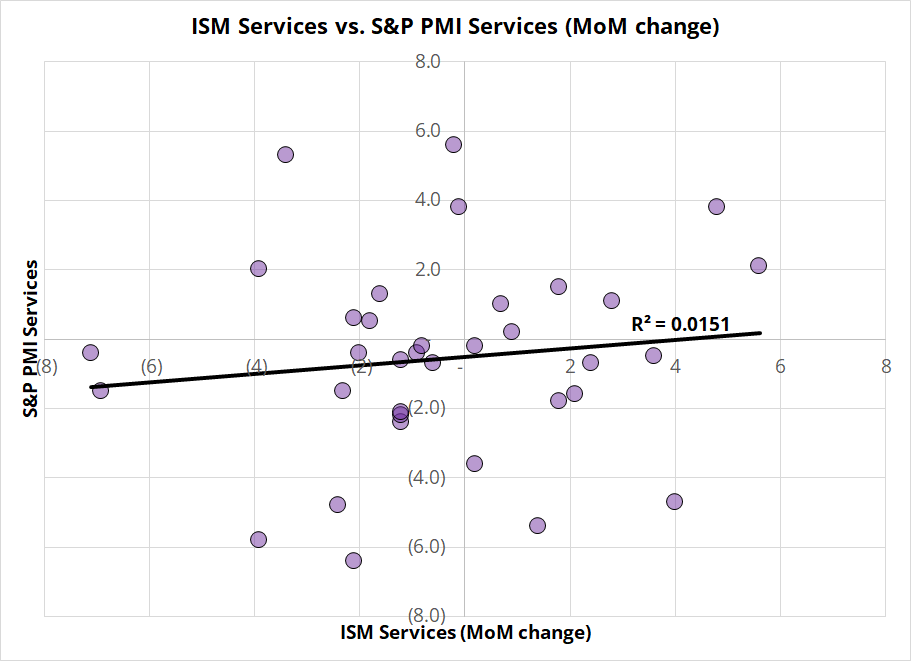
Side note: I have been using Excel since 1997, but still sometimes discover new functions that I didn’t know existed. Today, for example, I was able to use the “SIGN” function to test the sign of the S&P Services MoM data vs. the sign of the ISM Services MoM data (e.g., =AND(SIGN(E8)=SIGN(F8)). Neat. Old dog learns new trick. Woof.
Overall, I would argue the S&P Services PMI may or may not be a red herring. There is not strong evidence that it’s predictive for this month’s ISM Services and it doesn’t dramatically alter my view that we are entering a mild period of softening demand in the US. It definitely doesn’t’ support my view, but it’s a single data point and it does not invalidate it, either.
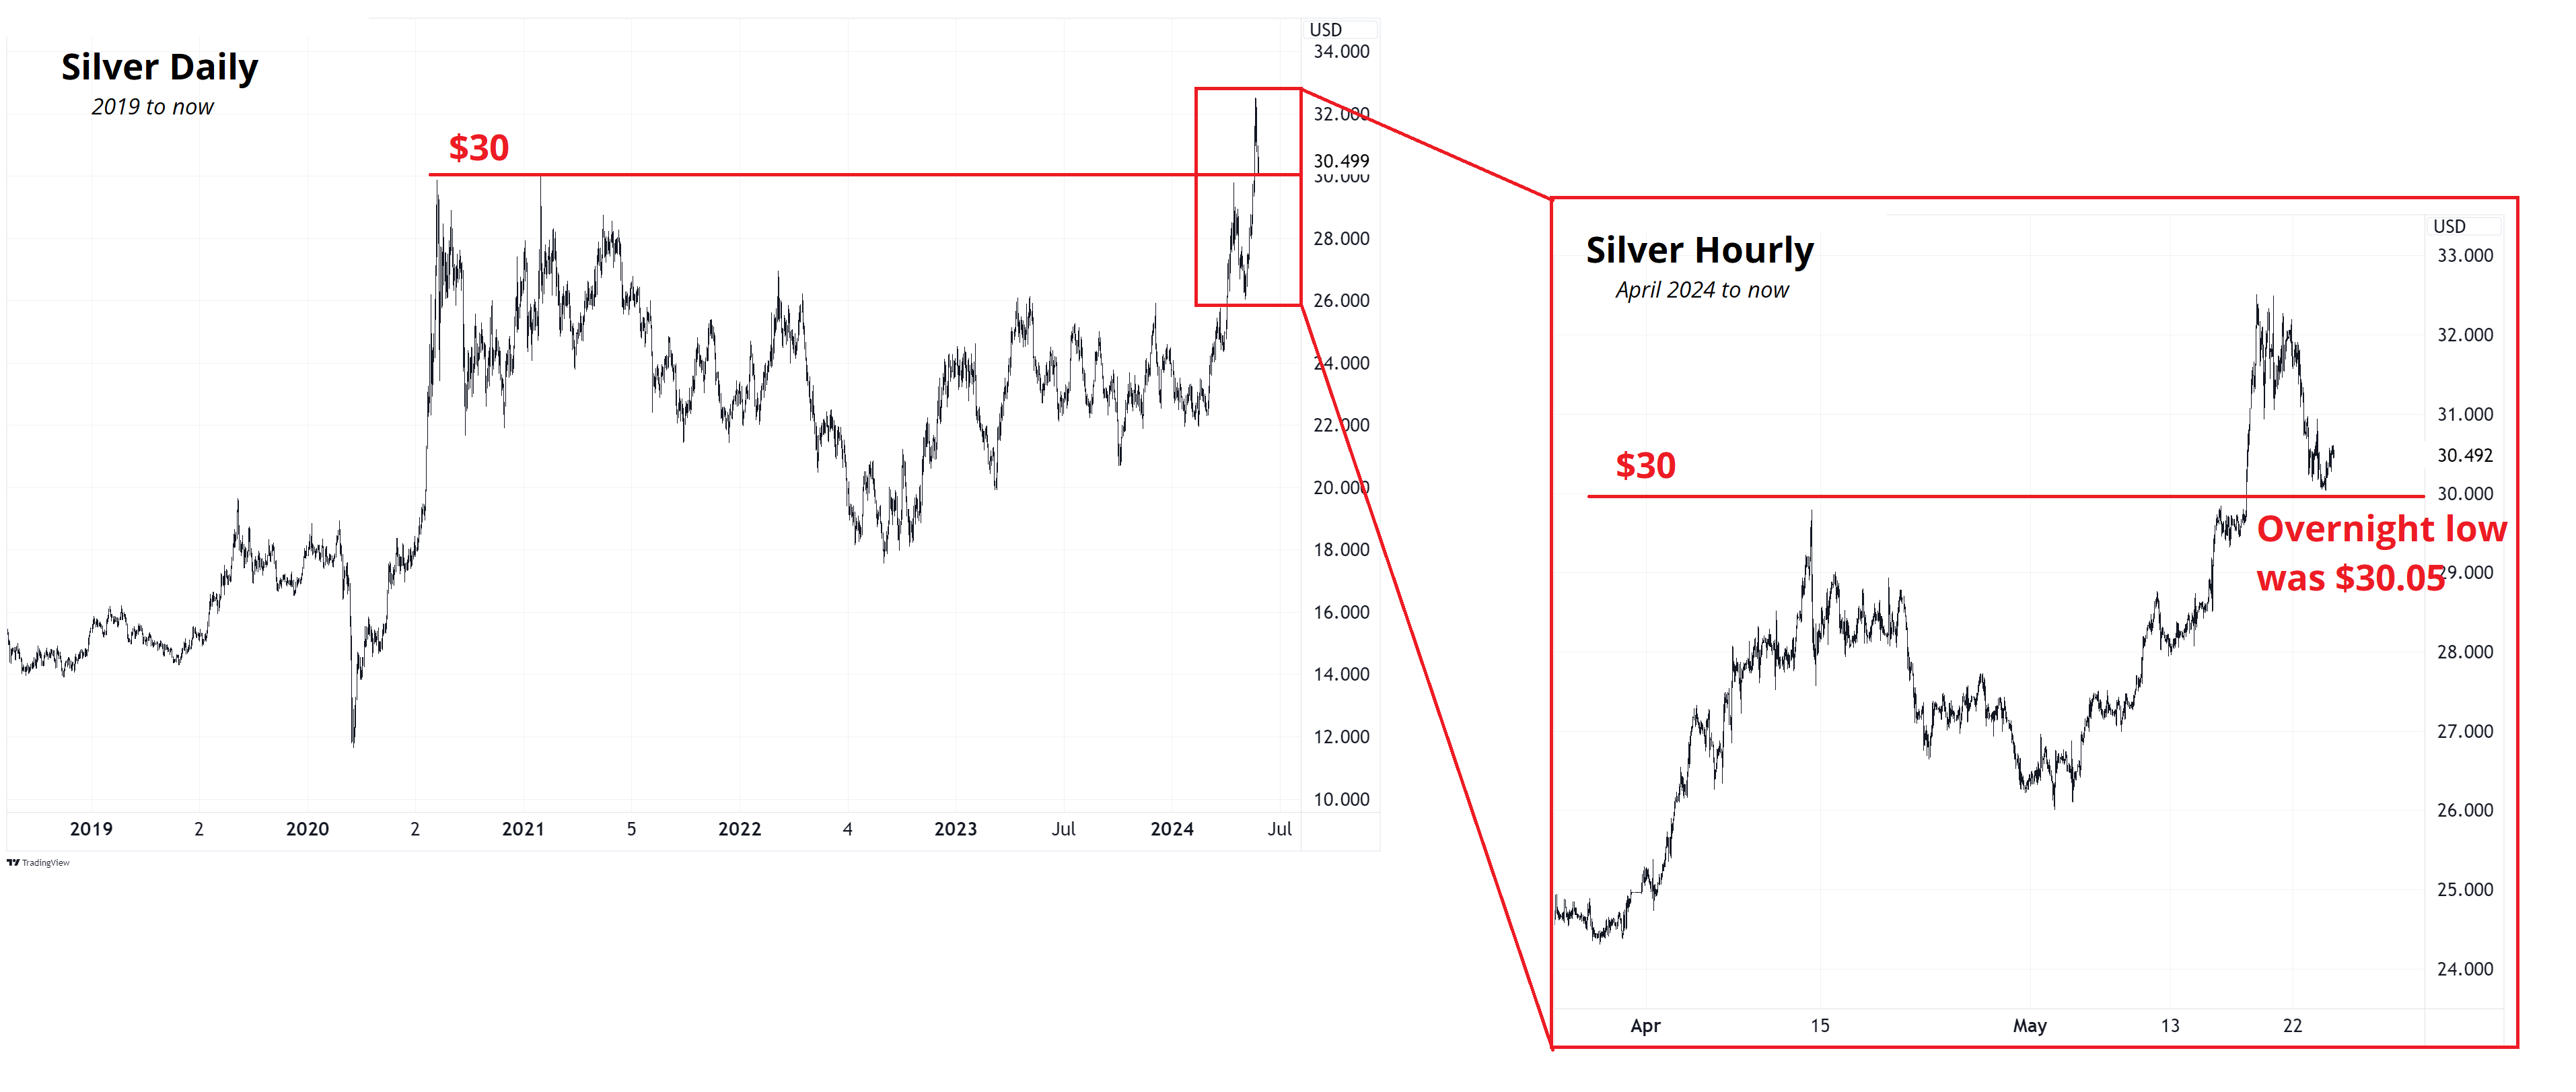
What it did, instead was trigger an acceleration of the short-term wipeout in the most popular trend-follower trades like copper, silver, and gold. I think it’s interesting that $30, the multi-year post-COVID megapivot in silver, held almost to the cent overnight. See chart.
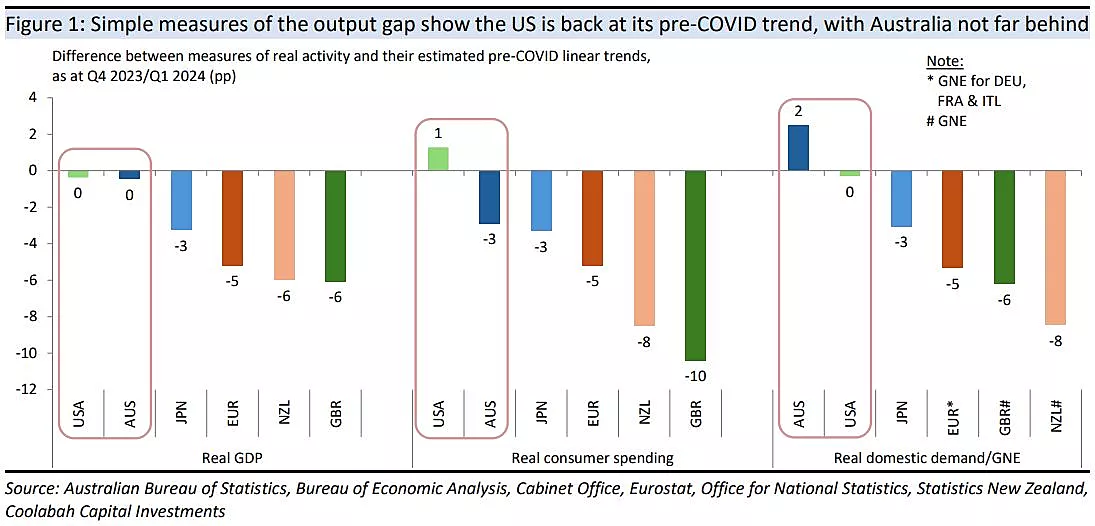
Kieran Davies of Coolabah Capital made a nice graph of slack in various countries.
https://www.livewiremarkets.com/wires/judging-post-covid-economic-recoveries
The Oz figure is particularly interesting. If you’re a bigger picture player, you might look at the recent hawkish RBNZ meeting as a fake out or policy error and use this dip in AUDNZD to get involved.
A few quick things:
For the record, no long EURUSD trade triggered yesterday, of course, because the PMI was strong, not weak. But FYI even after that huge S&P PMI beat, rate differentials still point to higher EURUSD, not lower.
We have a system here that tracks open rates and forwarding of am/FX and I mentioned to my Mom that her open rate is 57% (which is not terrible). Now she feels self-conscious and is going to make sure she opens it every day. Whoops. :] Monday is a holiday here, so I will catch you on the 28th.
Lest we forget.


This piece is mostly for people who are interested in backtesting