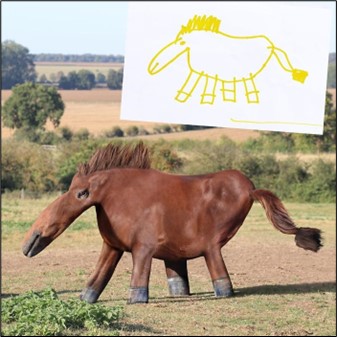
A few years ago, a man
converted child’s drawings of
animals using Photoshop
to render them into
realistic images.
I applaud his execution.
March 2, 2023
Short USDJPY
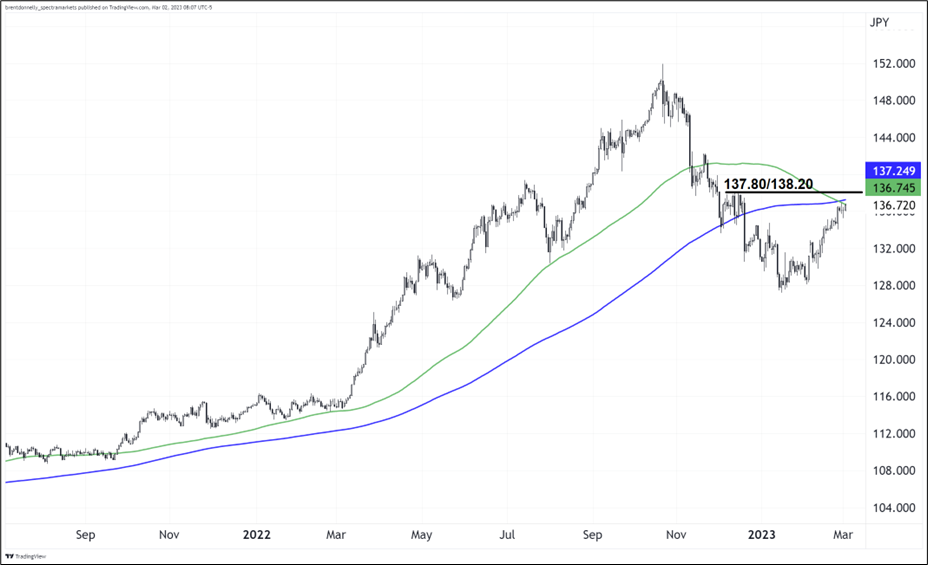
I feel like it behooves me to show the USDJPY chart again. Going into the December BOJ meeting (where they changed YCC), USDJPY was trading 137.50. the 100-day is 136.75 and the 200-day is 137.25. The quintuple top before December BOJ was 137.80/138.20. That’s a lot of levels all in one area. And if you were a believer in the idea that there would be repatriation flows from the big boys in Japan… This is probably the zone where those flows would start.
USDJPY is in the zone
The problem with short USDJPY right now is obviously that yields are going a little bit bazonkers and they are going from benign to mildly scary. And you have Services ISM tomorrow plus we have Tokyo CPI tonight.
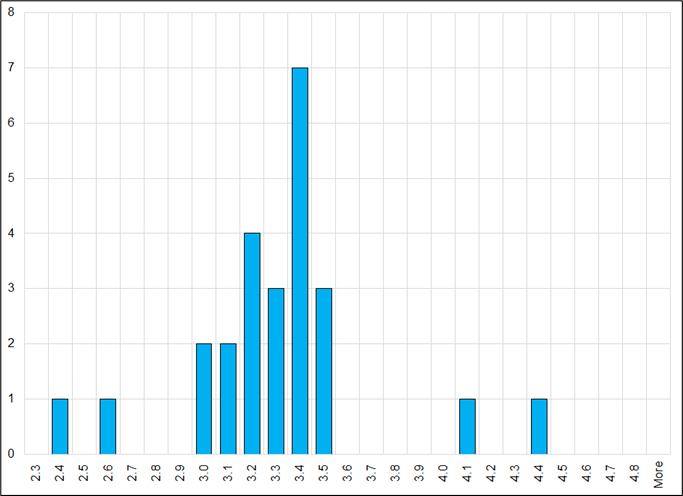
Money has to slowly make its way into the Chinese economy and as the weather improves and spending picks up, the story should gain momentum. Also note that Tokyo CPI comes out tonight at 6:30pm NY. It’s more eagerly-awaited than usual because there is an energy subsidy component that could drive the rate substantially lower. The spread of economist forecasts is much wider than usual, running from 2.4% to 4.4% which is nutty dispersion for a YoY figure. Tokyo CPI comes out almost a month before national CPI in Japan and the figure is a ~ perfect lead indicator for the national number.
# of economists forecasting various prints for Tokyo CPI ex-Food YoY
It’s a curious fact of how USDJPY behaves like a Veblen good… Nobody wants to sell it at the highs. There was much more interest to sell USDJPY at 130.00 than there is here and I get it—especially as US recession fears have all but disappeared. Still, to me this is a dream entry point chart-wise and we have fully retraced the entire BOJ move. March 9 BOJ could be in play and my bet would be that USDJPY runs lower into that meeting, too.
I am going short here (136.90) with a stop at 138.56.
Stonks
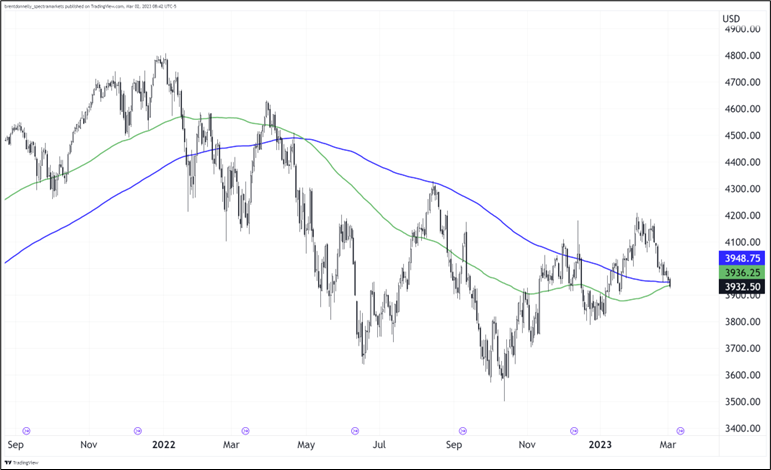
I have been writing about how the moves in yields have not been scary as vol has been super contained. We are probably pushing towards a point where that will no longer be the case, but I don’t think we’re quite there yet. The chart of SPX is rather nice as well with the 100-day and 200-day converging in similar fashion to USDJPY. I am going to write about this tomorrow because there is more involved research I need to do, but take my word for this for now: Stocks don’t usually spend much time above the 200-day in legit bear markets. The fact we have been above for a month is somewhat unusual if you look at all the bear markets over history. As such, I think how we trade around here is important.
3949 is the 200-day and 3900 is that last low in January. It’s mind-blowing that we are trading the same level in SPX now as we were trading in May 2022.
S&P Futures back to September 2022 with 100-day and 200-day moving averages
Final Thoughts
Does anyone have a better bond market volatility index than MOVE? That thing doesn’t update in real time. VXTLT? Or? Please email me, thanks.
I have a new educational piece about adapting to regimes, vol-adjusting position size and other related topics. You can read it here: https://50in50.substack.com/p/week-45-regime-flux
Have an uncanny day.
good luck ⇅ be nimble