

The US data is rolling over, very slowly. NFIB is another data point but CPI and Retail Sales will be more important.
Slowly Getting Worse
Subscriber-only
BD
by Brent Donnelly

Current Views
20JUN USDCHF
0.8850 digital put @ 20%
spot ref. 0.9275
21JUN USDJPY
123 digital put @ 20%
spot ref. 131.30
April 11, 2023
Slowly getting worse
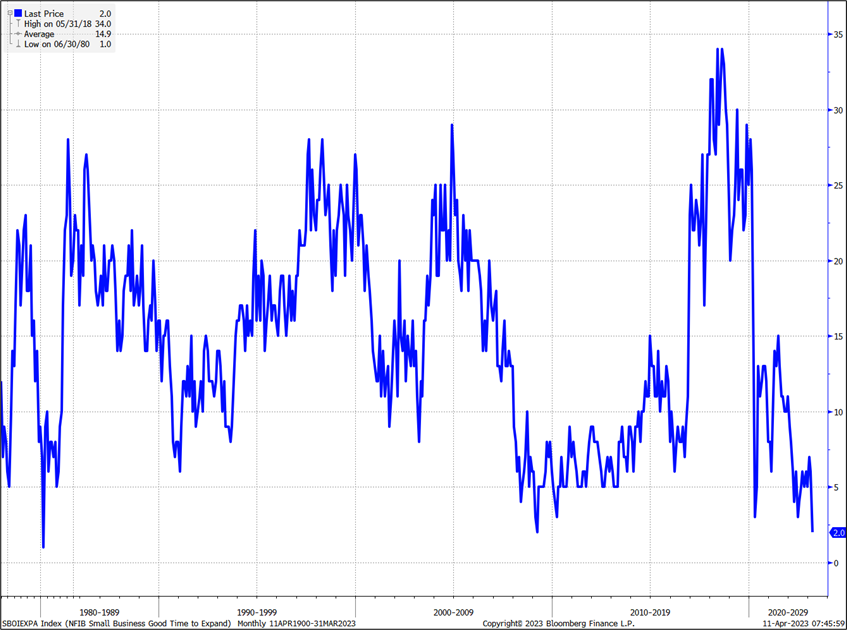
The NFIB Business Optimism number came out this morning and there is nothing particularly dramatic despite ongoing weakness. The Jobs Hard to Fill Index dropped four points, which is exactly what you would expect given the drop in JOLTS last week. The headline number, meanwhile, was unchanged as small businesses are not yet panicking over the great 3-day banking crisis of March 2023. Still, most of the subindices are leaking toward multi-year lows. Here’s how expansion plans look. Eek.
NFIB Business Survey: Good time to Expand Index, 1978 to now
We get a ton more data this week, along with bank earnings starting Friday, so there will be more information to be harvested on the current state of the US economy. The challenge with tomorrow’s inflation release is similar to the challenge posed by the US labor market: It’s bifurcated.
Goods prices are unambiguously in retreat. Here is the Adobe online price index, e.g.
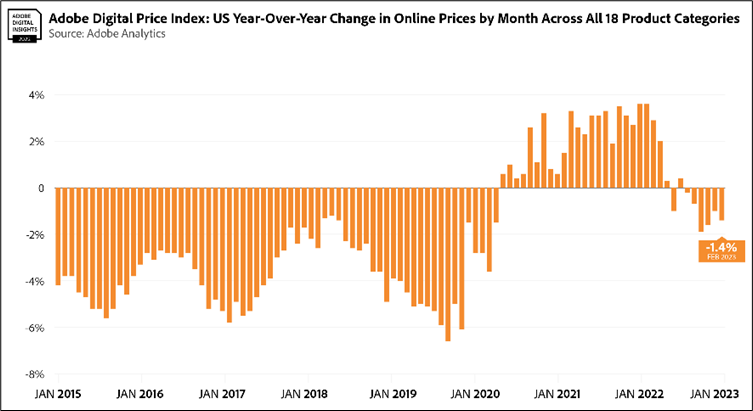
But much as there is a surplus of college-educated workers and a shortage of unskilled labor, there is a meaningful softening in goods and commodity prices while core services inflation remains super sticky. This is the case in Europe, too, as evidenced by the data out of Norway this morning.
Norway YoY CPI vs. PPI (2010 to now)
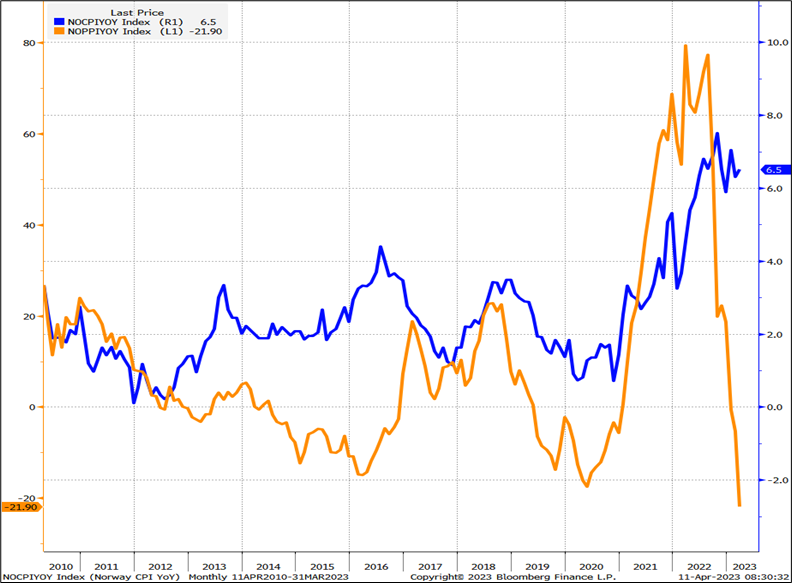
Note that orange line is measured on the left y-axis and printed minus 21.9% YoY! The base effect from lower oil prices is a huge driver, but shipping and fertilizer prices are coming down hard and fast, too.
Two fertilizer price series (blue and black lines) and Baltic Dry Freight Index (2010 to now)
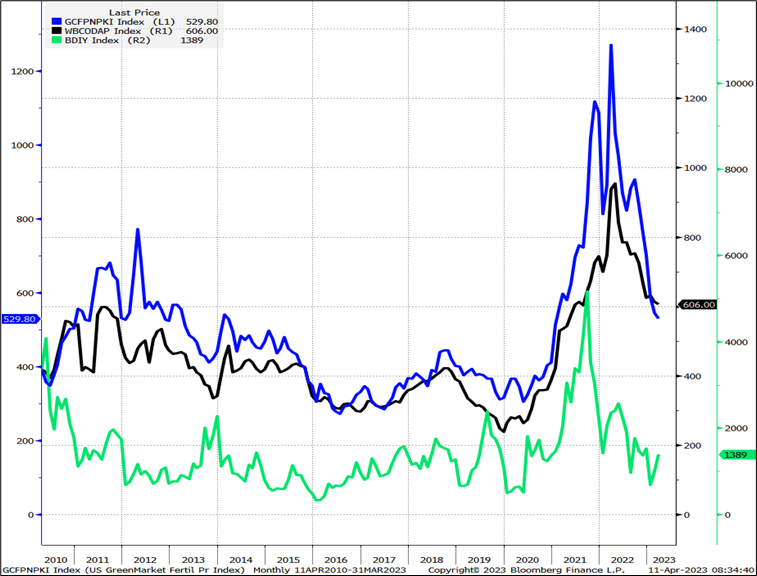
Will firms pass on lower input prices? Or will sticky labor costs and services prices keep consumer prices higher for longer? To me, it seems like a matter of time before weaker growth prospects and lower input prices bring inflation down across the board. But that doesn’t mean it’s going to be visible in the March data. The process is glacial.
We also get Retail Sales later in the week and most of the high-frequency evidence from credit card data points to weaker US consumer spending. The net of all this is that I am happy to stick with the USD short thesis through this week’s patch of data. After Friday, it’s probably time to reassess because there isn’t much to chew on in the back half of April.
USD
The dollar went a bit silly in holiday markets yesterday, with EURUSD doing this:
EURUSD 5-minute chart over the past 30 hours
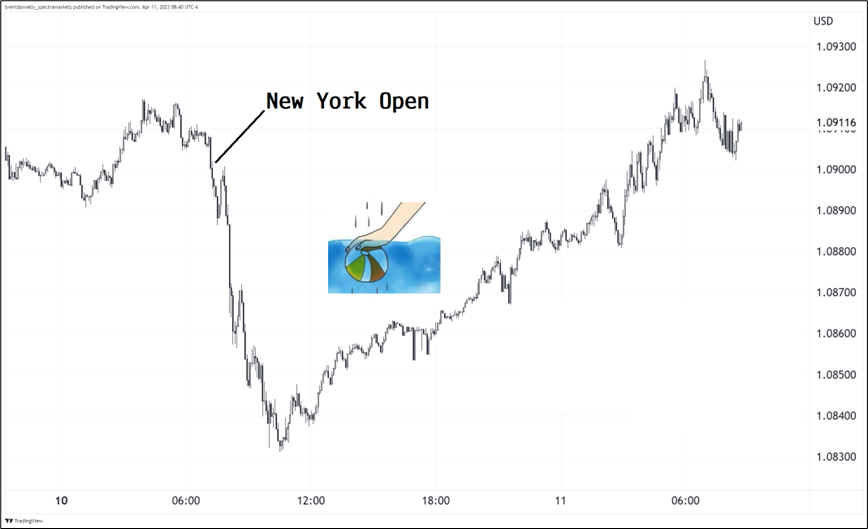
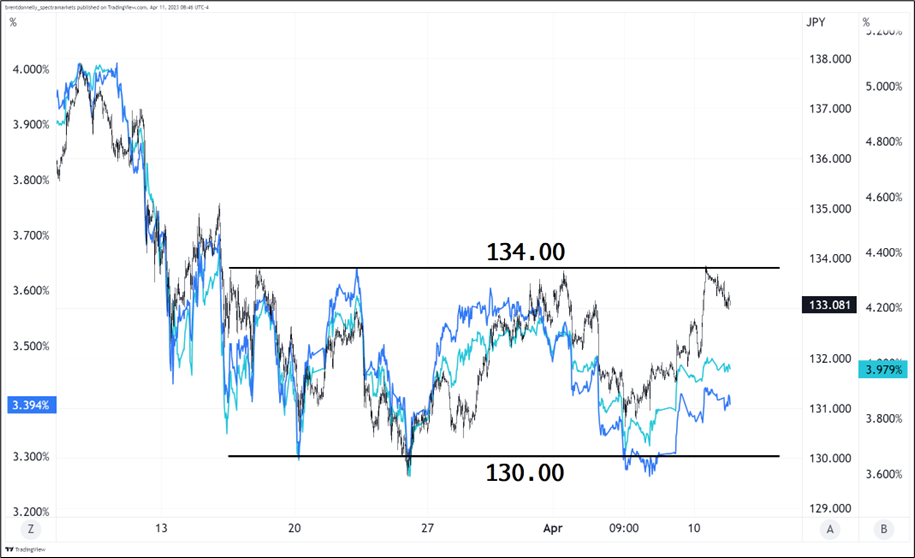
The USD rally looked as random as they get as US yields were being have and equities made a similar v-shaped move, also trading like a beach ball underwater. USDCHF bounces continue to be sold while the USDJPY short has been boring and disappointing in recent weeks. The only encouraging thing I can say for USDJPY shorts is that the top of the 130/134 range has held so far. So that’s good, I guess. Here is the visual.
USDJPY vs. US 2-year and 10-year yield
Final Thoughts
I have stopped out of the EURNOK trade, finally. In the time since I put it on, oil went up, risky assets rallied, and CPI came in higher-than-expected in Norway. Yet NOK is significantly weaker. NOK is so punchable sometimes.
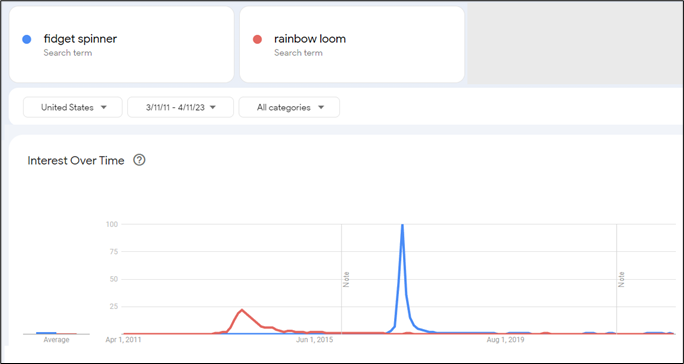
Finally, unrelated, and I truly have no idea why, but “fidget spinner!” just popped into my head. Remember those?
Have a magical day.
good luck ⇅ be nimble
A labracadabrador
Abra Cadabra comes from an old Hebrew phrase that means “I create as a I speak.”
HT: JRoss
Click here to subscribe to am/FX
More recent posts




Rabbit Holes
CAD and Rabbit Hole #18
This piece is mostly for people who are interested in backtesting