TINA is OOO
While commodities, technicals, positioning, and a rebound in manufacturing data (and just about everything else) pointed to the possibility of USD weakness this week, there is also the matter of a recent pause in US equity exceptionalism. As long as fixed income vol remains contained, we are in the middle of the USD smile.
Here is 1-month performance of various global equity indices:
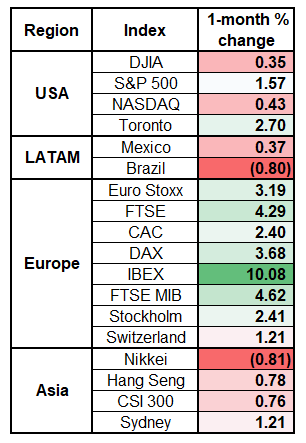
This mega outperformance by European equities is probably a good partial explanation for why the EUR has held in OK vs. the USD, even as US 10-year yields make new highs for 2024.
Game planning for the USD short… As discussed yesterday, I am leaning towards a weaker NFP but the edge there is pretty thin. Looking at the three components of the USD basket put on earlier this week, we are not yet in oversold territory for the dollar, but we are approaching some interesting zones.
AUDUSD
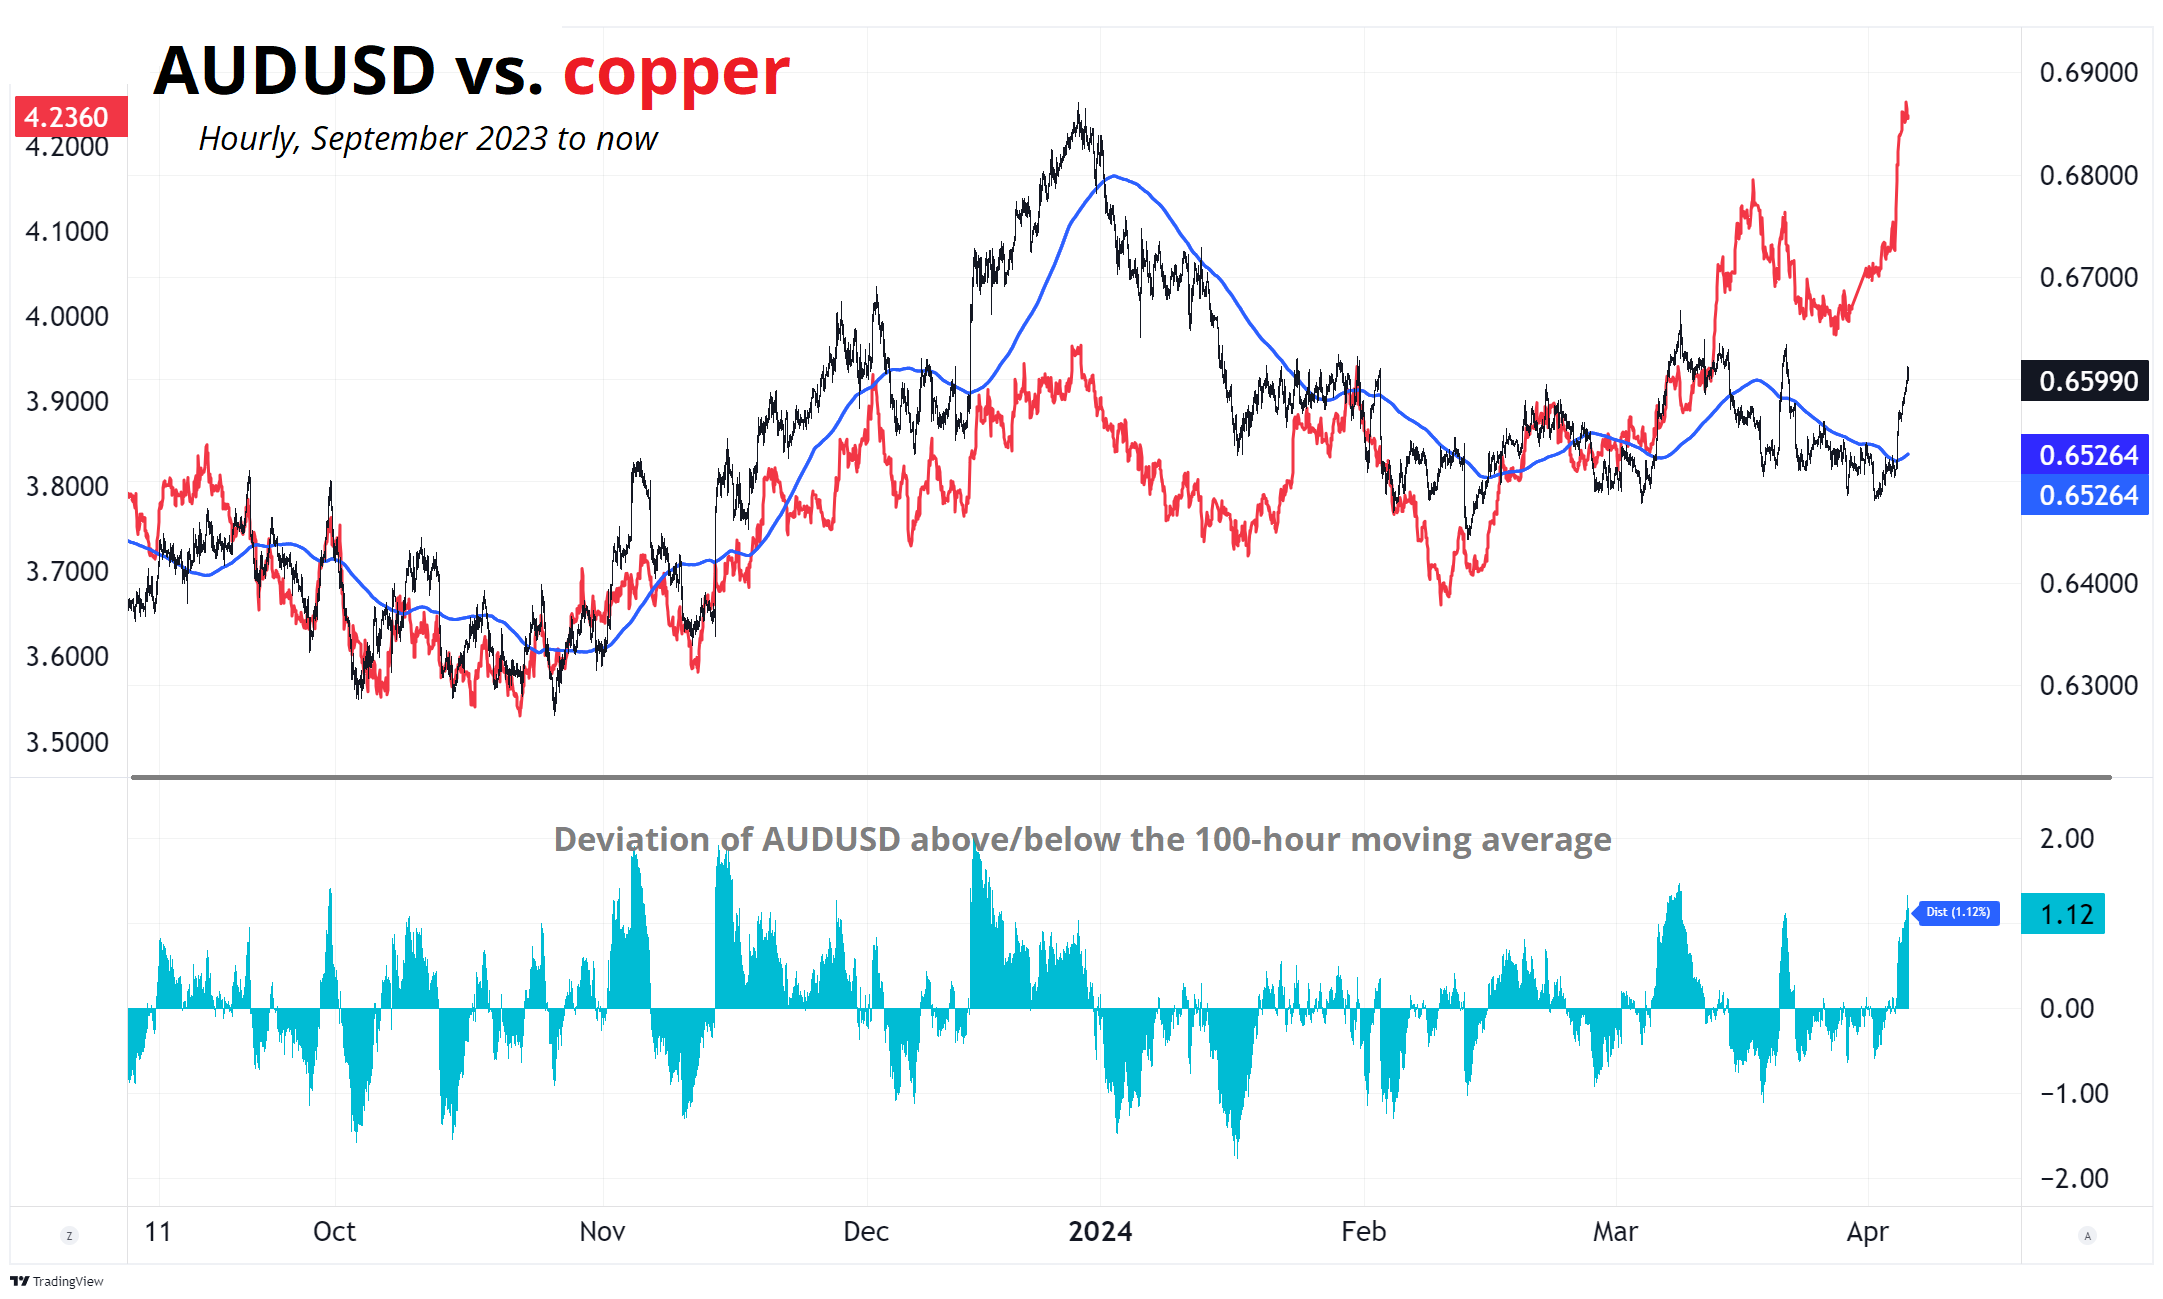
This first, somewhat busy chart shows AUDUSD (black bars) and copper (red line) in the top panel and the difference between spot and the 100-hour MA in the bottom panel. You can see that the deviation from the 100-hour MA (aka The Deviation) tends to max out around 1.5%/2.0% and this is therefore a useful overbought/oversold measure. That comes in at 0.6630/50 today. Short-term that is a good place to take profit and if we get there today, I will cut the AUDUSD in an effort to reduce some risk before NFP.
If we look at the AUDUSD chart without all the cacophony, we get the chart below. It shows that 0.6630/0.6665 are two big resistance levels and that confirms my desire to take profit up there if I can do so before NFP.
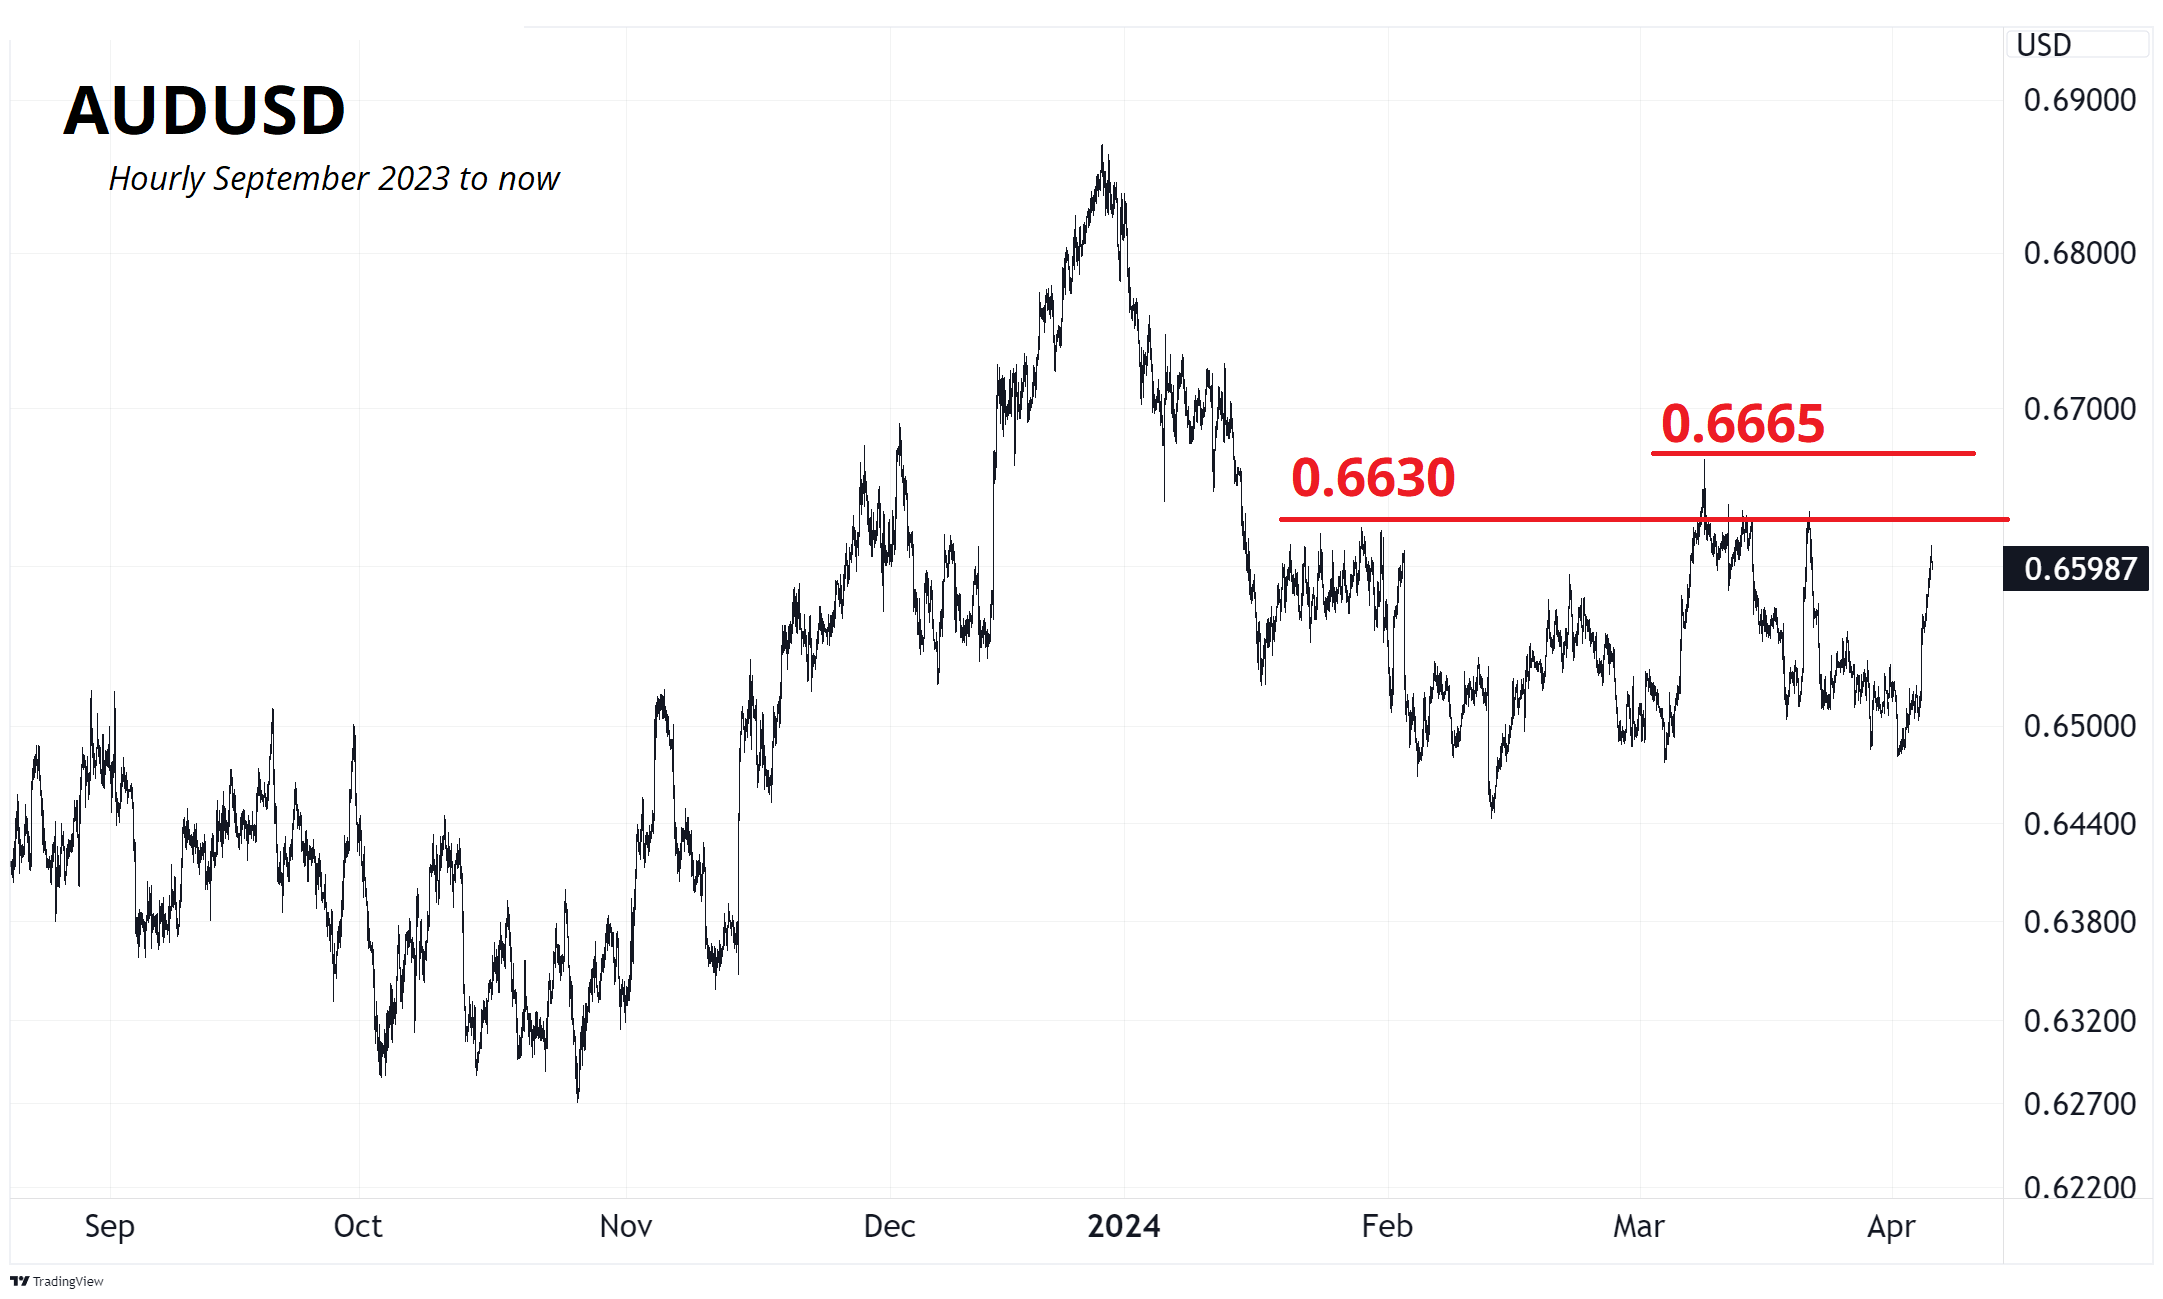
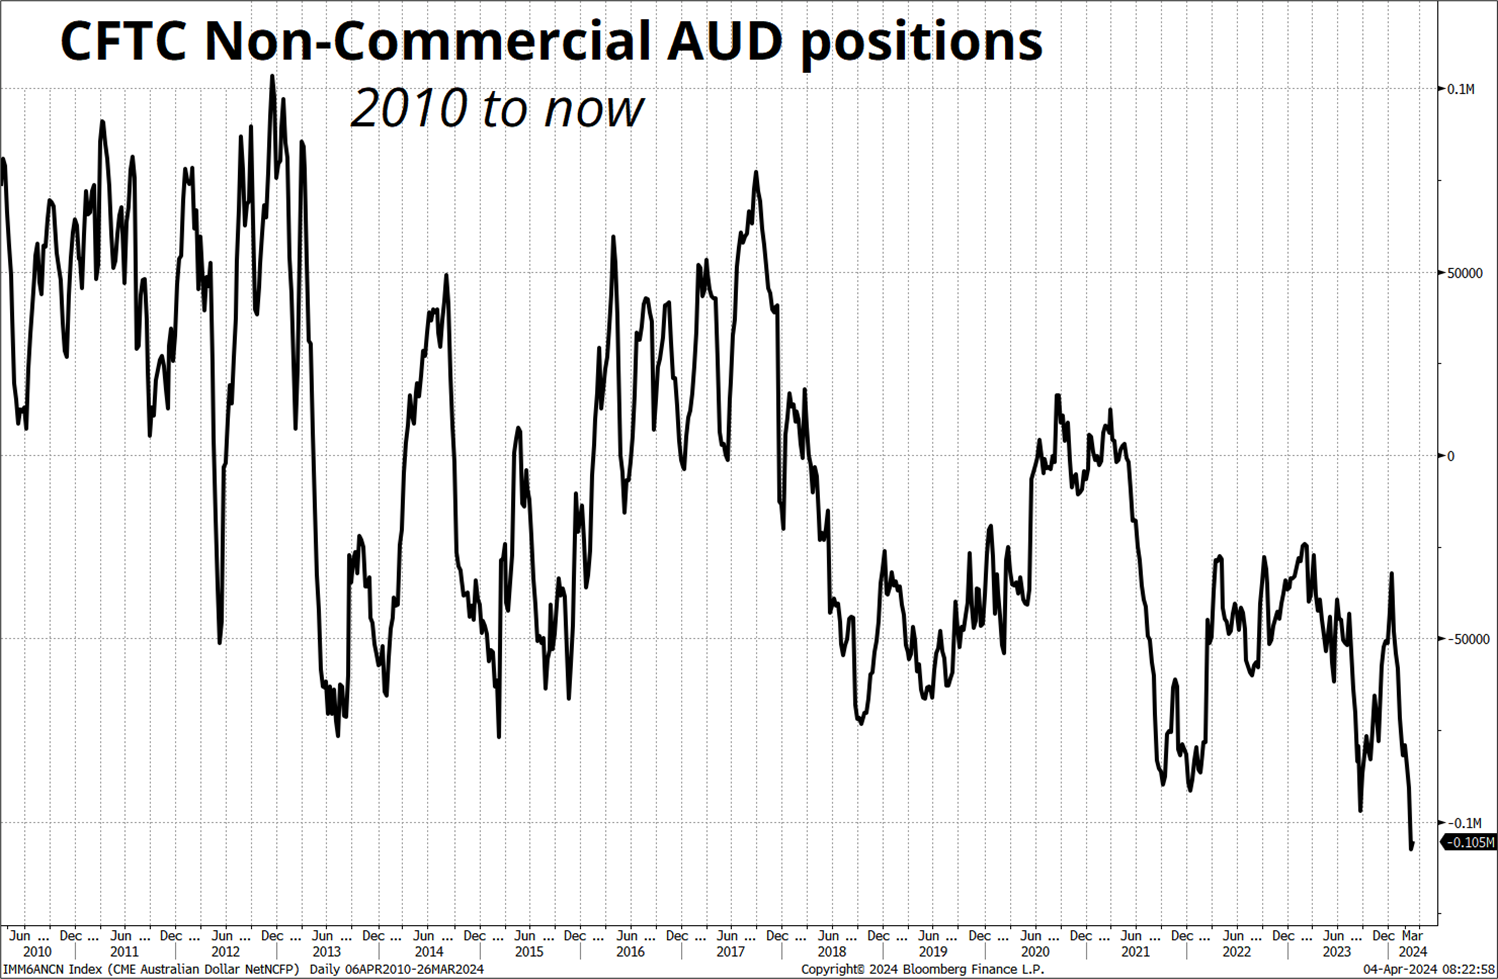
If we manage a daily close above 0.6670, that qualifies as a breakout of the 0.6440/0.6665 range that has dominated since January and it could trigger the beginning of some CTA unwinds. The CFTC is mega short AUD.
USDCAD and USDNOK
Looking at USDCAD, the market has been bearish the currency for ages and we are heading back to the bottom of a long triangular consolidation. Through 1.3460 could open up a retest of 1.3350 pretty quick.
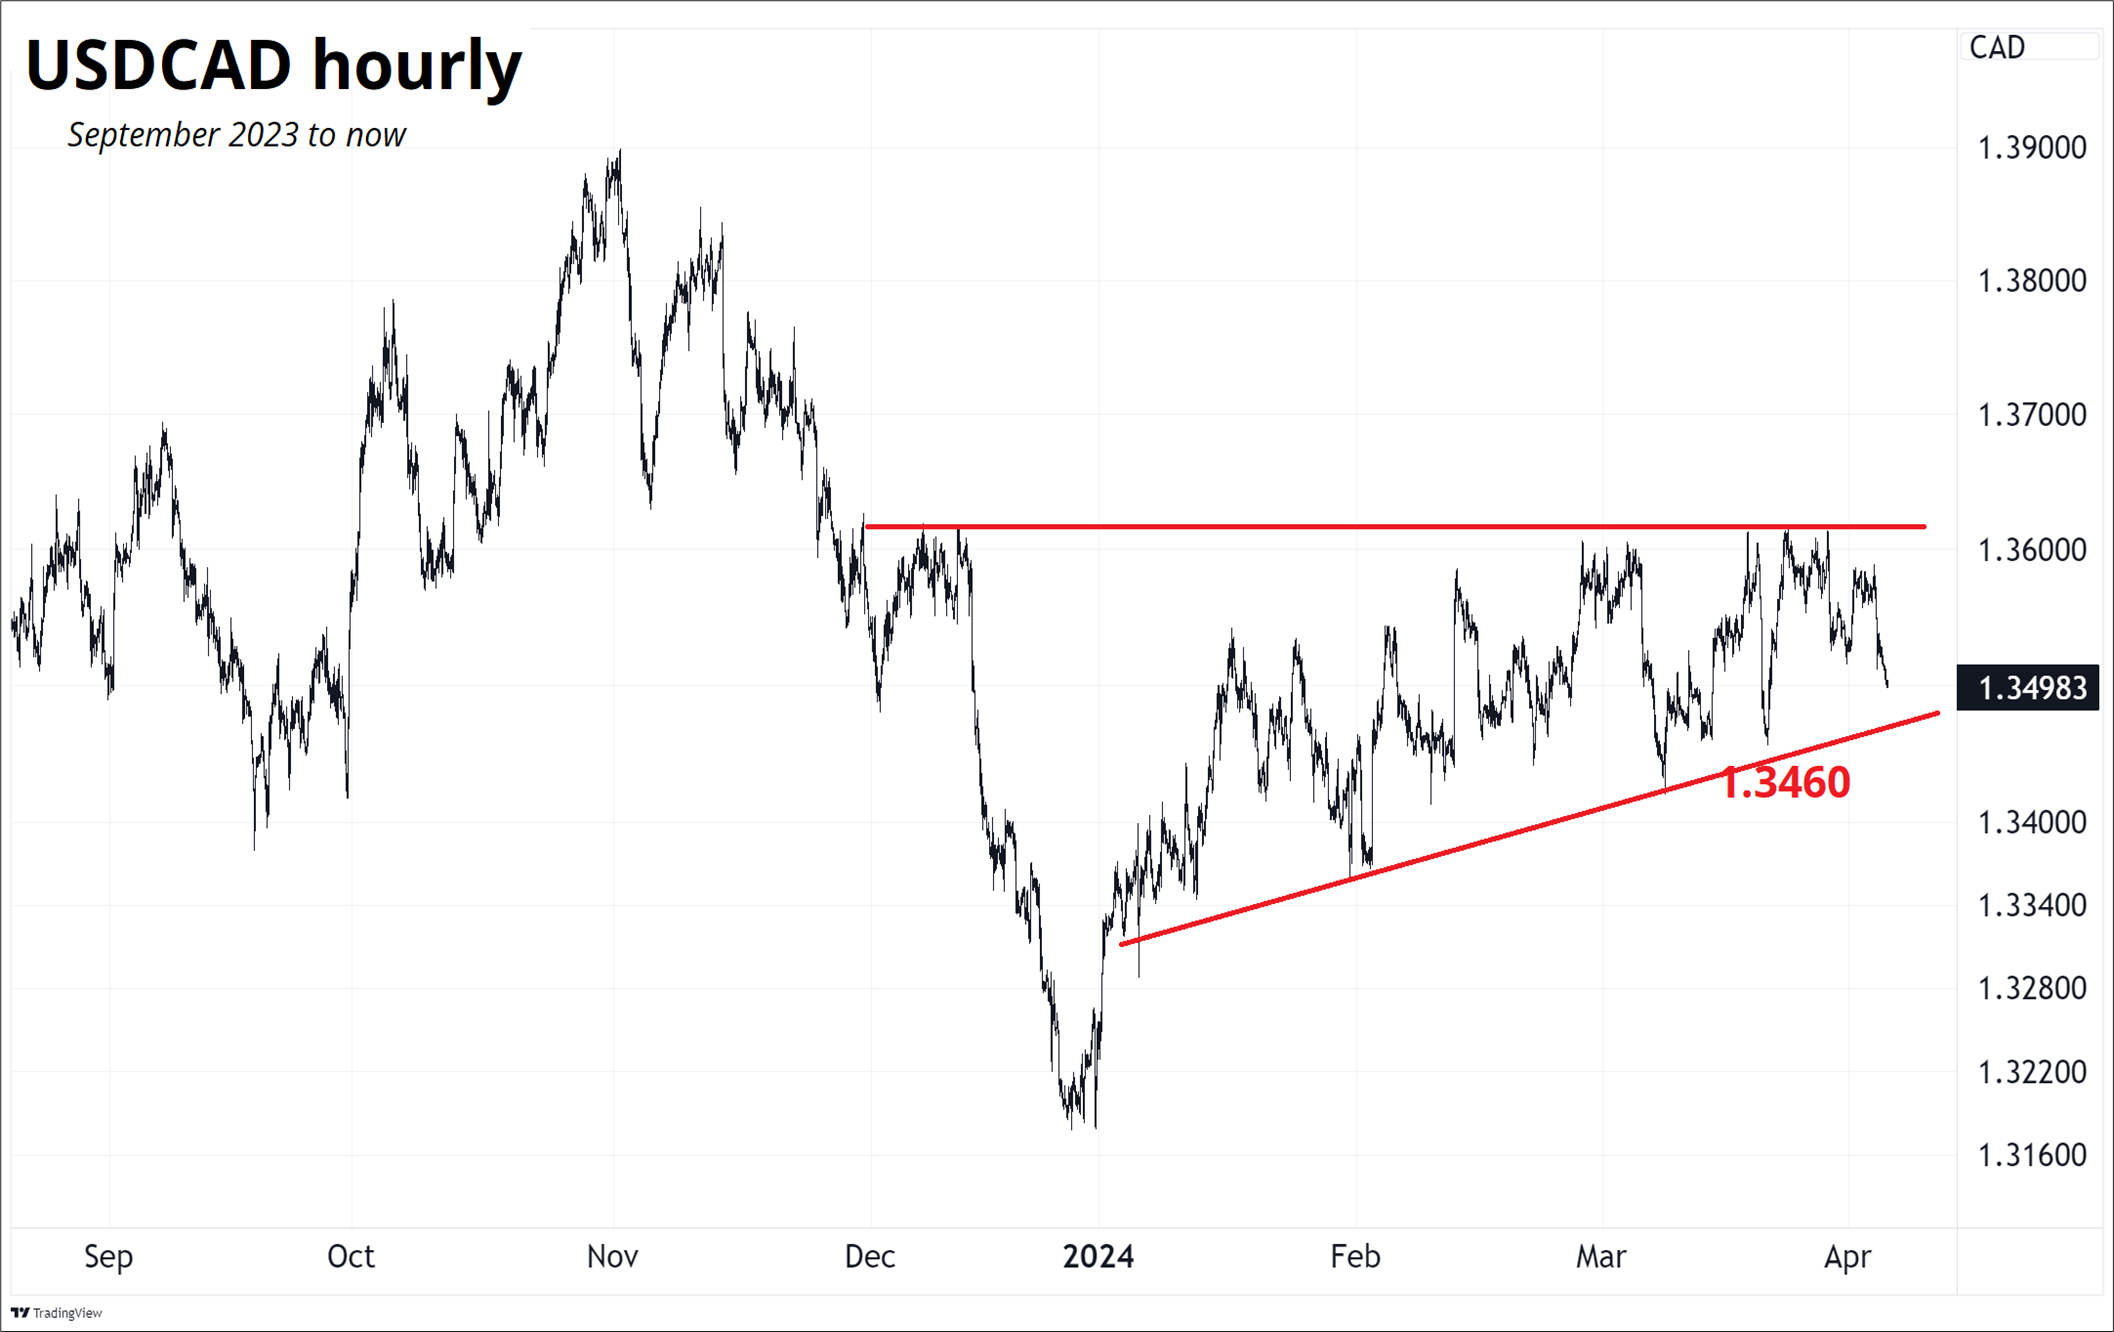
The USDNOK chart is weird but encouraging. In the interest of not allowing these trades to go horribly wrong, I have moved the stop losses significantly tighter (see top bar for all the details).
Final Thoughts
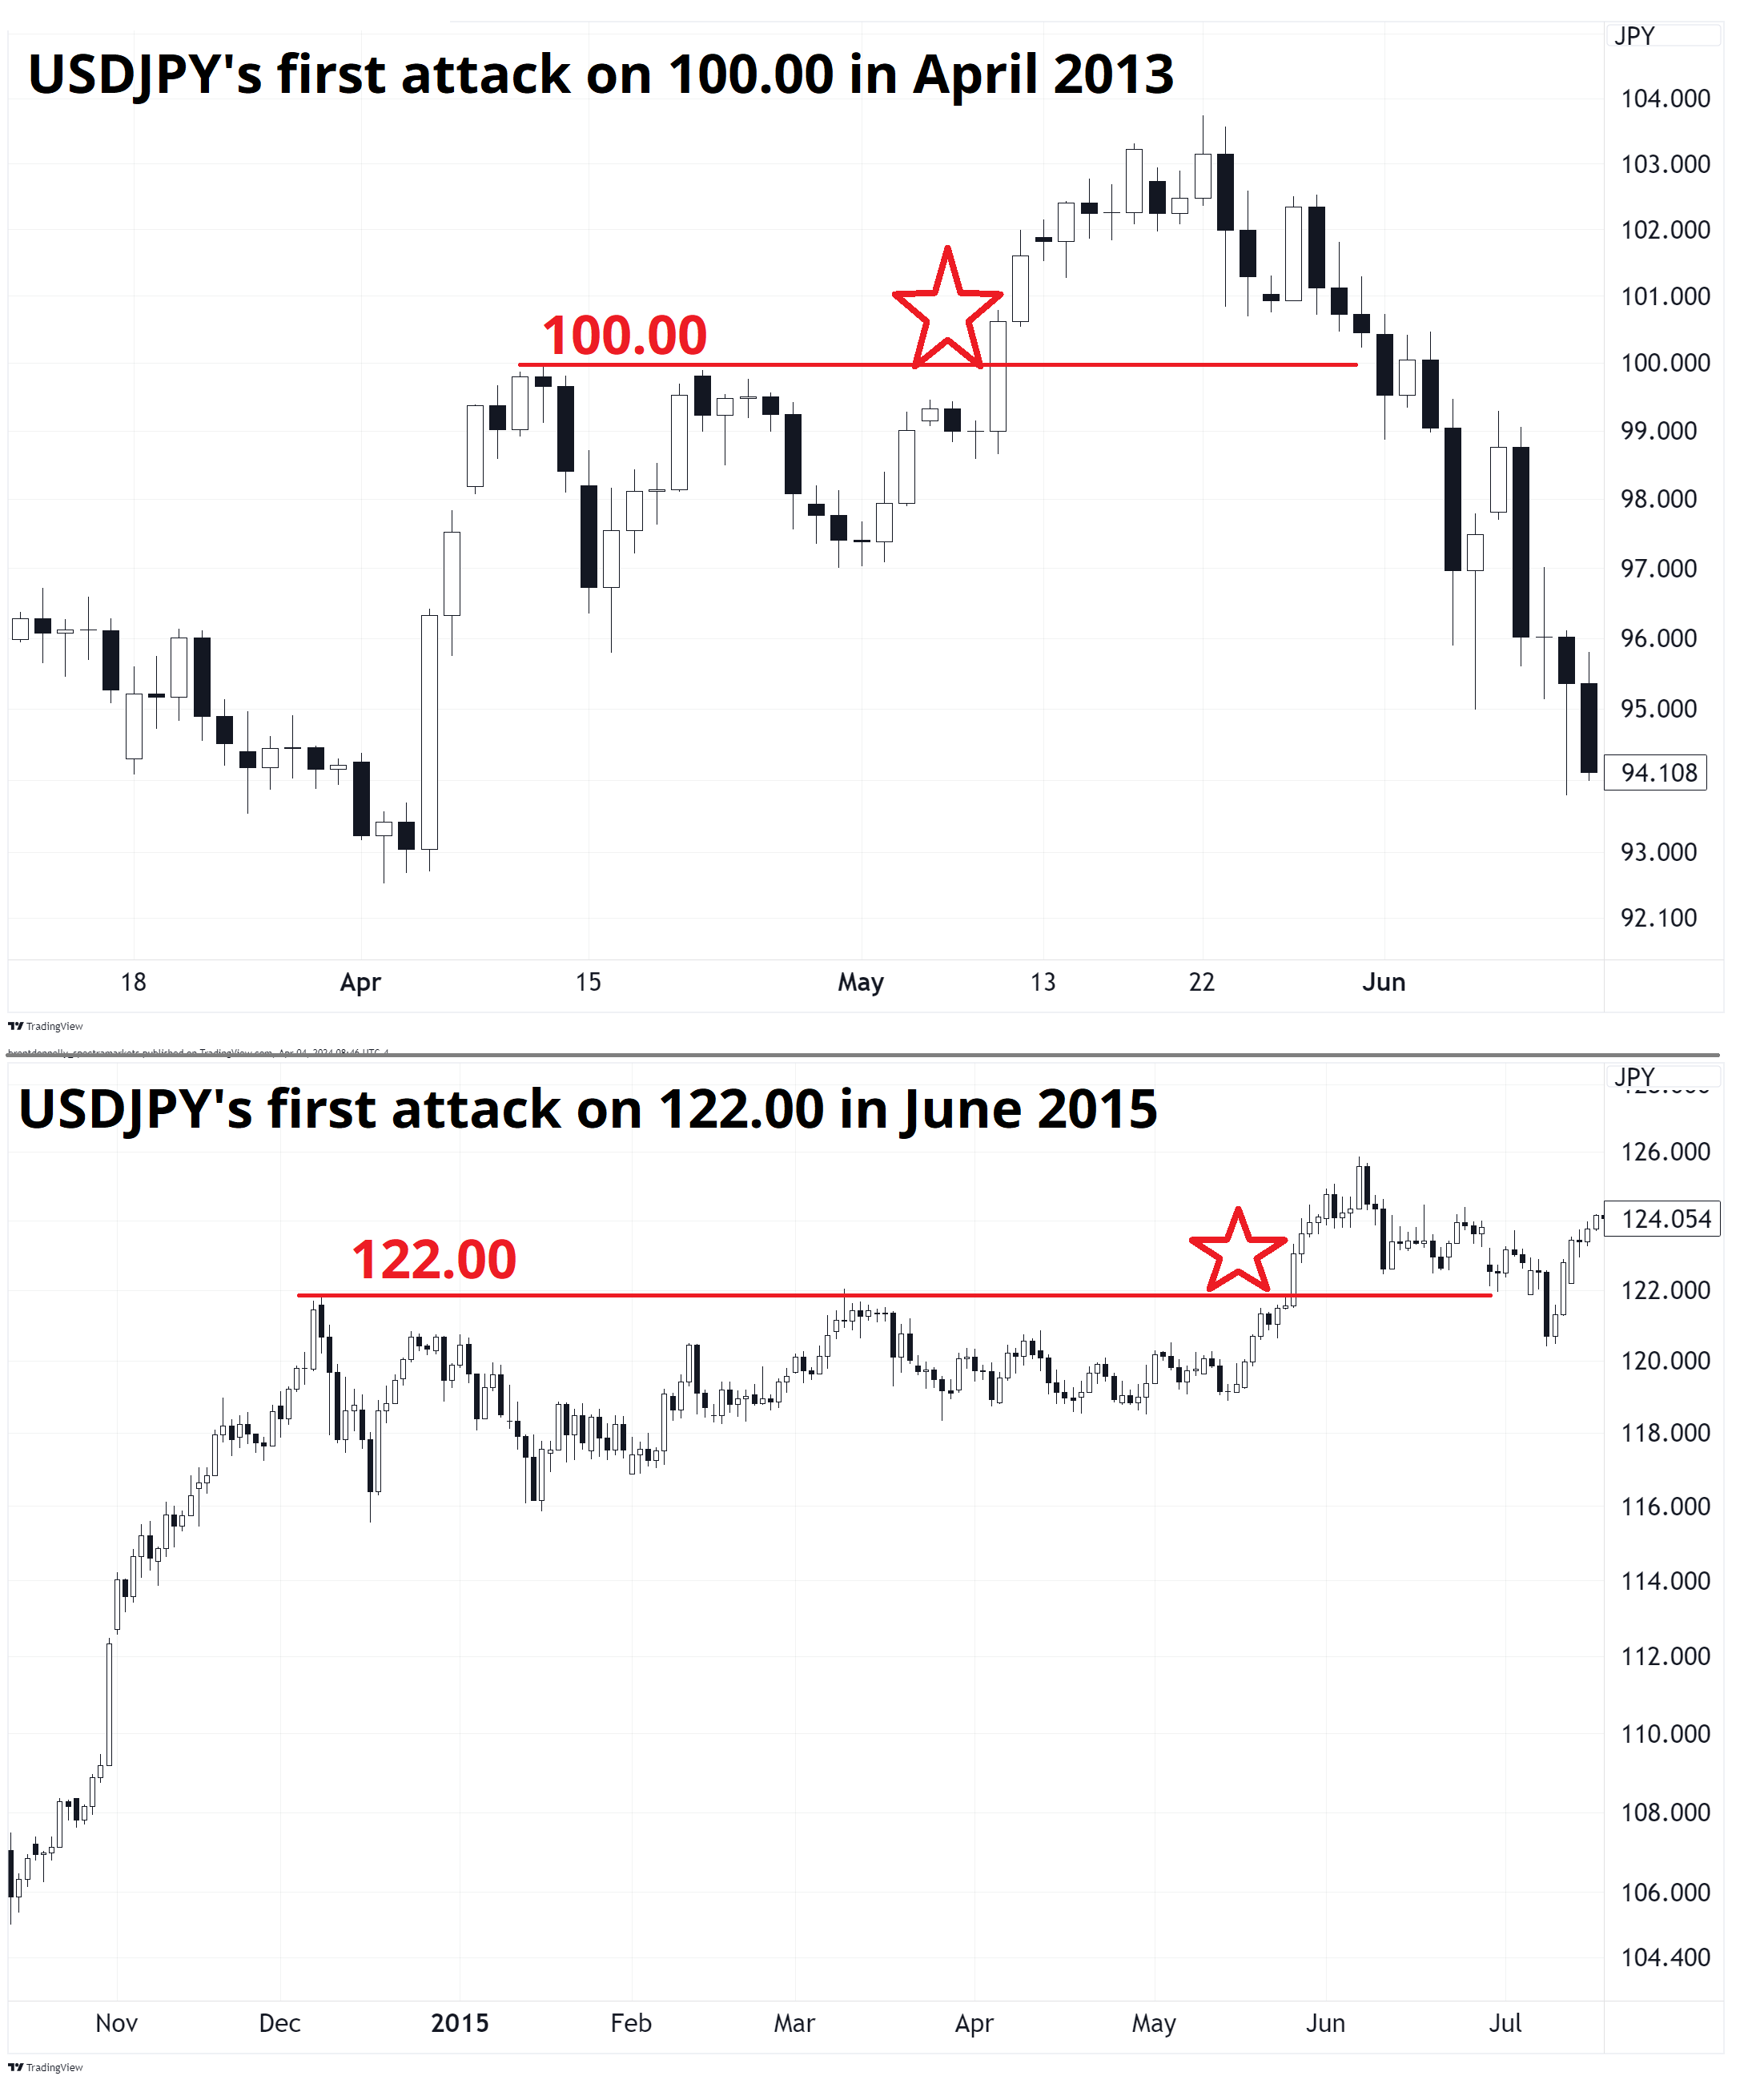
152 USDJPY is a magnet and there seems to be infinity USD to sell ahead of it and infinity USD to buy if it breaks. Fun stuff. It reminds me of the first approaches to 100 and to 122 during Abenomics. Everybody knew that everybody knew that these were huge levels. They both broke explosively, but didn’t hold for too long.
I remember I had a zillion USD of stops through 100.00 that first time. It didn’t print from 99.99 to 100.24. First print was 100.25 and it never retraced. Not fun.
Have an infinitely memorable day.