


A hodge podge is a heterogeneous mixture, often a type of soup that combines many ingredients
You can listen to this episode right here.
Today’s note is 1500 words (7-minute read)
Hodge Podge
Regulation has been the big story of late, but that is getting boring, so let’s talk about something else. Also, a smart reader also pointed out that US regulation is not the supreme variable in the crypto equation given a majority of crypto volumes transact outside the United States. We should not completely obsess over it. Crypto, unlike most other capital markets, is not a US-dominated market. Also, the regulators remain the tortoise in the fable. This could take years.
Today, I cook up a hodge podge of random thoughts and data for your consumption.
Current market view
I have been writing since July 6 or so about a bottoming process in crypto, mostly driven by crypto-specific factors like Merge optimism, the end of forced liquidations, and a flurry of technical bottom signals. Now, the risk is external macro factors come back to cap the topside.
The market has been trying to play a Fed pivot and the narrative was boosted by massively oversold stonks and the recent FOMC meeting where Fed Chair Powell looked pretty chill. The problem is, he accidentally ratified the market narrative of a Fed pivot, something he did not want to do. Now, the Fed is trotting out the talking heads one by one to push back. For example:
*DALY: FED’S WORK ON INFLATION `NOWHERE NEAR ALMOST DONE’
Kashkari Says Fed Still ‘Long Way’ From Backing Off Hikes: NYT
And this Bloomberg editorial by Bill Dudley (ex-NY Fed) which opens with:
Investors have lately become strangely optimistic that the Federal Reserve won’t have to tighten monetary policy much further, bidding up stocks and bonds amid hopes that the Federal Reserve will soon get inflation under control.
This wishful thinking is both unfounded and counterproductive.
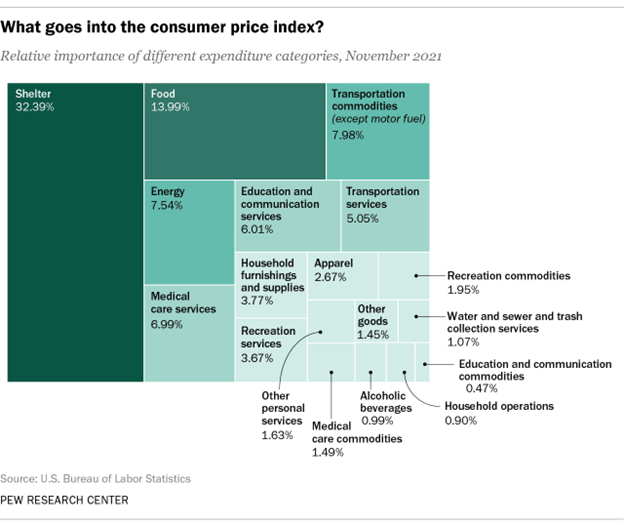
I agree with Dudley! Market pricing of Fed cuts in 2023 is premature. The Fed is following lagging indicators like CPI and the US Unemployment Rate and with inflation still going nuts and several components of CPI likely to be sticky (especially rents), it’s way too early to be thinking about Fed cuts. Remember that rent is more than 30% of the CPI figure:
So, with nothing particularly new in cryptoland and macro still kind of supportive, but not for long … I think we continue to bounce around in the 20000/25000 range, supported by crypto factors, but weighed down by macro now that the short squeeze in stocks looks to have run its course. August 10th remains the key date for the ETH merge, though excitement has calmed from extreme levels already as ETH tried and failed to hold above the key 1700 level.
ETH tried to take out the 1700 pivot, but has not held on
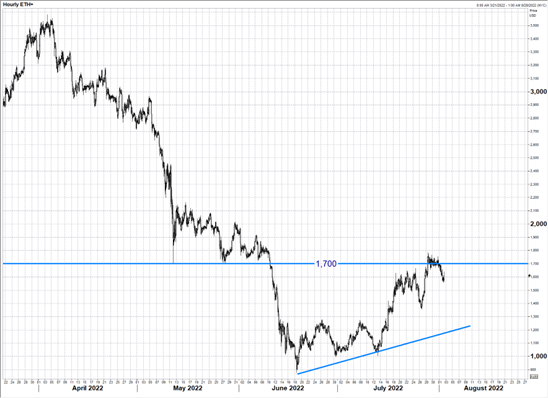
My guess is that ETH stays well-supported into the Merge, still, as there is no reason for anyone to panic here and all Merge-motivated ETH longs are still deep in the money.
A flippening of sorts
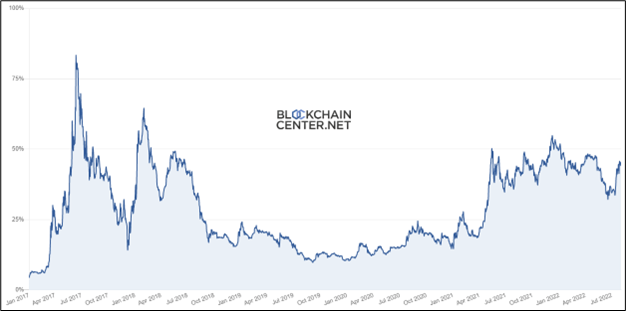
The flippening is the day ETH market cap exceeds BTC market cap. We’re nowhere near there right now. ETH market cap is currently 44% of BTC:
ETH market cap vs. BTC
https://www.blockchaincenter.net/en/flippening/
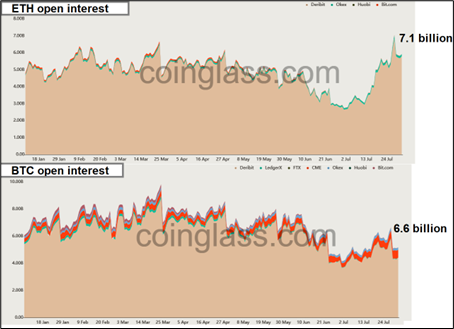
There was a flippening of sorts this week, though, as ETH options open interest now exceeds bitcoin options open interest. This gives you a sense of how excited people are about The Merge, and perhaps how they are positioned.
ETH options open interest (OI) surpasses BTC OI for the first time
https://www.coinglass.com/options
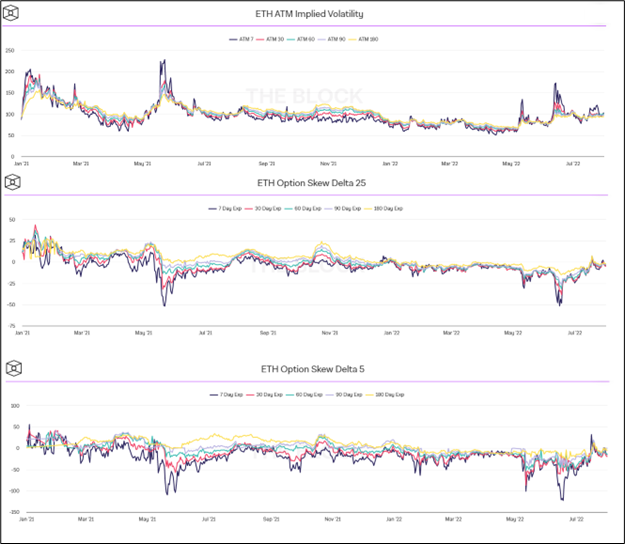
Interestingly, this seems to be a product of a) nobody cares about bitcoin right now and b) people are buying very low delta topside to get max leverage in ETH. You can see this in the following chart (full explanation after the graphic):
https://www.theblock.co/data/crypto-markets/options/eth-option-skew-delta-25
Implied volatility and the skew for 25-delta options didn’t move all that much. It was demand for 5-delta (super far out of the money) calls that dominated as you can see. The 5-delta skew briefly popped near all-time highs. This implies to me that the market is either long spot or long super far out of the money calls. The 30SEP22 $4000 ETH calls are particularly active, for example—that’s about a 5 delta.
Positioning is probably not a huge deal, therefore, and there is plenty of open air from here to 2000 at least. The first real batch of ETH strikes is 2000/2250.
BTC CORR
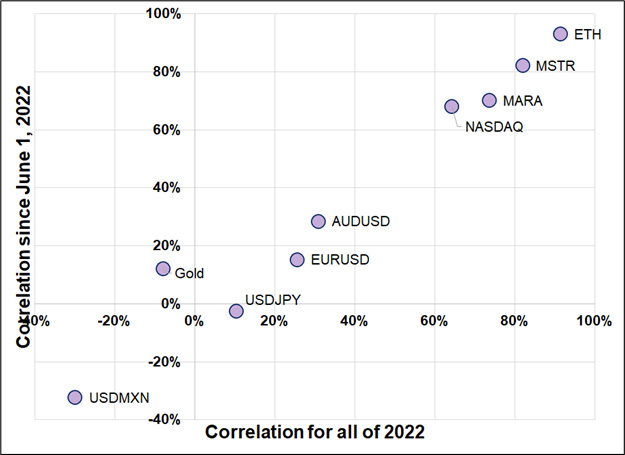
Bitcoin correlations have been pretty steady of late. Here’s how they look this year, and since June 1st. People love to hate MSTR, but it remains an excellent listed BTC proxy.
Relative Strength Index (RSI)
There were a ton of metrics showing that bitcoin was a buy in late June, early July, but for your future reference, none was simpler than the 14-day RSI.
Every trader should have one or two indicators that tell them when their market is extremely oversold or overbought on the time horizon they trade. RSI is a standard indicator most people use, and the textbook strategy is that if it goes above 70, wait for it to fall back below 70 and then sell. I use it differently.
I take as much data as possible and find the extremes in the RSI going back as far as I can. In FX, I calculate the top and bottom 5% most extreme and use these levels as “get out no matter what or maybe fade it” levels. That is, if I’m long, and the RSI gets into the top 5% of the series, I cut longs or go short if I have some other reasons to be bearish.
I find that at the mega RSI extremes, the risk of a reversal is high and the risk-reward on staying in the trend is poor. If I am trying to trade against the trend, I will also use these mega extremes as an entry point to go the other way.
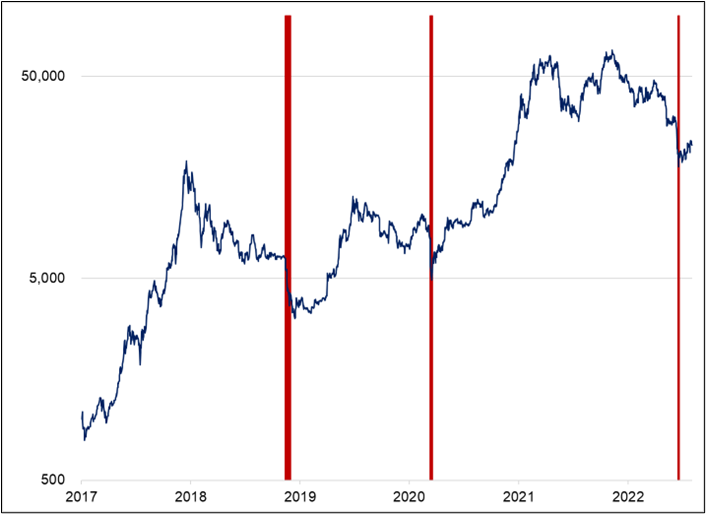
In crypto, things can trend much harder and get much more overbought and oversold than TradFi, so I narrowed the filter for bitcoin to the most extreme 1% of readings. Using this as a buy signal, it’s 3-for-3 in identifying good bottoms, though it got you buying super early in 2018 as it stayed pinned at very low levels. The first RSI buy signal was at 5470 on 15NOV18, and bitcoin finally bottomed in the mid-3000s two weeks later (27NOV18).
This chart shows the three times the RSI dipped into the lowest 1% of the series.
Bitcoin with times RSI was in the bottom 1% on a 5-year lookback
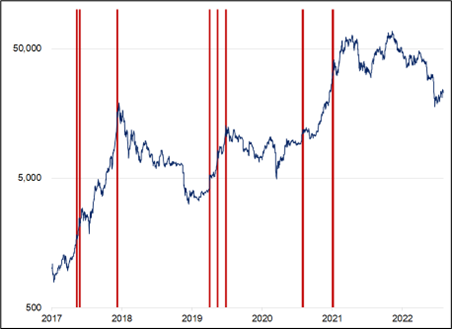
The next chart shows the signal the other way. When RSI was in the top 1% of the series. The signal did not work nearly as well as you can see here:
Bitcoin with times RSI was in the top 1% on a 5-year lookback
Charts and RSI data analysis by Justin Ross, Spectra Markets
This speaks to the raging ragingness of the BTC uptrends in 2017, 2019, and 2021. Still, while bitcoin eventually kept going up in those instances, selling at the RSI mega extremes wasn’t the worst idea in the world, either. Furthermore, as bitcoin matures and becomes more of a Wall Street flow product and less of a new asset / price discovery exercise, my guess is that RSI mega overbought signals will work better in the future.
Next time the 14-day RSI goes below 20 or above 80 in bitcoin, I’ll let you know.
Conclusion
The base still looks decent in crypto, but the topside is capped by Fed / global macro, regulatory uncertainty, and low retail investor confidence. August 10th is the key date for ETH.
The two main ranges to monitor in BTC remain unchanged. Nearby range is 20000/25000 and 18700/28300 on the wide. Don’t even think about shorting ETH unless there’s bad news on The Merge as the path of least resistance there will remain up into the events of 10AUG and 19SEP. Then buy the rumor / sell the fact in September if all goes according to plan.
That’s it! Thanks for reading.
See you next week.
bd