USDJPY is still a rates trade, CNH is moving, gold, and more.
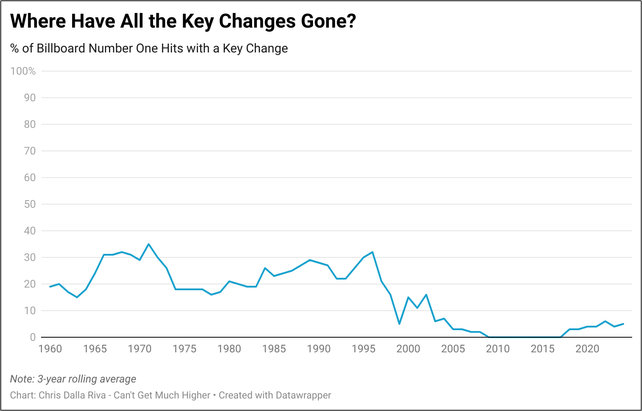
Percentage of Billboard #1 hits with a key change, 1960 to now

USDJPY is still a rates trade, CNH is moving, gold, and more.

Percentage of Billboard #1 hits with a key change, 1960 to now
Long 05JUN USDCNH 7.40/7.60 call spread
29bps off 7.2955 spot
Long GCM5 @ 3036
Stop loss 2964
There is a ton going on and you’re busy, so I will make a bunch of brief points.
First, people are expecting a USDJPY collapse that may never come. I have written about this so many times… Including when BEAR went under in 2008 and the Fed cut rates and stocks rallied and USDJPY went down… USDJPY is a rates trade, not an equity trade. The JPY is not a safe haven, it’s a bond proxy.
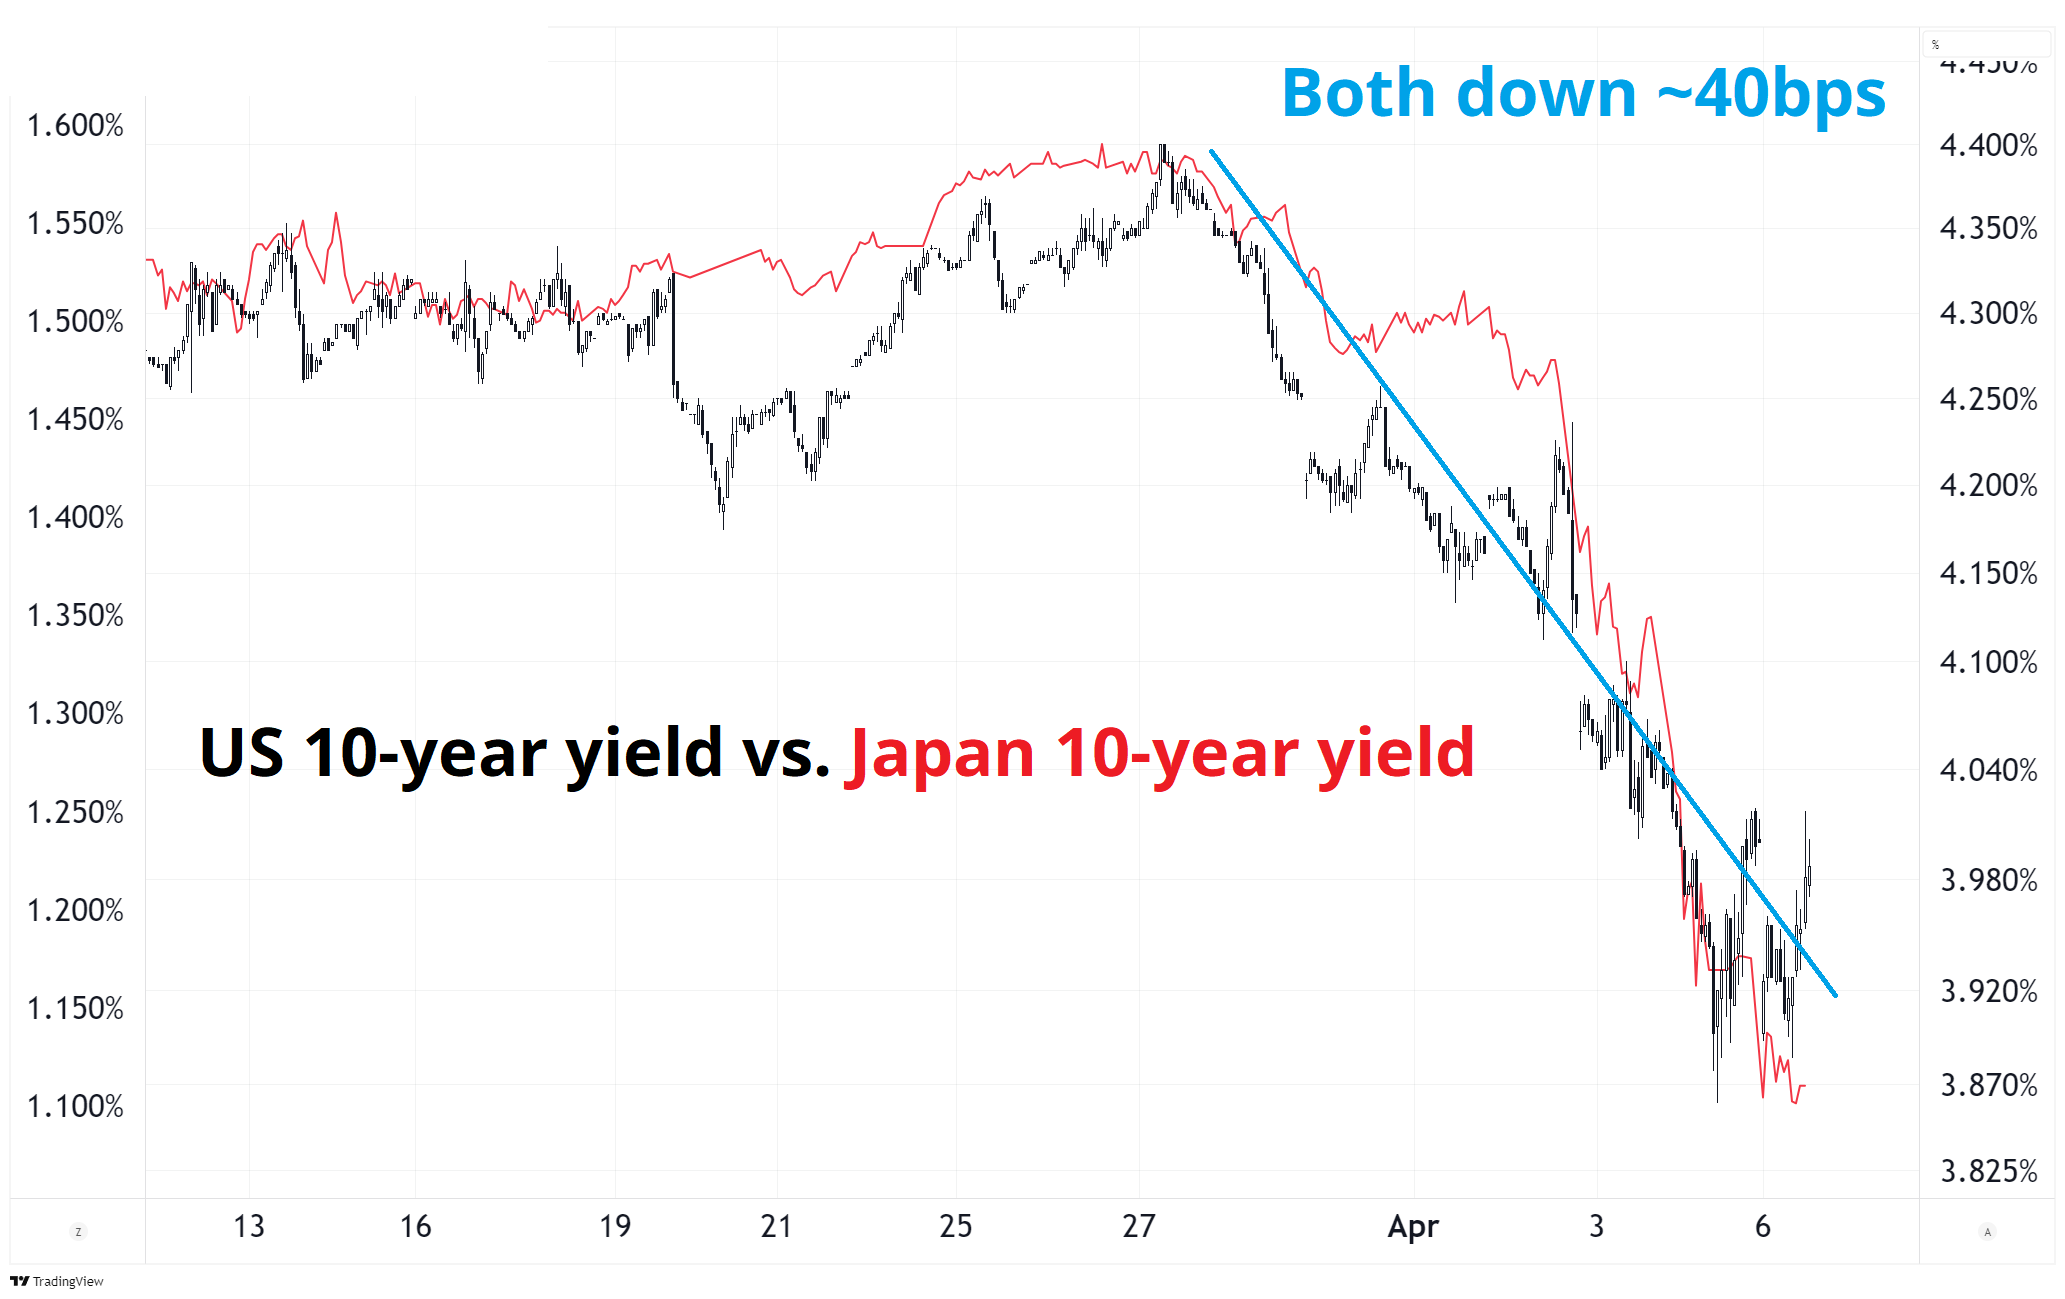
Look at that first chart. US and Japanese bonds are both down the same in yield, but JGB yields are on a one handle and US yields are on a four handle. The fact that US bonds are not rallying today is kind of terrifying. There is no chance that this collapse in confidence and commodities is inflationary, regardless of a one-time price level shock from tariffs. So, the market is souring on UST as a safe haven. Foreign investors no longer trust the US government.
When Japanese yields were zero, the release valve in a crisis was always buy JPY because Japan yields didn’t move, and US yields went down. Now, none of that is true. JGBs can be the release valve because they have a yield and the market is short. For USDJPY to go down, you need a meaningful bond rally and we are not getting one at the moment. I am open to the idea of a sell bonds, sell USD regime imminent as the market bails on US assets, but we’re not there yet.
At some point, this could turn into a Liz Truss situation where the market dumps USD and UST at the same time; it’s a good moment to have a fertile imagination. Short US bonds + long JPY (correctly vol-weighted) would be the trade if that starts to happen.
The Fed tends to react to stock price moves once they hit 20% high to close, approximately. This reaction function was clear as day in 2018/2019 when the Fed pivoted despite no change in the economic data. At some point, they simply react to the tightening of financial conditions and with oil and copper and confidence all in freefall, I doubt they’re too worried about inflation expectations anymore. Here’s 20% drawdowns in SPX vs. Fed Funds.
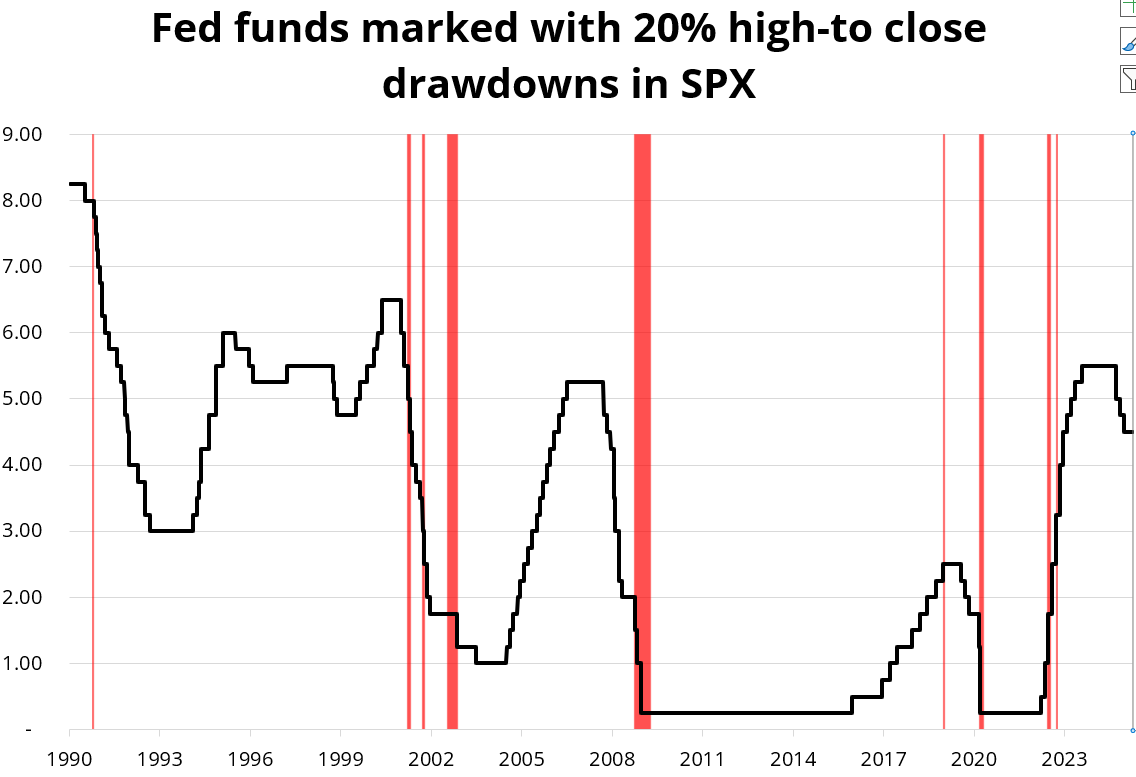
You can see most of the time they are already cutting when the drawdown happens but if they’re not (2018), they will be soon. The big exception to this was 2022 when we had a massive inflation problem. The argument against a quick reaction from the Fed here would be that we still currently have an inflation problem. But forward-looking inflation forecasts are probably coming down fast. The bond market might be signaling that the Fed will wait longer this time, or that Powell has a political agenda and thus will slow-play the cuts to reteach Trump the lesson already learned from Smoot-Hawley.
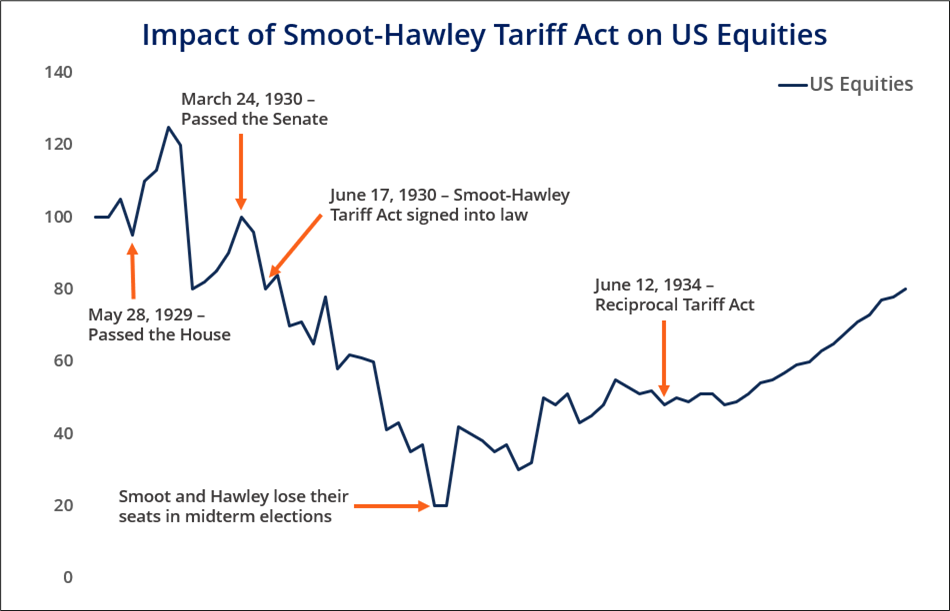
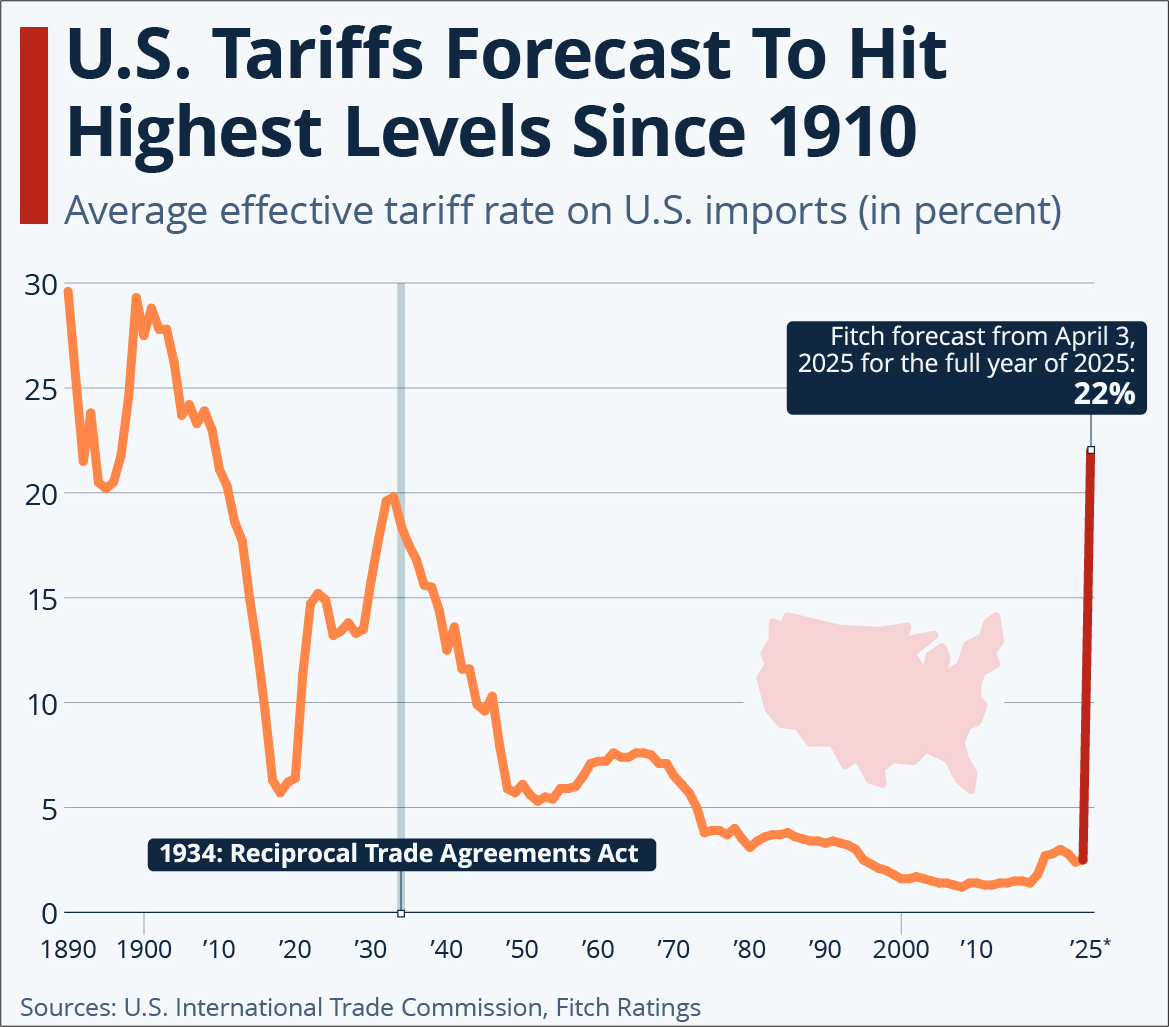
The 100-year cycle is closely rhyming here as we got a global pandemic, roaring 20s and massive retail equity frenzy, then a huge equity-negative tariff bill, just like the 1920s. For reference, the politicians responsible there were out at midterms and the worst of the tariffs were rolled back starting in 1934. Two graphics on this topic.
Related article from Scott Sumner.
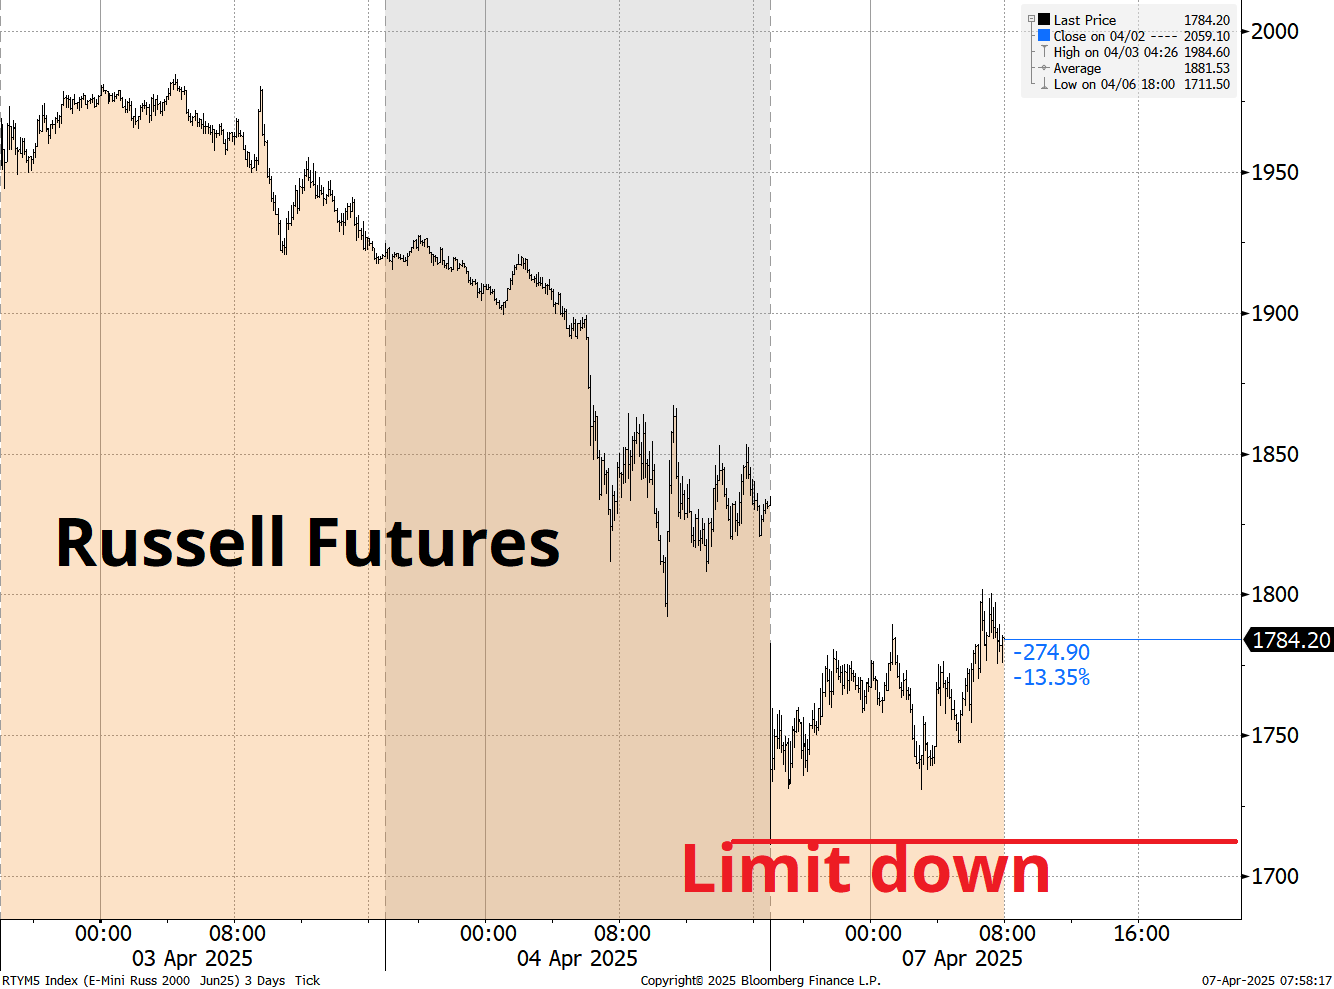
Limit down tends to restore calm, and my experience has been that buying equities when they are limit down almost always makes money as a short-term trade. Russell, Topix, and Nikkei futures hit limit down last night and all ripped higher after. Just something to watch because the only real good entries for long equities will come at the mega extremes, or after Trump backpedals, or the Fed does something. Limit down is the best “megaextreme” indicator you can get and the stoppage in trading tends to lead to cooler heads prevailing.
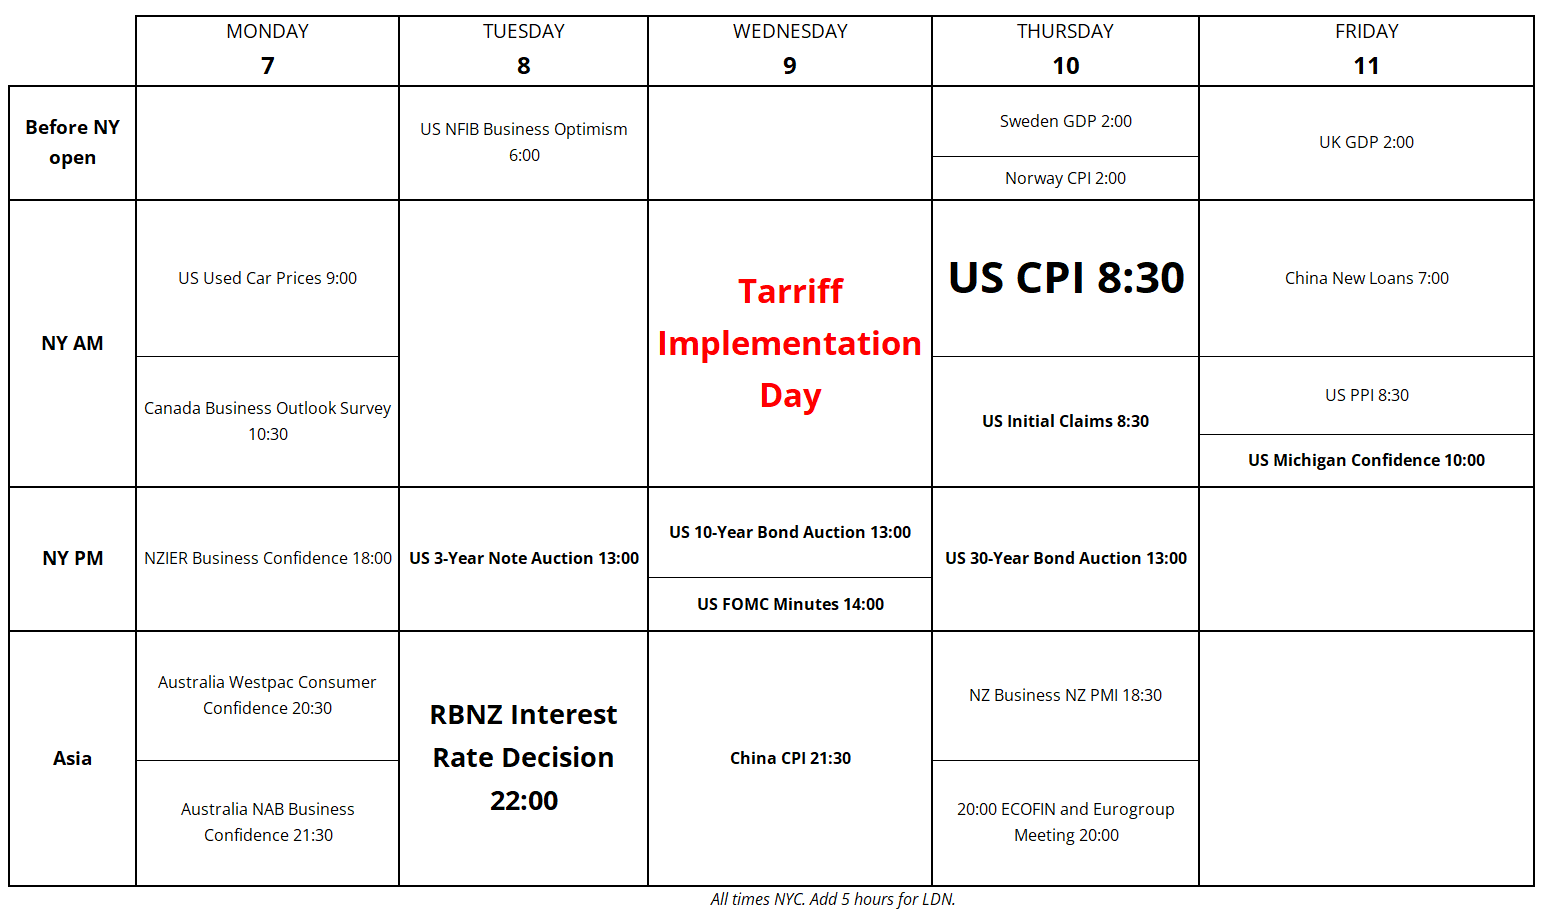
10% tariffs have been enacted on all global trading partners and April 9th is the day the larger tariffs come into force. That is a big day because it’s the point we know the big list of essentially randomly-generated tariff numbers comes into effect. Enactment of that policy will end the idea that this is some kind of bargaining strategy. Here’s this week’s full calendar.
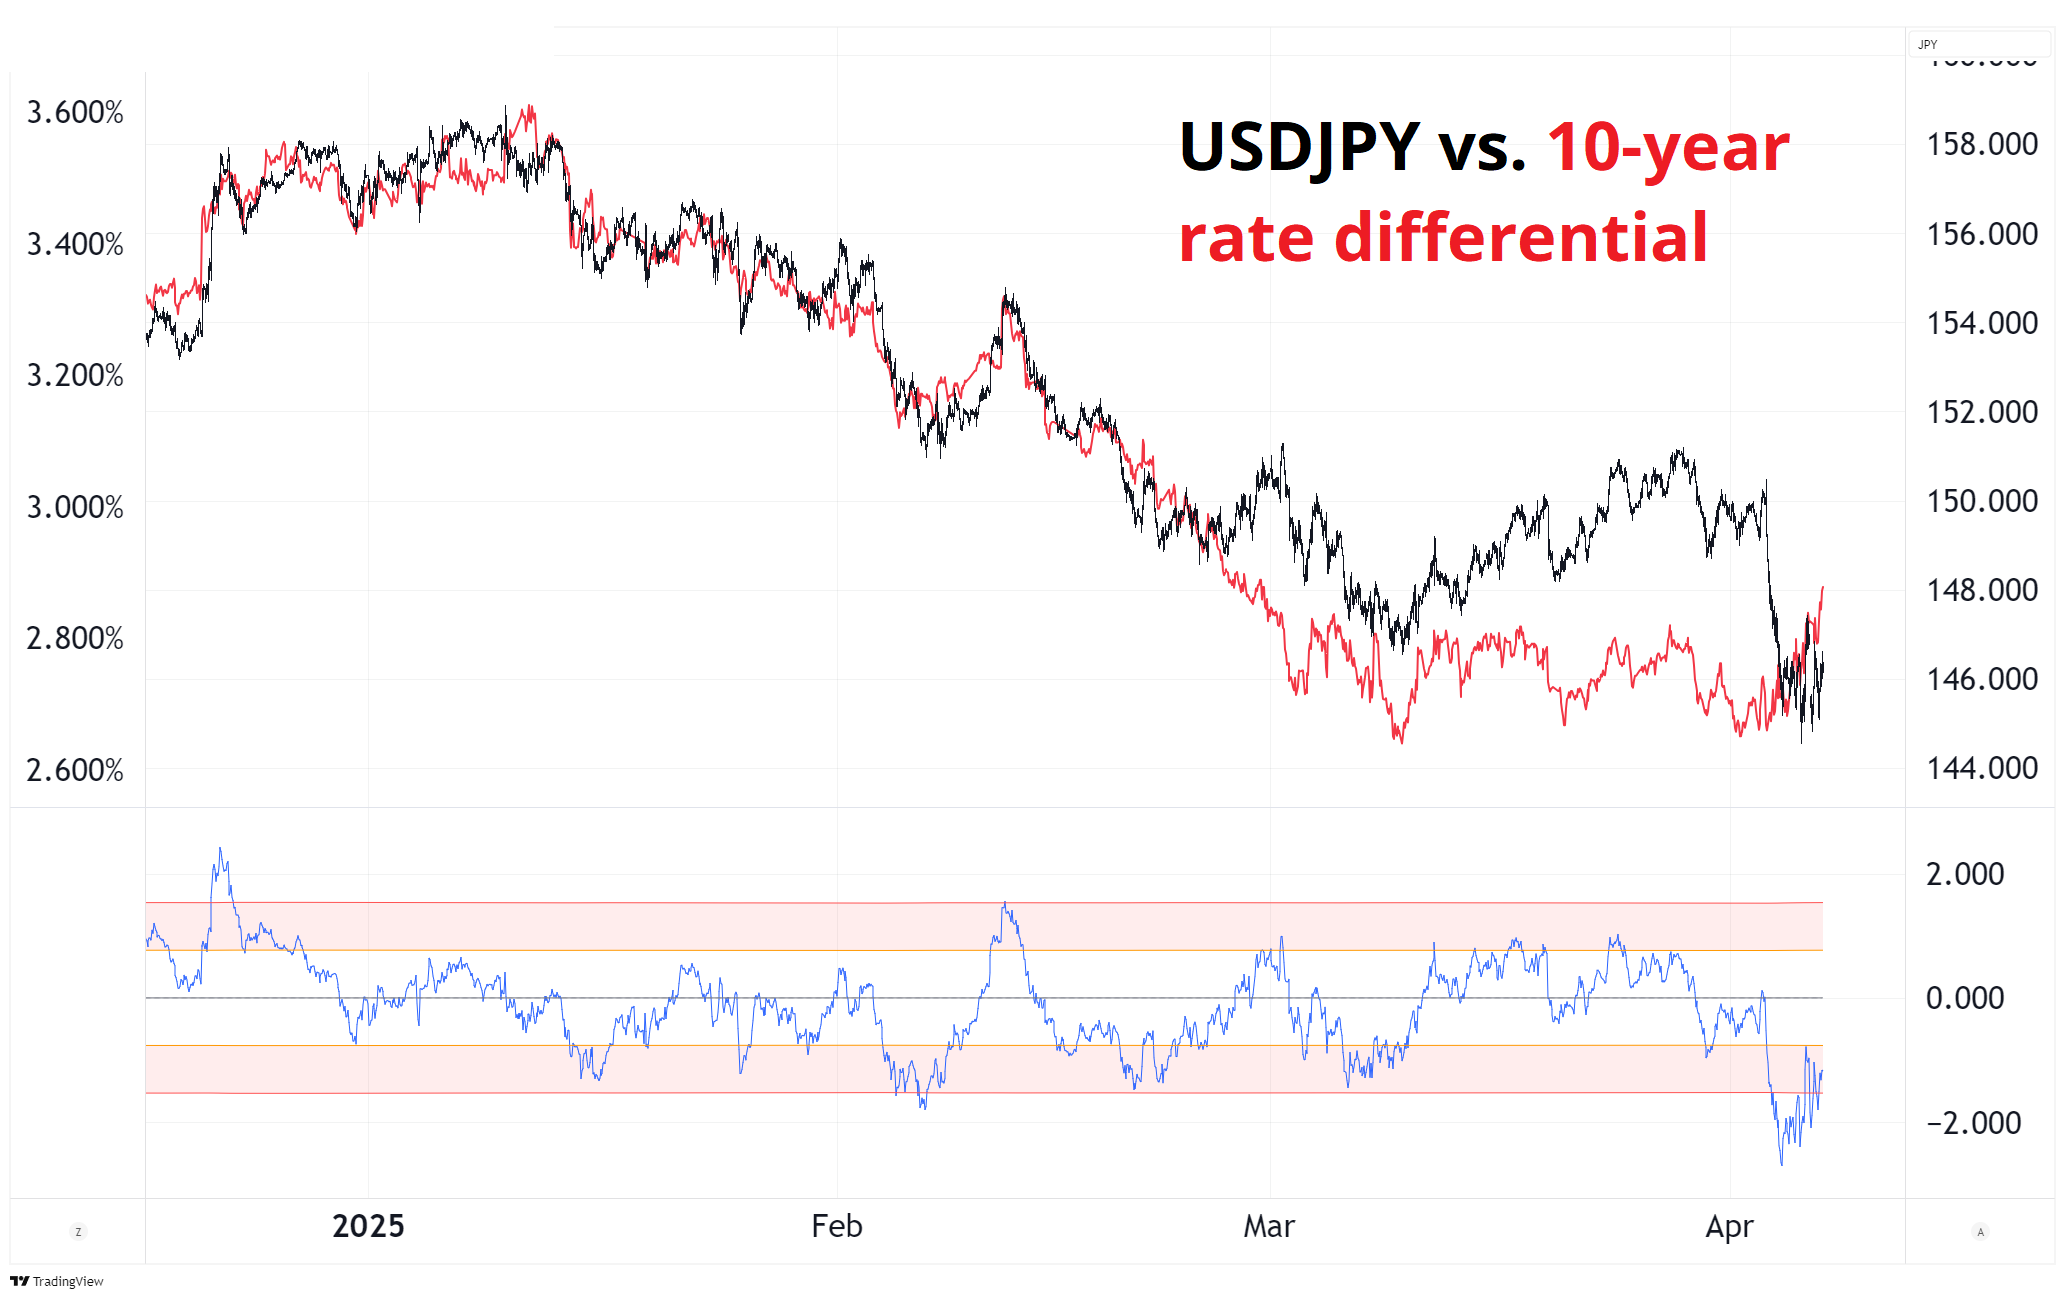
China fixed higher again and the big levels to watch will be 7.2550 in the fix (all-time high) and 7.37 in USDCNH (multiple tops where they intervened and capped it). After months of zero vol, the fix is no longer pegged.

This should keep upward pressure on USDCNH and raises the question of a deval. Will they stabilize things at a higher level, deval gradually, or attempt to methodically move the fix higher to engineer a full-controlled devaluation? It looks like the answer is number 3, but let’s see.
If US Treasuries don’t work as a safe haven, and the US dollar is not safe, what remains? Gold and cash, probably? Gold has been rinsed because the first stage of a liquidity event is to destroy all big positions, but ultimately what is going on is likely to be uber-bullish gold. My guess is that the move lower overnight was the climactic cleanse of levered retail gold longs, and we go to new all-time highs soon. I like long gold here (GCM5 at 3036) with a stop at new lows (2964) and I added it to the sidebar. I have been getting lots of emails that I should put my non-FX trades in the sidebar, so I’ll try to do that.

The chart looks like a slingshot reversal to me. I suppose the real safe haven right now is bunds.
I have added the section on trading crisis markets from Alpha Trader as an appendix to today’s am/FX because it’s highly relevant right now.
From Eric Peters: “The S&P 500 closed Fri at 5,074 and the 12mth forward P/E multiple is around 18x. If earnings estimates decline by 25% in a scenario where the trade war drags out, and the P/E multiple declines to 15x (the low in 2022), then the S&P 500 should trade at 3,171 (which is where it was in in both Dec 2019 and June 2020). In the GFC, earnings fell something like 50%, so if that happened now due to a cascading global recession/depression and the multiple declined to 15, the S&P 500 would trade at 2,114 which would take it back to 2016 levels.”
The German push for the anti-coercion instrument.
Have a major day.
Alpha Trader excerpt
Trading fast markets
In World War 1, there was a famous quote:
“Modern warfare is months of boredom punctuated by moments of extreme terror”.
I would paraphrase here and say modern trading is hours of boredom punctuated by minutes of extreme terror. Things are quiet most of the time but what matters is how you act and react when the guano hits the rotating blades.
Crisis markets can provide the best opportunities for profit and the greatest chance of ruin. Markets can lay dormant for months, then go completely insane. A whole day can go by without excitement, then a headline hits at 4:00PM and everything boots off.
In this section, I discuss fast markets and, more specifically, trading during a crisis or extreme high volatility event. Trading crisis markets and trading idiosyncratic bursts of extreme high volatility involve most of the same skills and concepts.
It is usually easy to identify when a crisis is happening but for simplicity, I would say any time the VIX is above 40, that’s a crisis market. Looking at all days since 1990, the VIX closed above 40 just 2.2% of the time. Here is a chart:
VIX marked with vertical bar any time it closed above 40
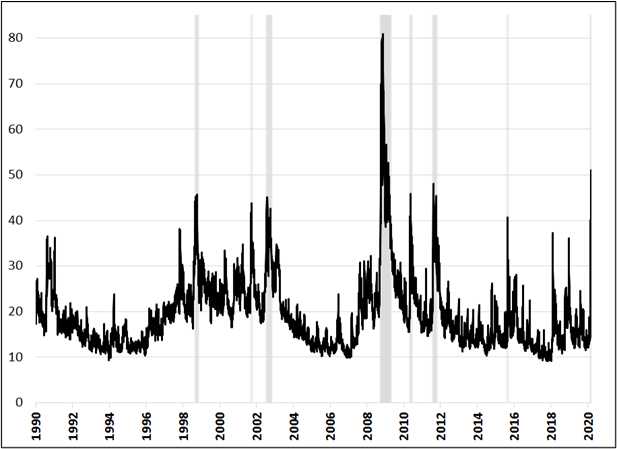
The vertical bars are all famous events in financial market history:
| 1998 | Asian Financial Crisis, Russia Crisis, LTCM meltdown |
| 2001/2002 | September 11 / Dot com bubble burst |
| 2008 | Global Financial Crisis |
| 2010/2011 | Eurozone Crisis |
| 2015 | Energy crisis and China deval |
| 2020 | COVID-19 and Saudi / Russia oil price war |
There is nothing special about the number 40, it’s just a level we rarely see in the VIX.
When markets are in crisis, you need to trade differently. You need to be faster and smarter. The challenge is to be both more careful and more courageous at the same time. That is hard to balance! Fast markets are scary, but they are the best times to make money, and to truly excel at trading you need to crush fast markets.
Here are some tips to help you trade fast markets:
I remember as volatility went to the moon in 2008, I changed my normal trade size in USDMXN from 20 million to 3 million and I was still amazed (scared) by the volatility of my P&L. If you can size dynamically using forward-looking estimates of volatility, that is ideal. Look at what options markets are pricing for 1-week volatility. If you can’t do that, look at the average daily range over the past 5, 10 or 20 days.
As a rough logic check: for day traders, your stop loss should rarely or never be closer than within 1/3 of a day’s range. For swing traders, use one full day’s range. In other words, if you are trading Apple common stock and the average daily range over the past 5, 10 and 20 days is $25: day traders’ stops should be $8 or more away from the entry point and swing traders stops should be at least $25 away from entry. This should be a good starting point in most markets.
If you are getting stopped out and chopped up every day, your stops are too tight. A smaller position with a wider stop is necessary in crisis markets but you need to be mindful that you don’t get so small that you are trading meaningless positions that won’t move the needle on your P&L. Yes, a lot of traders get blown up in a crisis, but a lot just hide under the desk and reveal they are fundamentally risk-averse actors who are not really fit to trade moving markets.
Striking the balance between too big and too small is vital in trading and that balance can be the difference between crushing a crisis period or getting crushed by it.
Most risky asset sell-offs are routine affairs that should be traded using sentiment and overbought and oversold signals. When you see put/call ratios or the Greed & Fear Index or DSI or whatever positioning indicators flashing a reversal signal, it is normally time to pounce. But in a real economic or financial crisis, these signals are useless.
For example, there is a simple metric I use to calculate overbought and oversold which I call The Deviation, as discussed in Chapter 10. It measures the difference between the current price of an asset and the 100-HOUR moving average. As The Deviation gets to prior extremes, it can give a nice mean reversion signal. Here is an example using EURUSD:
EURUSD (top, black) vs. deviation from the 100-hour MA (gray, bottom)
September 2019 to January 2020
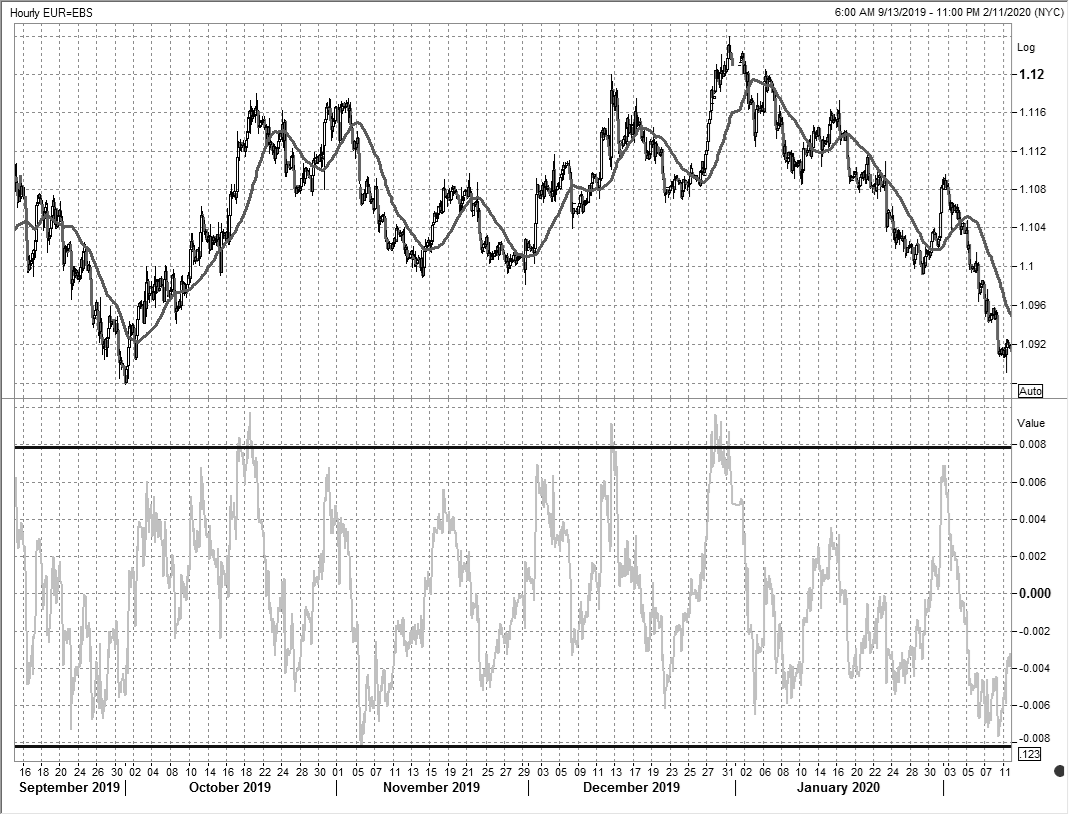
You can see that The Deviation (the gray line in the bottom panel) oscillated consistently between -80 pips and +80 pips over the course of five months and the overbought and oversold readings offered up some decent reversal trades. Then, the COVID-19 crisis hit and all hell broke loose. Now look at the same chart, adding February 2020:
EURUSD (top, black) vs. deviation from the 100-hour MA (gray, bottom)
September 2019 to January 2020
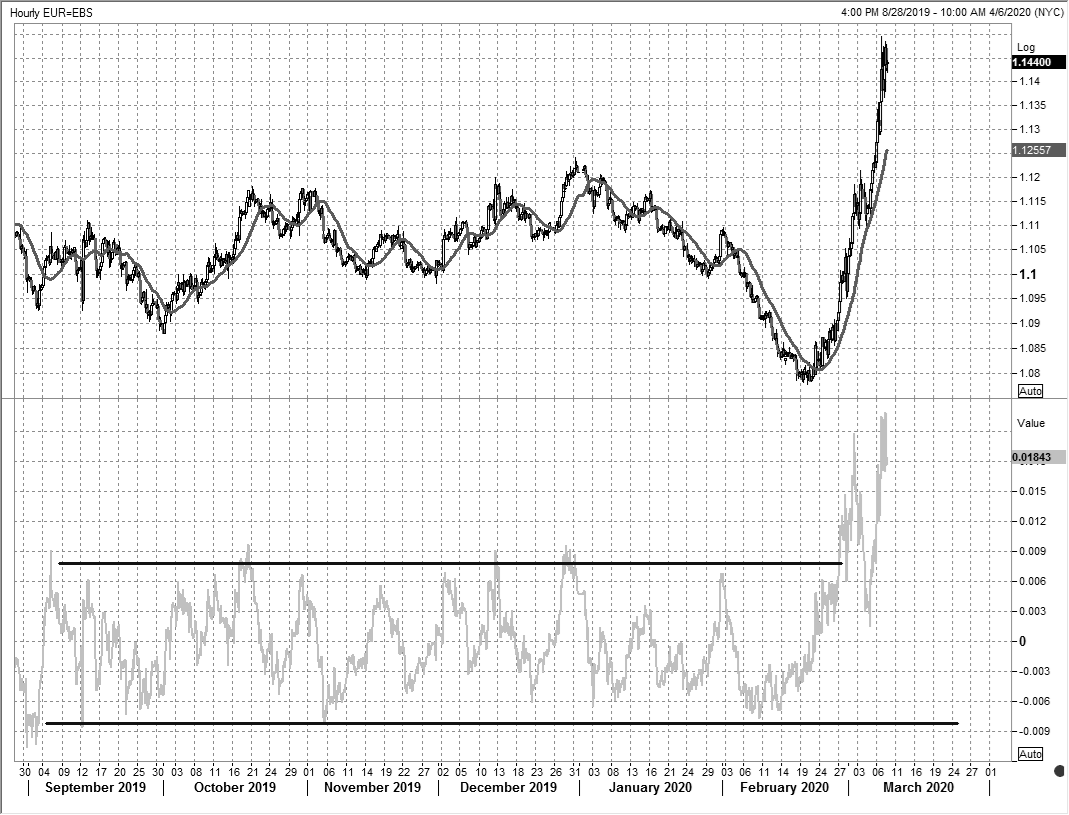
Chart courtesy of Refinitiv
As the crisis hit, the old measures of oversold were blown away as EURUSD ripped higher.
By the time the 2008/2009 Global Financial Crisis was over, careers were made and lost. Some of those lost were not people that blew up but just traders that sat there doing nothing while their peers extracted insane P&L out of thin air. Most of my best trading memories are from crisis periods because these periods deliver fast, volatile, and exciting markets.
Like any high stress profession (pro sports, jet fighter pilot, professional poker…), it all comes down to how you respond in the periods of extreme stress. Don’t be shy, get involved.
Recognize when your product transitions from normal trading to a fast market and adjust your position size and trading strategies accordingly.
end of Alpha Trader excerpt
