It’s difficult, but not impossible to imagine the bullish scenario for 2023. Today is my best effort to present the alternative hypothesis to the consensus bearish view on the US economy and stocks. It’s still not my base case, but I am keeping an open mind.
highlights
am/FX: Optimism Feels Crazy Right Now

December 21, 2022
Optimism feels crazy right now
The bearish case for equities is clear and universally understood. We are entering a big recession, earnings estimates haven’t reflected that, bonds are a great alternative to stocks for the first time in ages, and consumers are tapped out and about to get jammed by higher interest rates. If it’s that obvious, I think I better try to think about the alternative scenario. Here are five reasons the bear consensus could be wrong.
First of all, the basic stats always lean bullish stocks because of the positive drift. It is extremely rare for stocks to go down two years in a row and returns after down years are much higher than returns after up years.
After a down year, average SPX return is 9.9% vs. 6.3% after an up year. After a down year, the next year is up 70% of the time vs. 65% chance after an up year. The stats are even more skewed for 60/40. It is almost unheard of for 60/40 to be down two years in a row, even including the 1970s.
So, what you need for stocks lower in 2023 is something that looks like 2001 or 1974, where a protracted bear market takes over. As mentioned, this is highly possible given the rapid rate hikes. There are plenty of similarities to 1974 and 2001 here. So, I’m not ruling it out, I’m just trying to be open minded because the bear scenario is clear and obvious while the bull scenario requires a bit more depth of thinking for me. For an excellent read from someone who was managing money through 1973/1974, check out David Kotok’s commentary here. He’s in a similarly open-minded kind of mood.
The second point to make on the bullish side is that inflation is coming down rapidly and gas prices in particular are providing stimulus to the consumer in a partial offset to high rates. Here is how the S&P does when gas prices have dropped 15% or more over two months. I would note that the reasons for the fall in gas prices now could be construed as more bullish than usual as they reflect a relief on the supply side in combination with demand destruction whereas past drops in gas prices were almost exclusively a sign of falling global demand. Drops in gas prices often coincide with the end of bear moves.
SPX marked with times when gas prices down 15% or more in 60 days
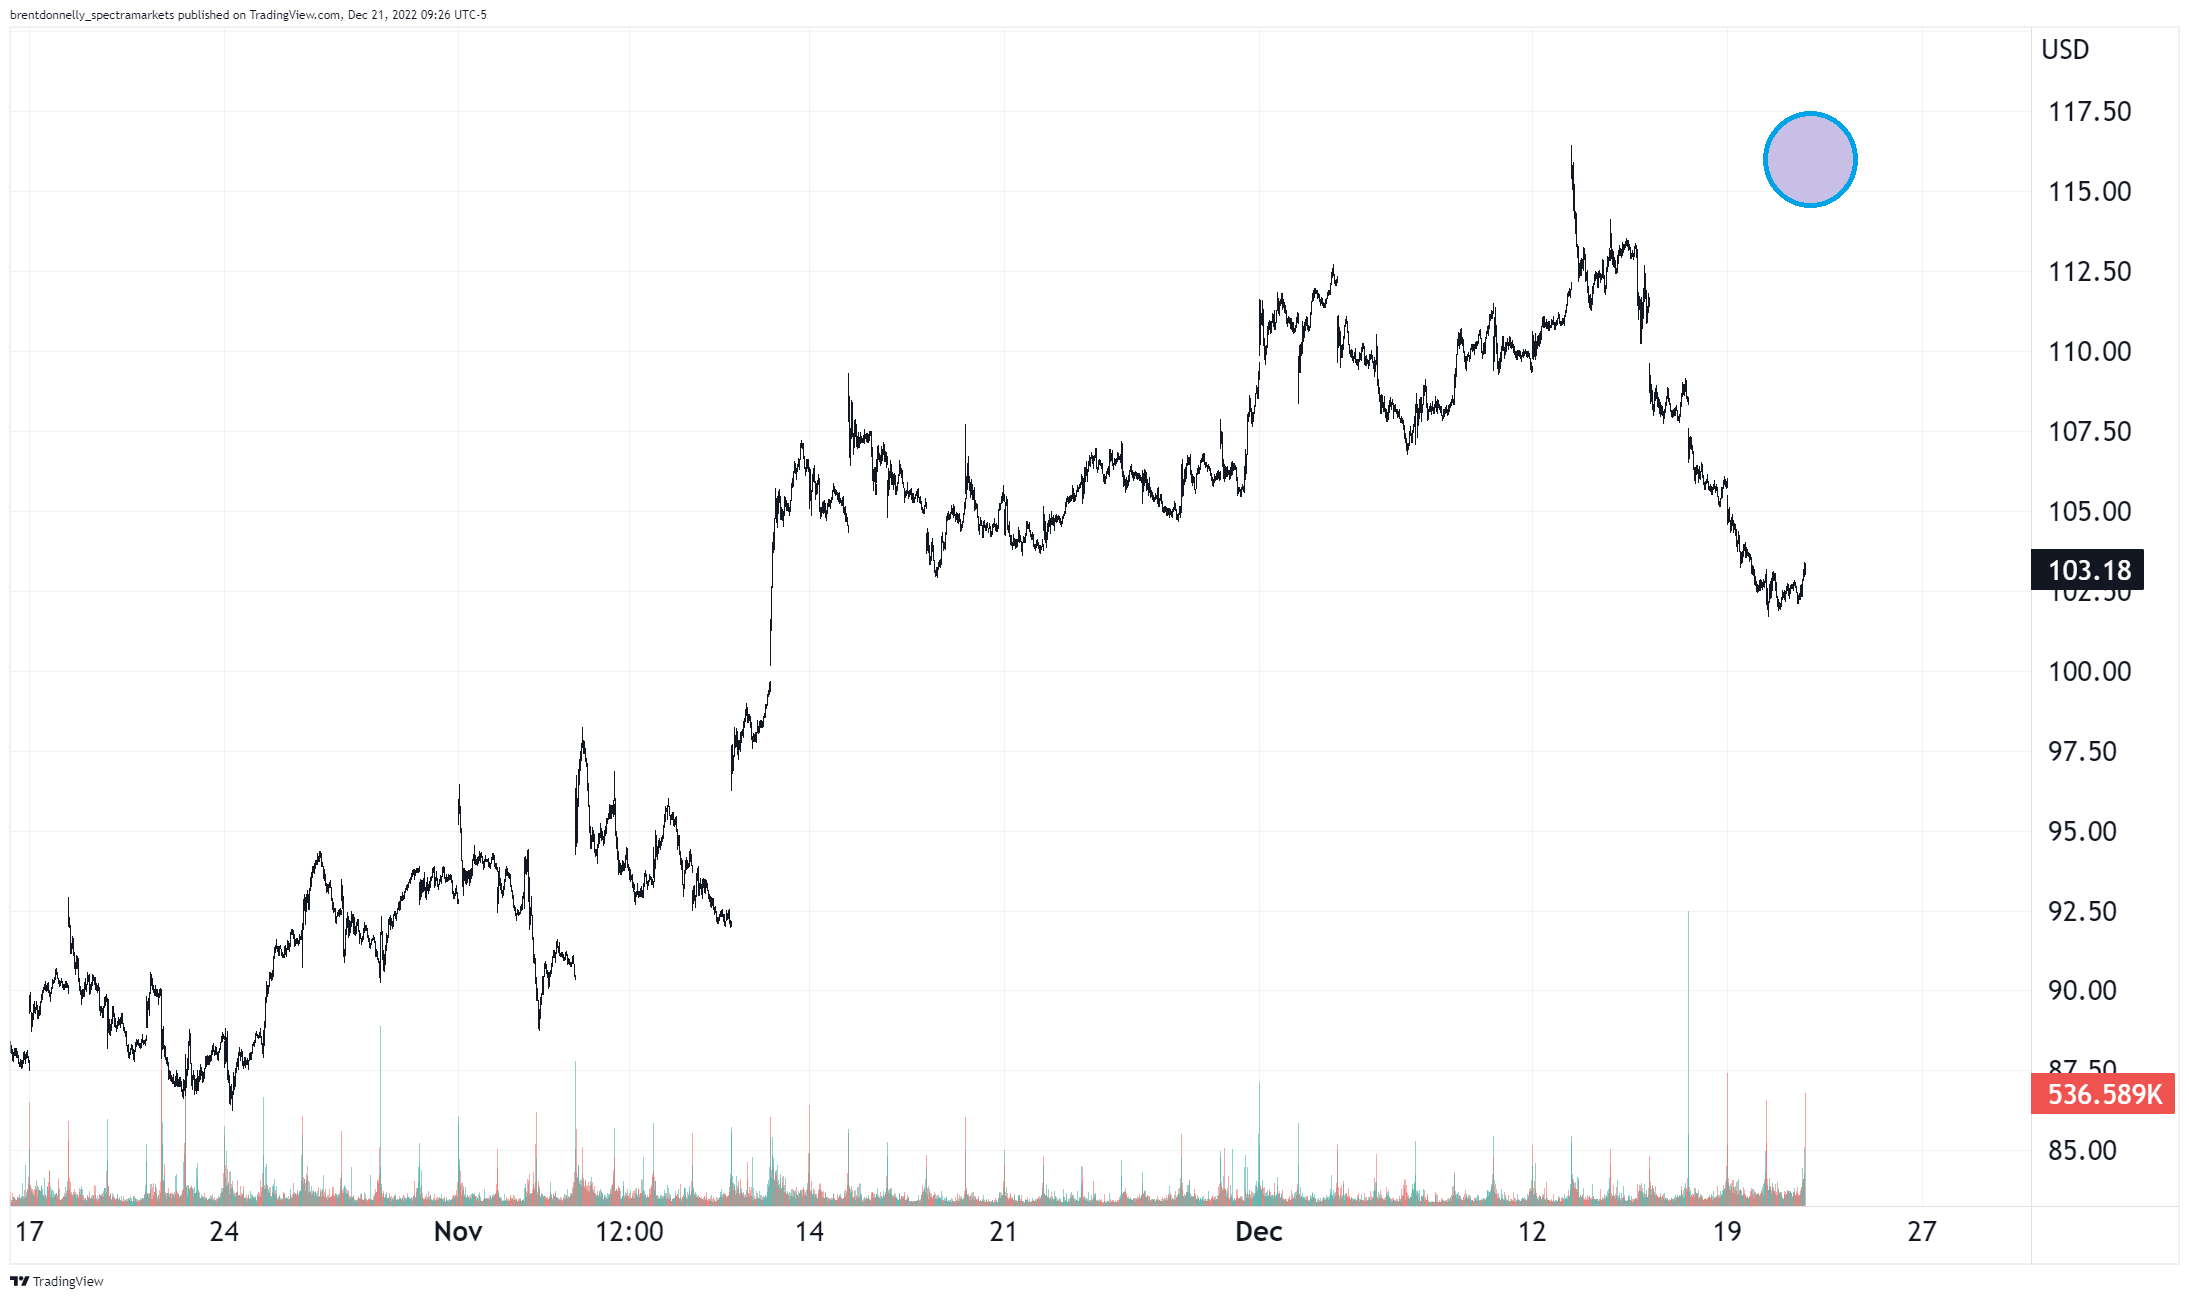
A third bullish point is that the froth has come off the stock market in a serious way. At the start of 2001, stocks had not come anywhere close to fully unwinding the bubble move. This time, it depends where you look, but if you consider the bubble was in WFH and disruption, most of those stocks have already done a full round trip. Here is Amazon, for example:
AMZN, 2018 to now
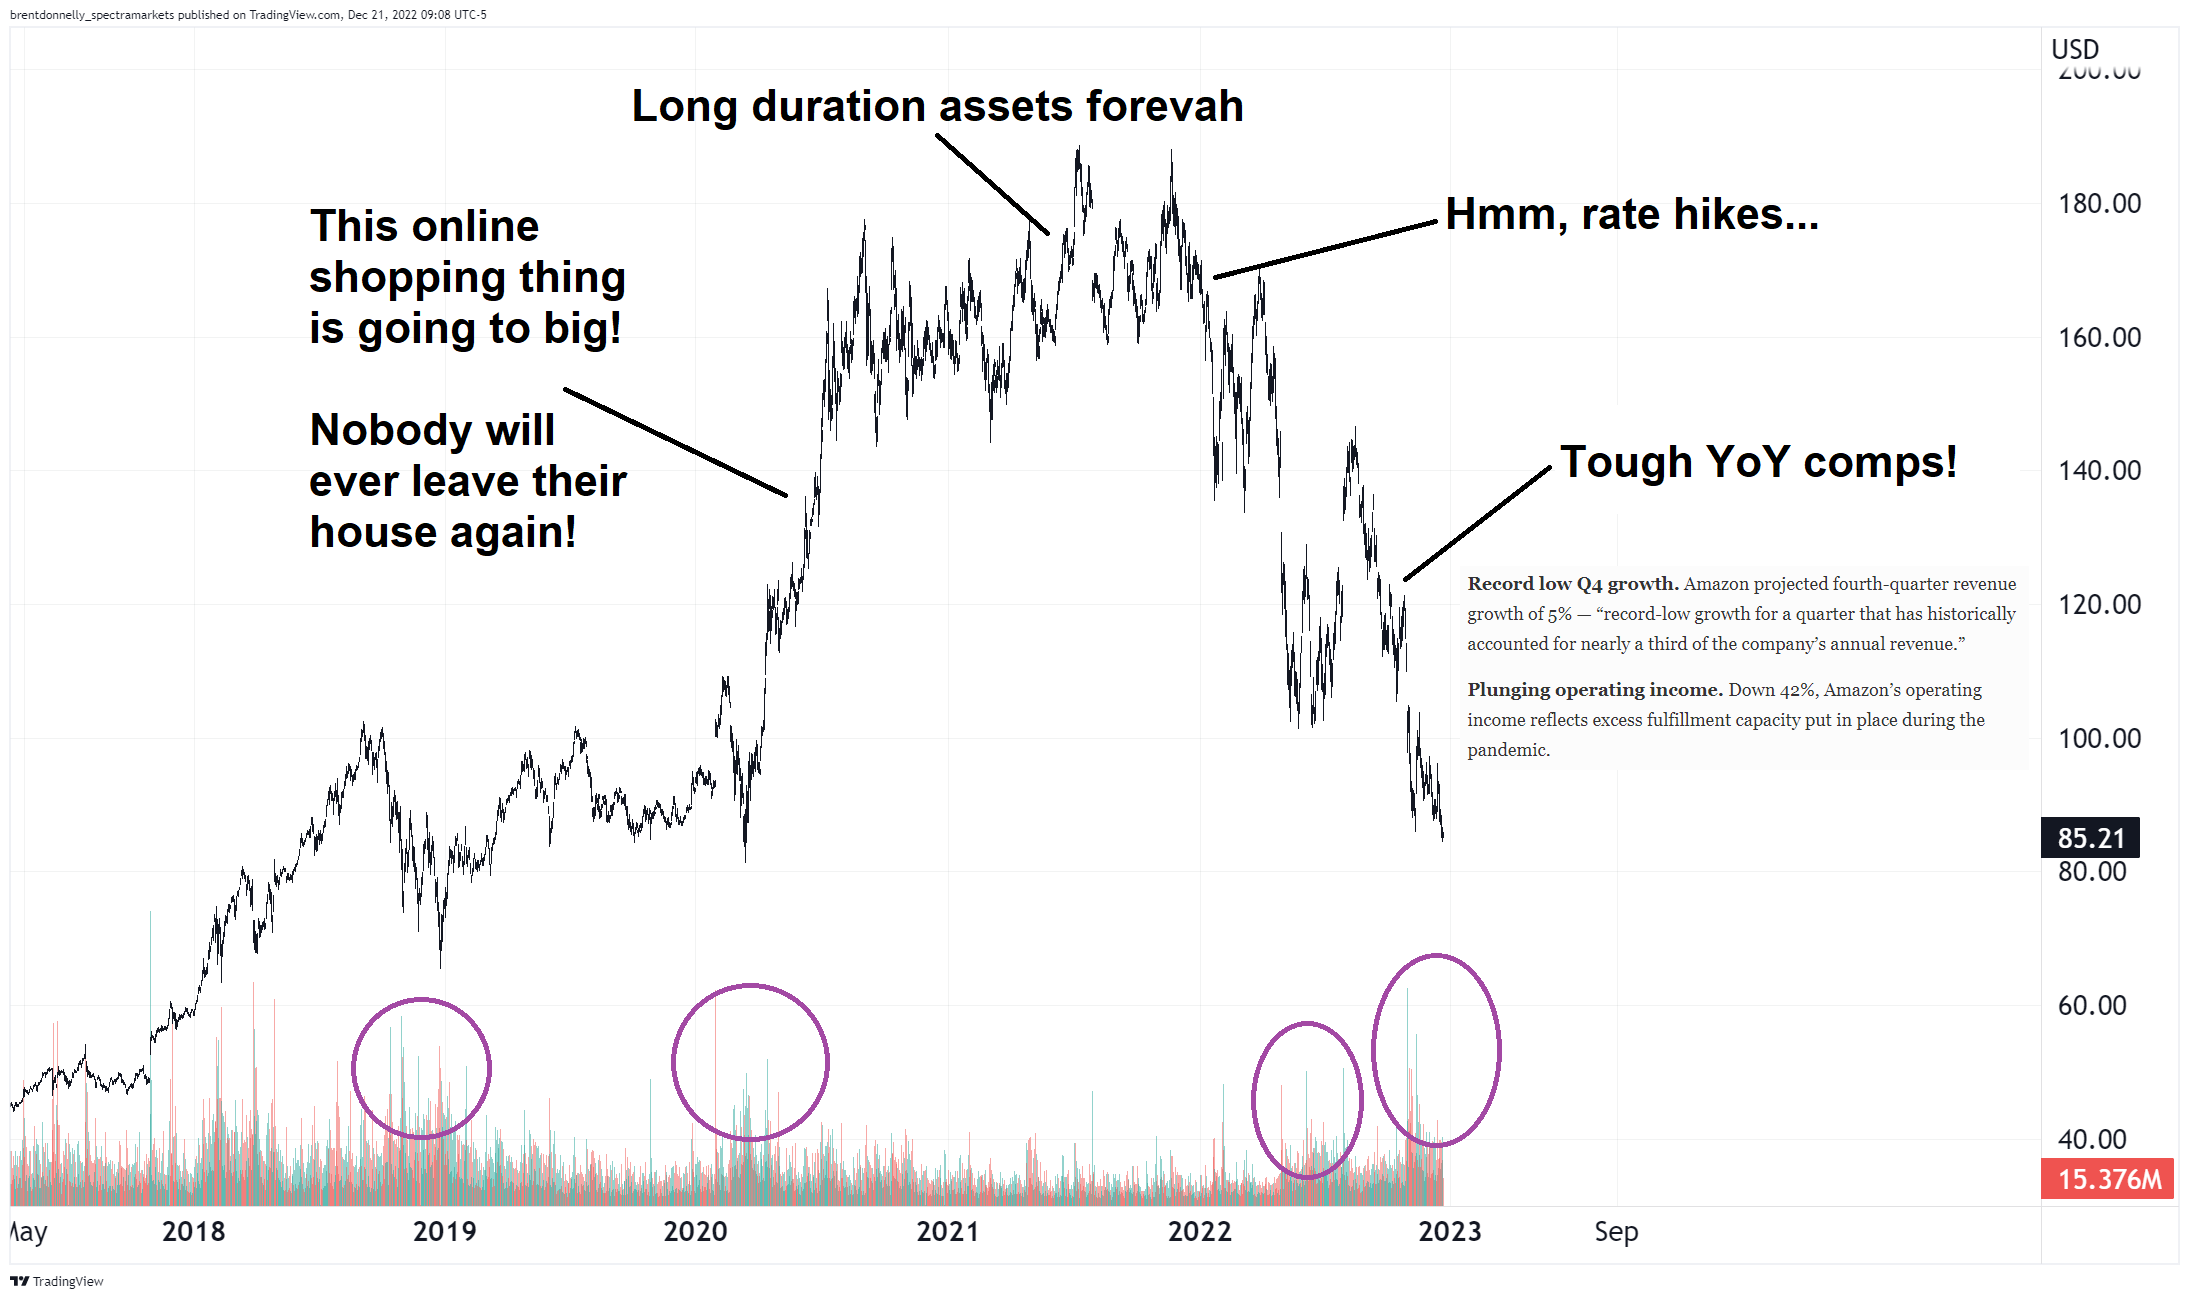
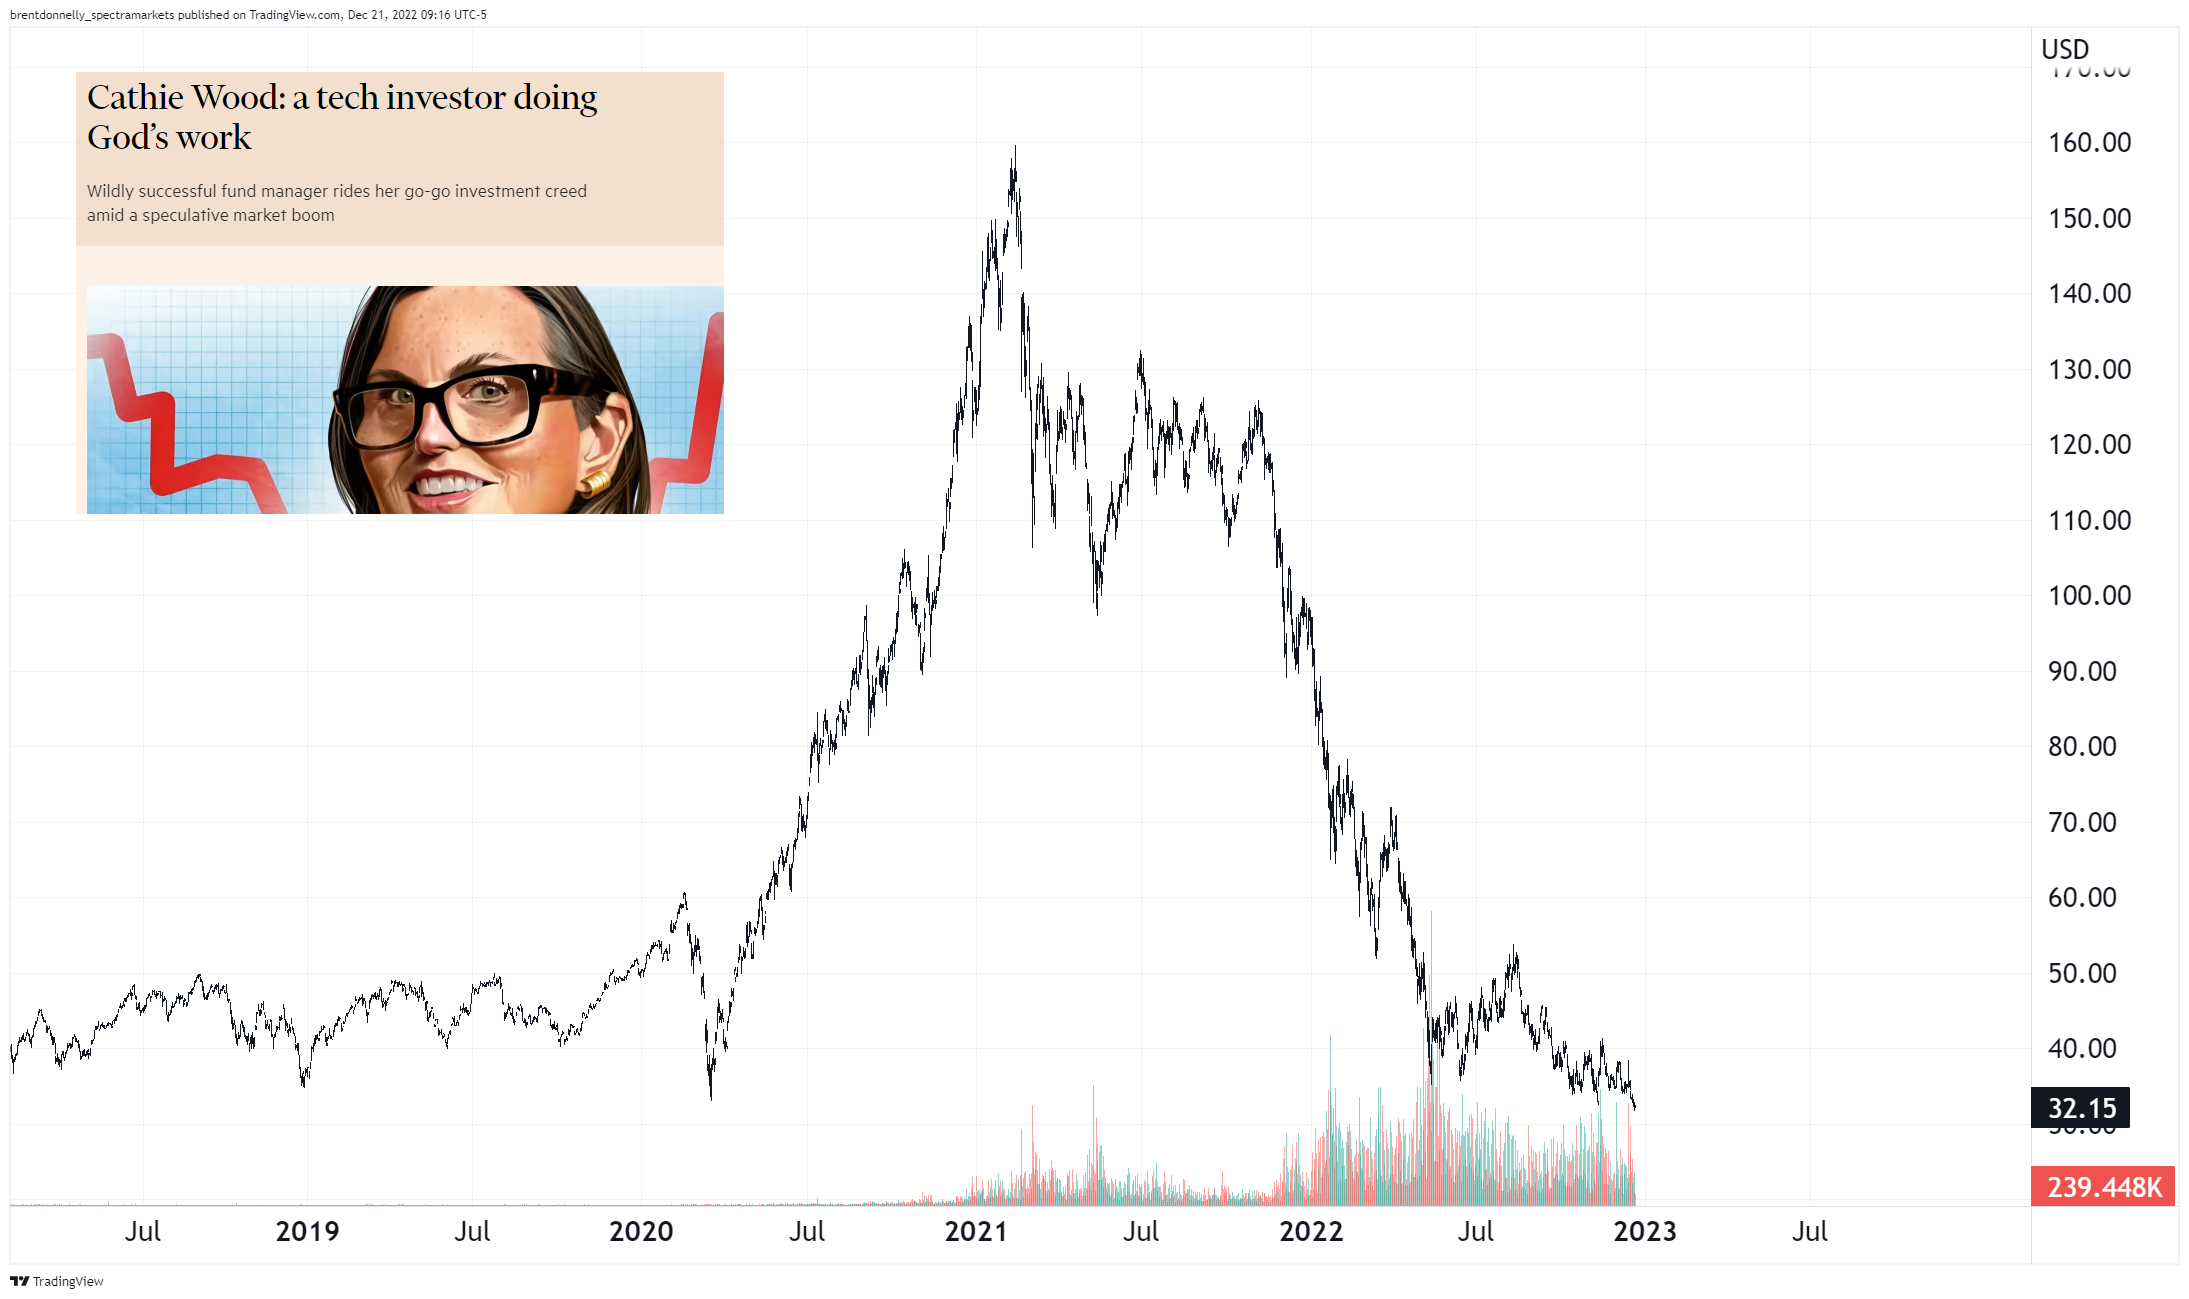
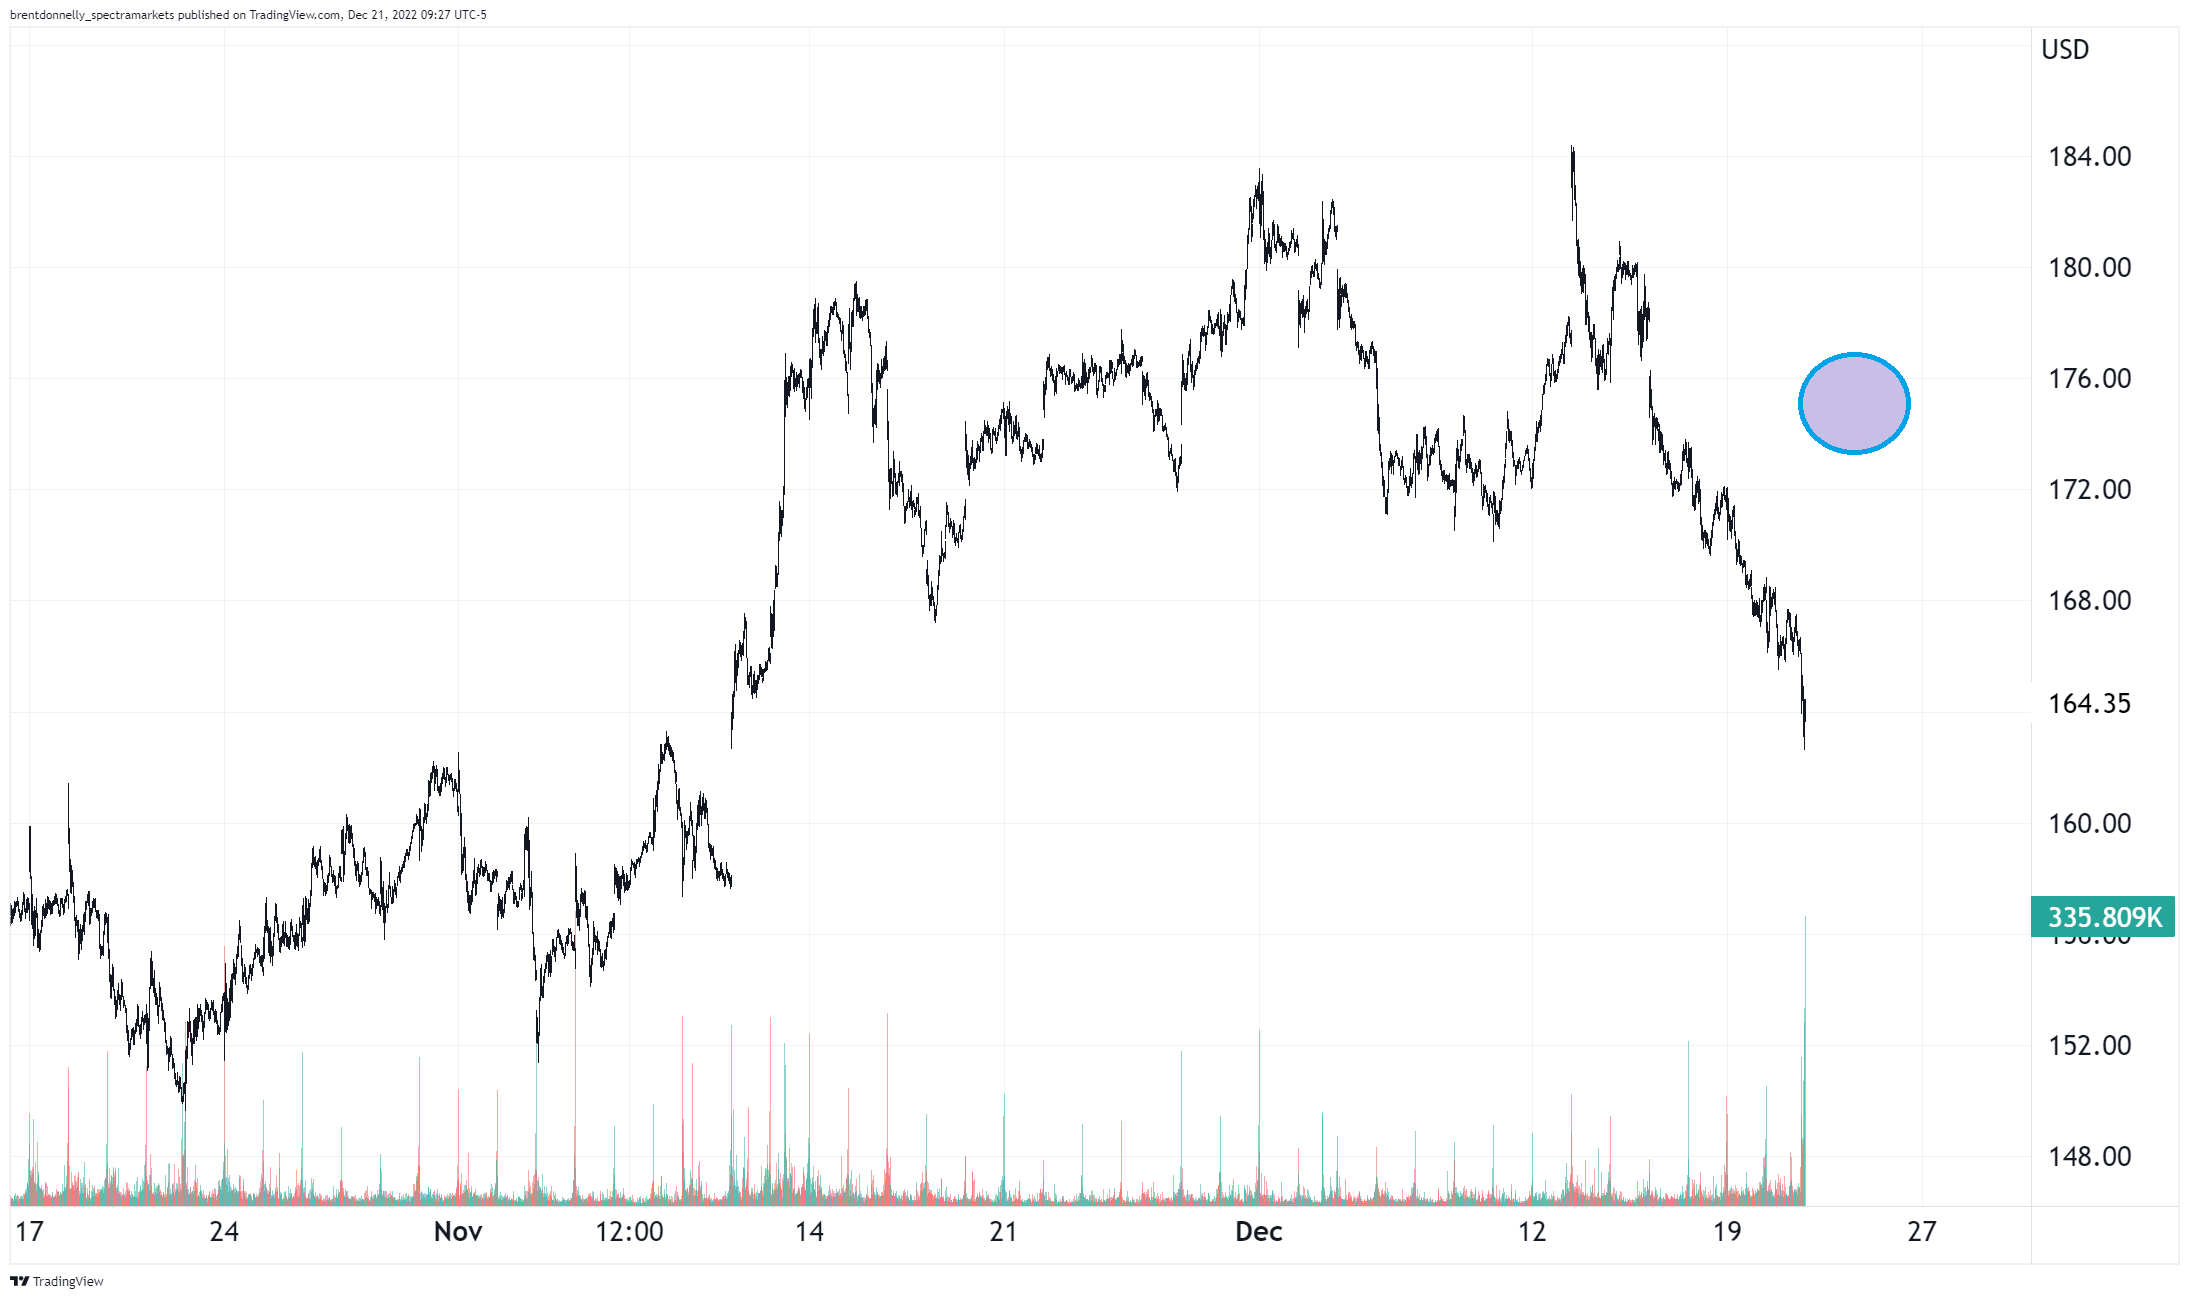
I am a big believer in market symmetry and the move from $85 to $187 back to $85 is almost perfectly symmetrical. Also note the purple ovals where I marked the volumes spikes as they tend to coincide with major lows. And of course, ARKK, the poster-girl of 2021 excess, is already trading far below where it started.
ARKK, 2018 to now
So, while this boom/bust cycle feels highly similar to 2001, an argument could be made that we are much further along than we were going into that year. Here is the chart of the NASDAQ in that period:
NASDAQ 1996 to 2004
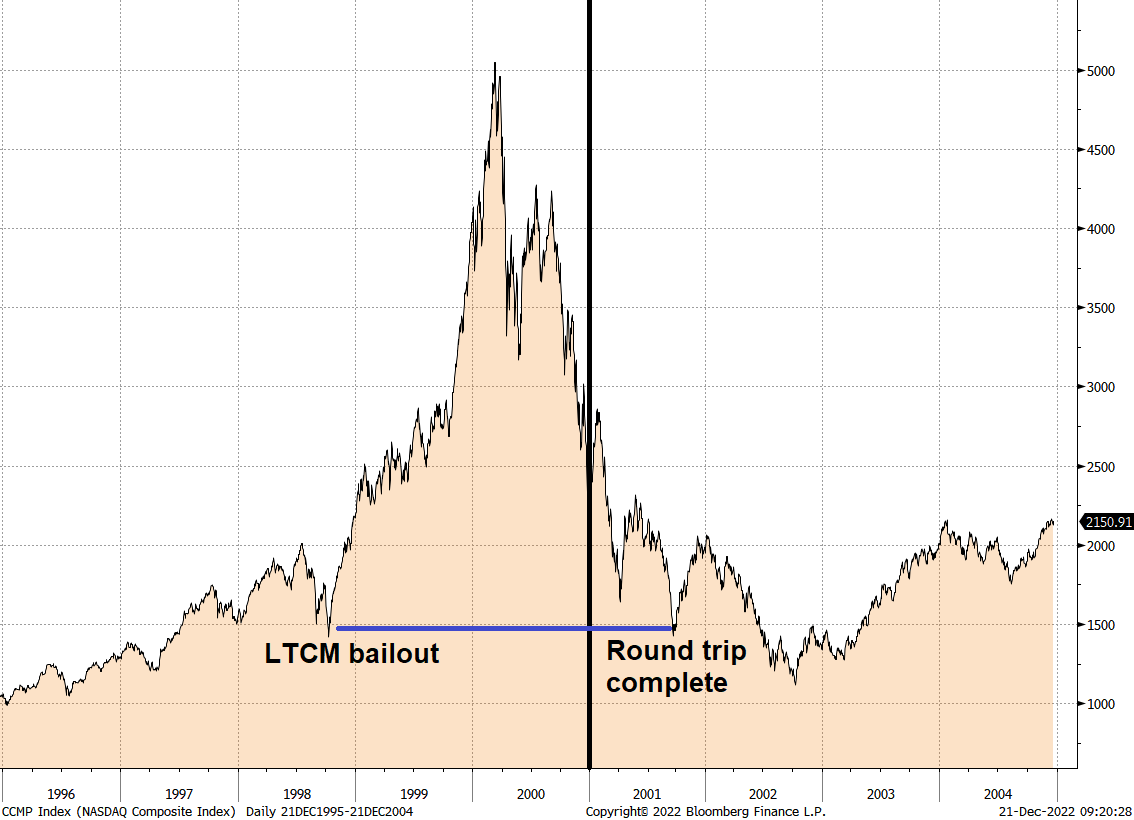
You see in that chart that NASDAQ went 1500 to 5000 and was still way up at 3000 going into 2001.
I chose ARKK and AMZN here, and they tell a similar story to most stocks, but if you picked TSLA or GME, the charts look different. The full-on meme / cult of personality stocks have not fully retraced the 2019/2021 move. Still, overall, there is much less froth now than there was on January 1, 2001. Then again, stocks went down in 2002, too!
Reason four that stocks could do OK next year is that perhaps the market is just too pessimistic on earnings. If everybody in the world expects earnings estimates to come down, and they don’t… Well, we don’t need to guess what that might mean because we saw it last night as FedEx and Nike both skyrocketed after earnings.
Nike and FedEx going back one month with purple grape marking where it’s trading pre-market
And finally, reason five that stocks could do OK next year is that perhaps the soft data is reflecting a grumpy consumer hating high prices and grumpy CFOs hating sky high wages. But high prices and rising wages are positive drivers of the hard data in a nominal economy. So perhaps this is one of those times where the soft data is wrong? It’s rare, but it happens. I am going to keep an open mind. It feels crazy to be optimistic into 2023. That’s why it might work.
Japan
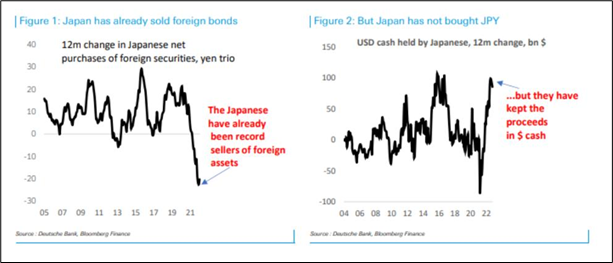
This chart from Deutsche was making the rounds yesterday and argues that the long JPY trade is a repatriation story. The idea makes sense, but one thing I will say about these actors: If they are going to be buying JPY, they will be selling rallies, not hitting bids. Japanese asset managers are patient and will leave limit orders or do risk reversals. They aren’t going to pile into the USDJPY bid sub-130.00. So sell rallies if you can. 133.80 is the nearby resistance and 135.00/50 is el largo. Also note the 130.50/90 level (key support) held perfectly in yesterday’s selloff.
If you can do exotics, selling 2-month 135.00 digitals to buy 128.00 digitals (or something similar) is a good way to play lower USDJPY without spending too much or getting mega long vol. I am less bearish USDJPY via options than consensus simply because the forward and the risk reversal are killer. I would rather wait and sell the rally to 133.80.
I still don’t think you need to rush into JPY or JPY vol.
Final Thoughts
South Korea export data came out at -8.8%. A single month of improvement doesn’t mean much (last figure was -16.8%) but it’s a step in the right direction.
Have a moonshot day, mate.
good luck ⇅ be nimble
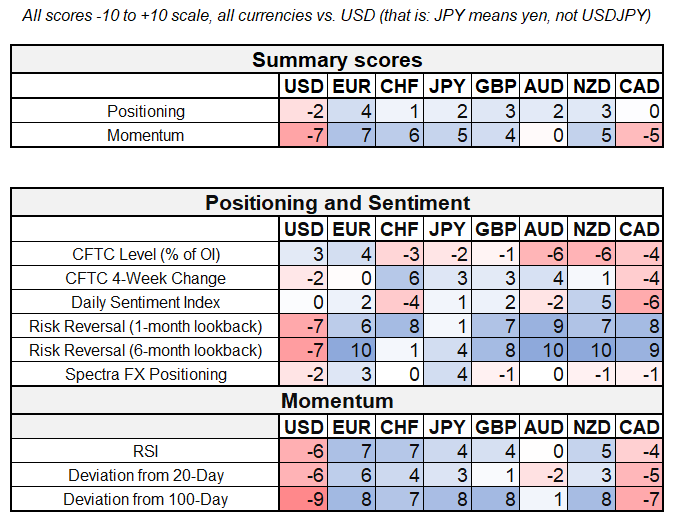
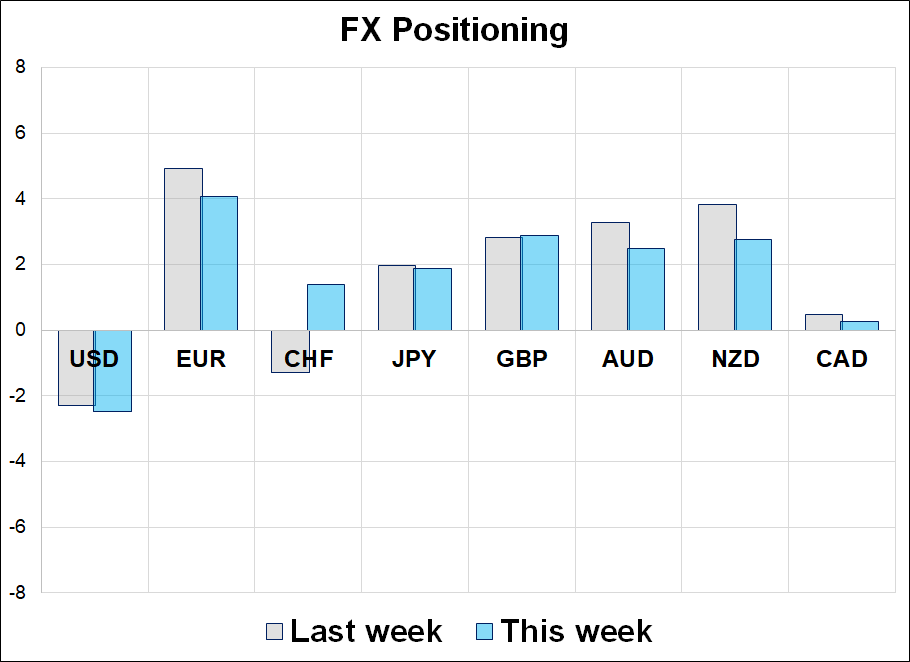
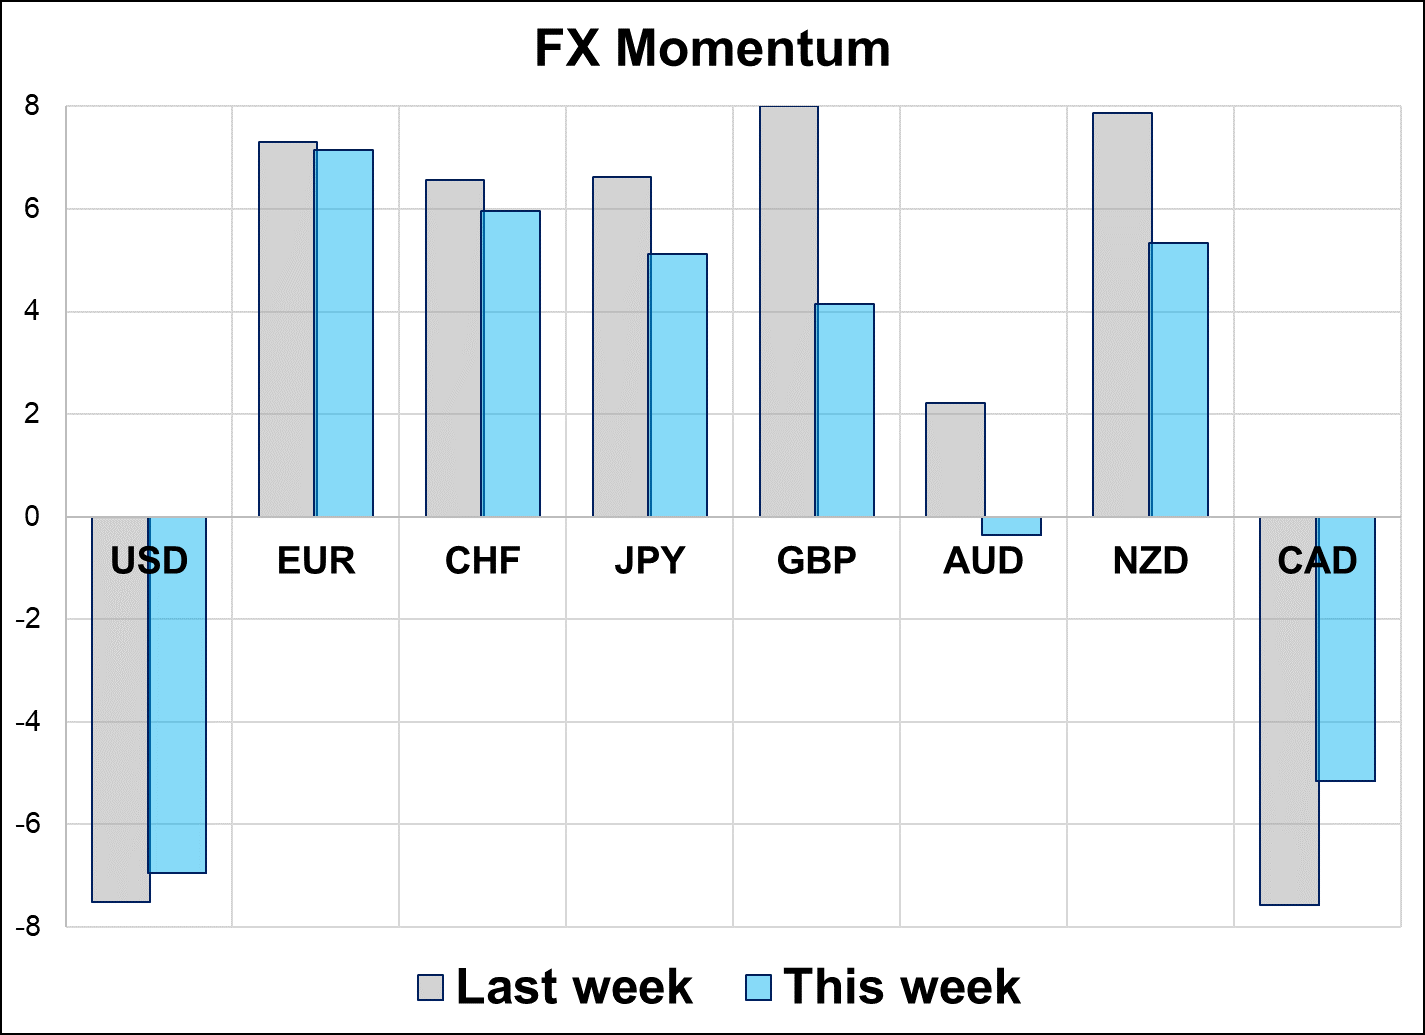
The Spectra FX Positioning and Momentum Report
There wasn’t much change in sentiment and positioning this week. The short USD trade lost momentum and it lost a bit of sponsorship, but overall, a modest bias to be short dollars remains. The favored expressions from Spectra clients have been long EUR and long JPY, which makes sense as the market is leaning more towards recessionary trades, and less toward procyclical ideas like AUD and CAD.
Here are this week’s positioning and momentum scores:
G10 FX Positioning and Momentum
2023 Consensus Snapshot
The 2023 consensus is calling for: stronger JPY, higher AUD, weaker stocks, higher bonds, and rising odds of Fed rate cuts in the back half of 2023. Here is how the bulls and bears stack up on the street when we tabulate all the bank FX Strategy forecasts for 2023:
FX Strategy, bulls and bears for 2023, by currency
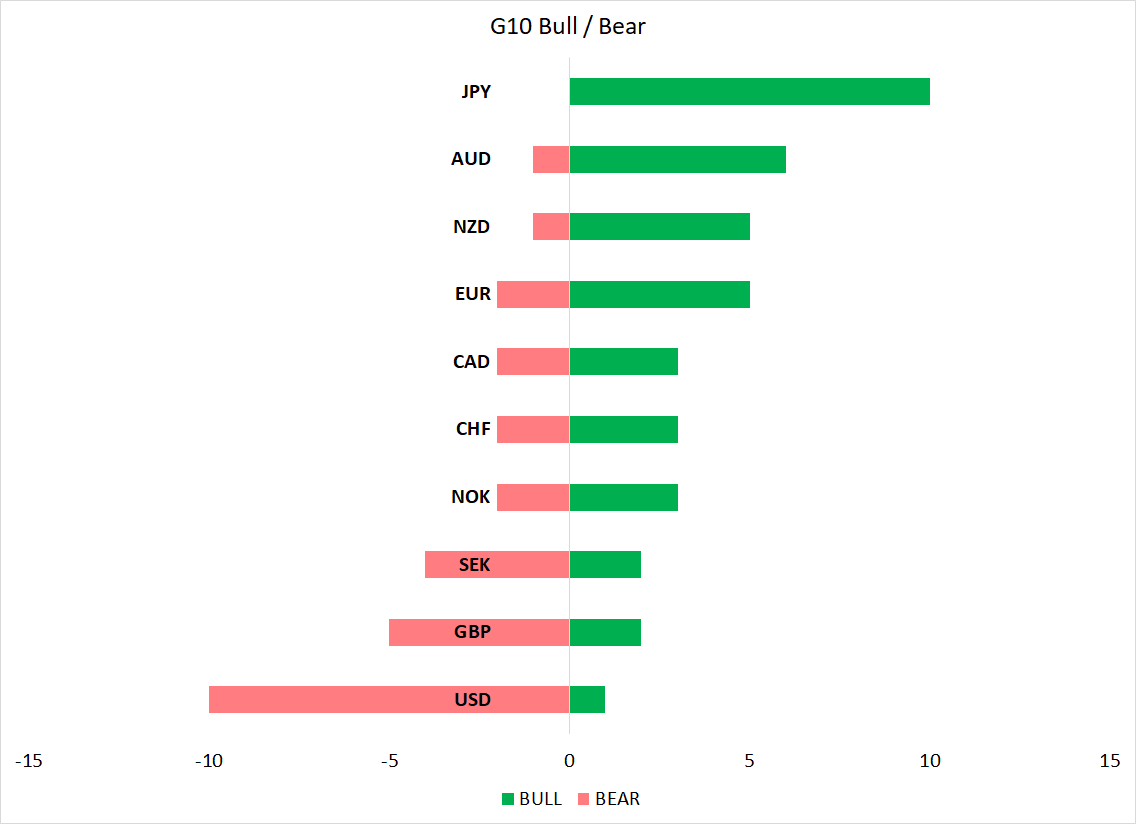
While the market likes some trades, such as short USDJPY, there is concern on timing and therefore participation hasn’t been huge to this point. With a changing of the guard at the BOJ in April 2023, many are concerned it’s too early to get involved here and are waiting for January or even February.
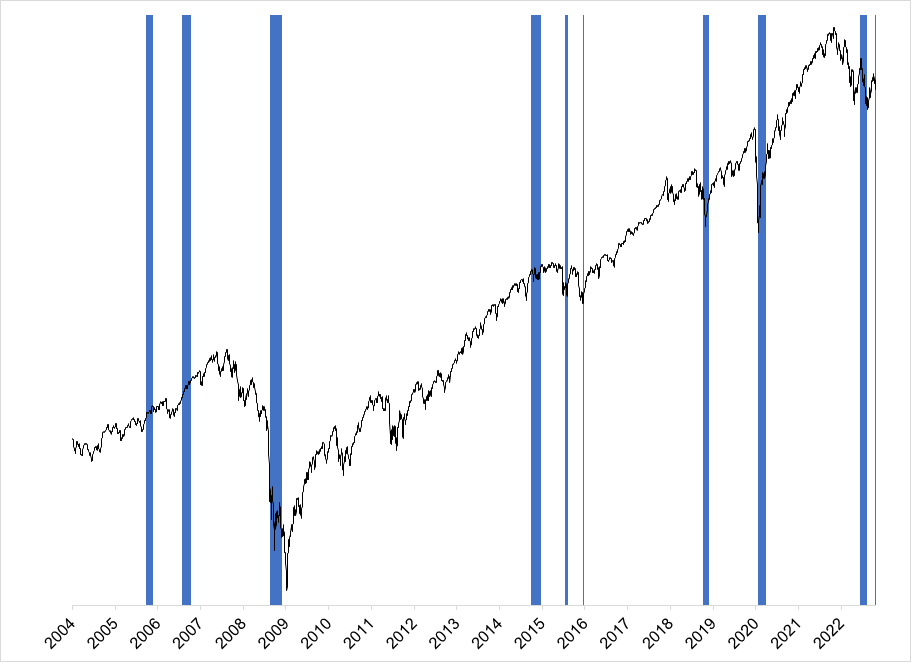
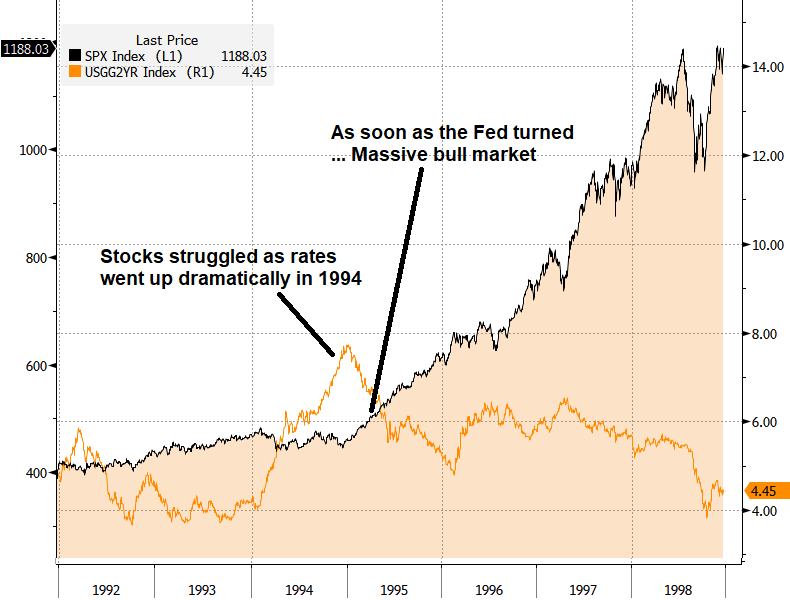
As far as analogs go, most comparisons right now highlight similarities to 2001 because we look to be entering a recession, but the leverage in the system now is nothing like it was in 2008. An extremely surprising analog would be if the US economy and stocks successfully skate through aggressive rate hikes like they did in 1994/1995. This is not our view, but worth keeping back of mind given the raging bearish equity consensus going into 2023.
Orange line is US 2-year. Black line is SPX
That’s it for this week! Thanks for reading.
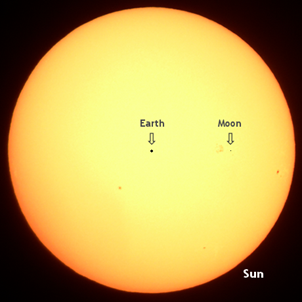
Moon: ~2,159 miles in diameter
Australia: ~2,465 miles wide

P.S., the sun is 865,370 miles in diameter!!!