CAD
USDCAD is selling off even as CAD underperforms many of its peers. We are now approaching the critical 1.3600 level again, after a flashy move up into the mega range top during the early August Carrypocalypse. Here’s the wide-angle lens:
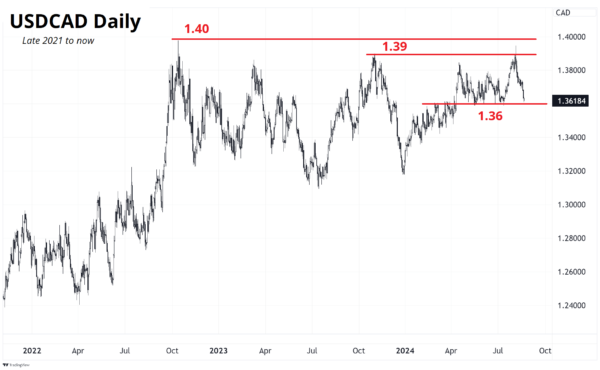
And here’s what we see if we zoom into this year’s action.
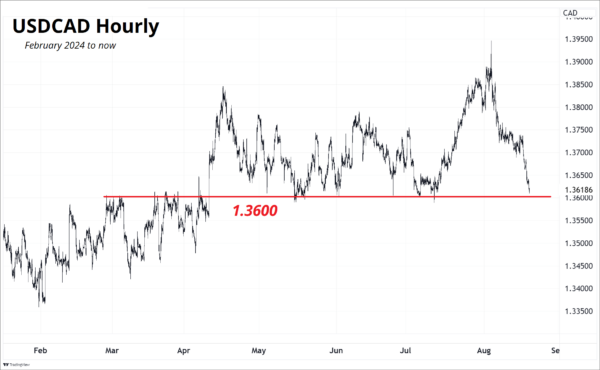
You can see 1.3600 has been quite a level as it was the ceiling in March and April and became the floor in May, June, and again in July. Now we are back down here despite two potentially meaningful idiosyncratic CAD-bearish factors lurking.
- Couche-Tard in talks to buy 7-11. At $31B US, this would be the largest inbound M&A Japan has ever seen. There are many ifs and buts involved here as the deal could face US antitrust scrutiny, the financing might not be all cash and thus might not be all LHS CADJPY. Still, there would be enormous FX risk for Couche-Tard if they were to finance by selling JPY-denominated debt and these deals tend to be focused on the business synergy and revenue expansion side of the equation, not fancy financial engineering. Very often, deals like this are done with big slugs of cash.
- Canadian rail workers are getting set to go on strike. Here’s a quick article about the possible economic impacts. Workers at CP have served strike notice that would see them walk off the job as of 12:01 a.m. ET on Thursday, while CN has said it intends to lock out workers at the same time unless an agreement or binding arbitration is achieved. This is a maybe for now as the government may intervene or the workers might come to an agreement. But if it happens, it’s not great.
These factors are worth keeping on your radar and while the entry points in cross/CAD are not good enough to justify a trade, I would definitely not be long CAD right now (against anything) as these two stories pose idiosyncratic risk to the loon over the next few weeks. Especially as we approach the critical 1.3600 level again.
Showtime for EURUSD
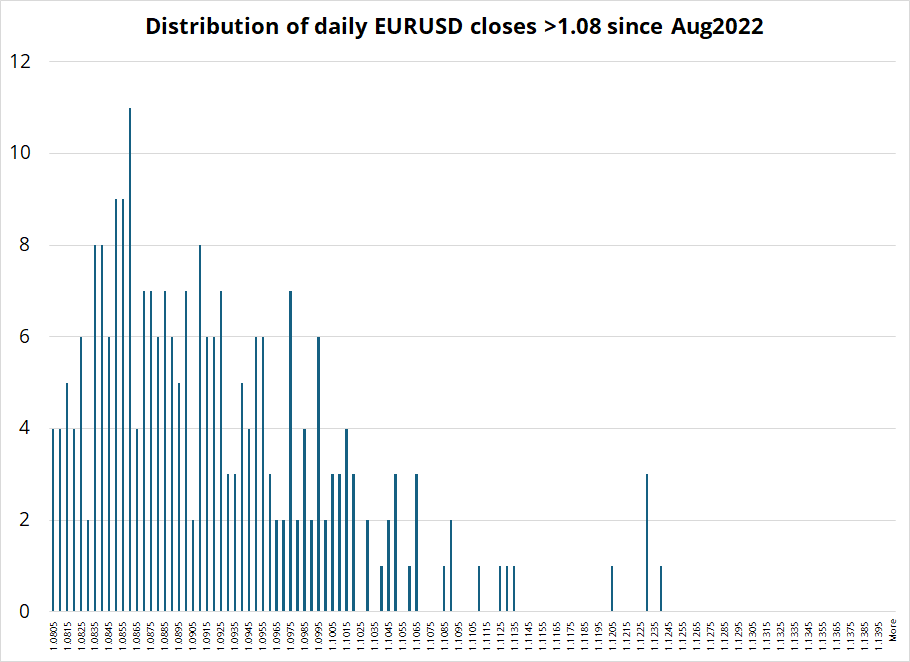
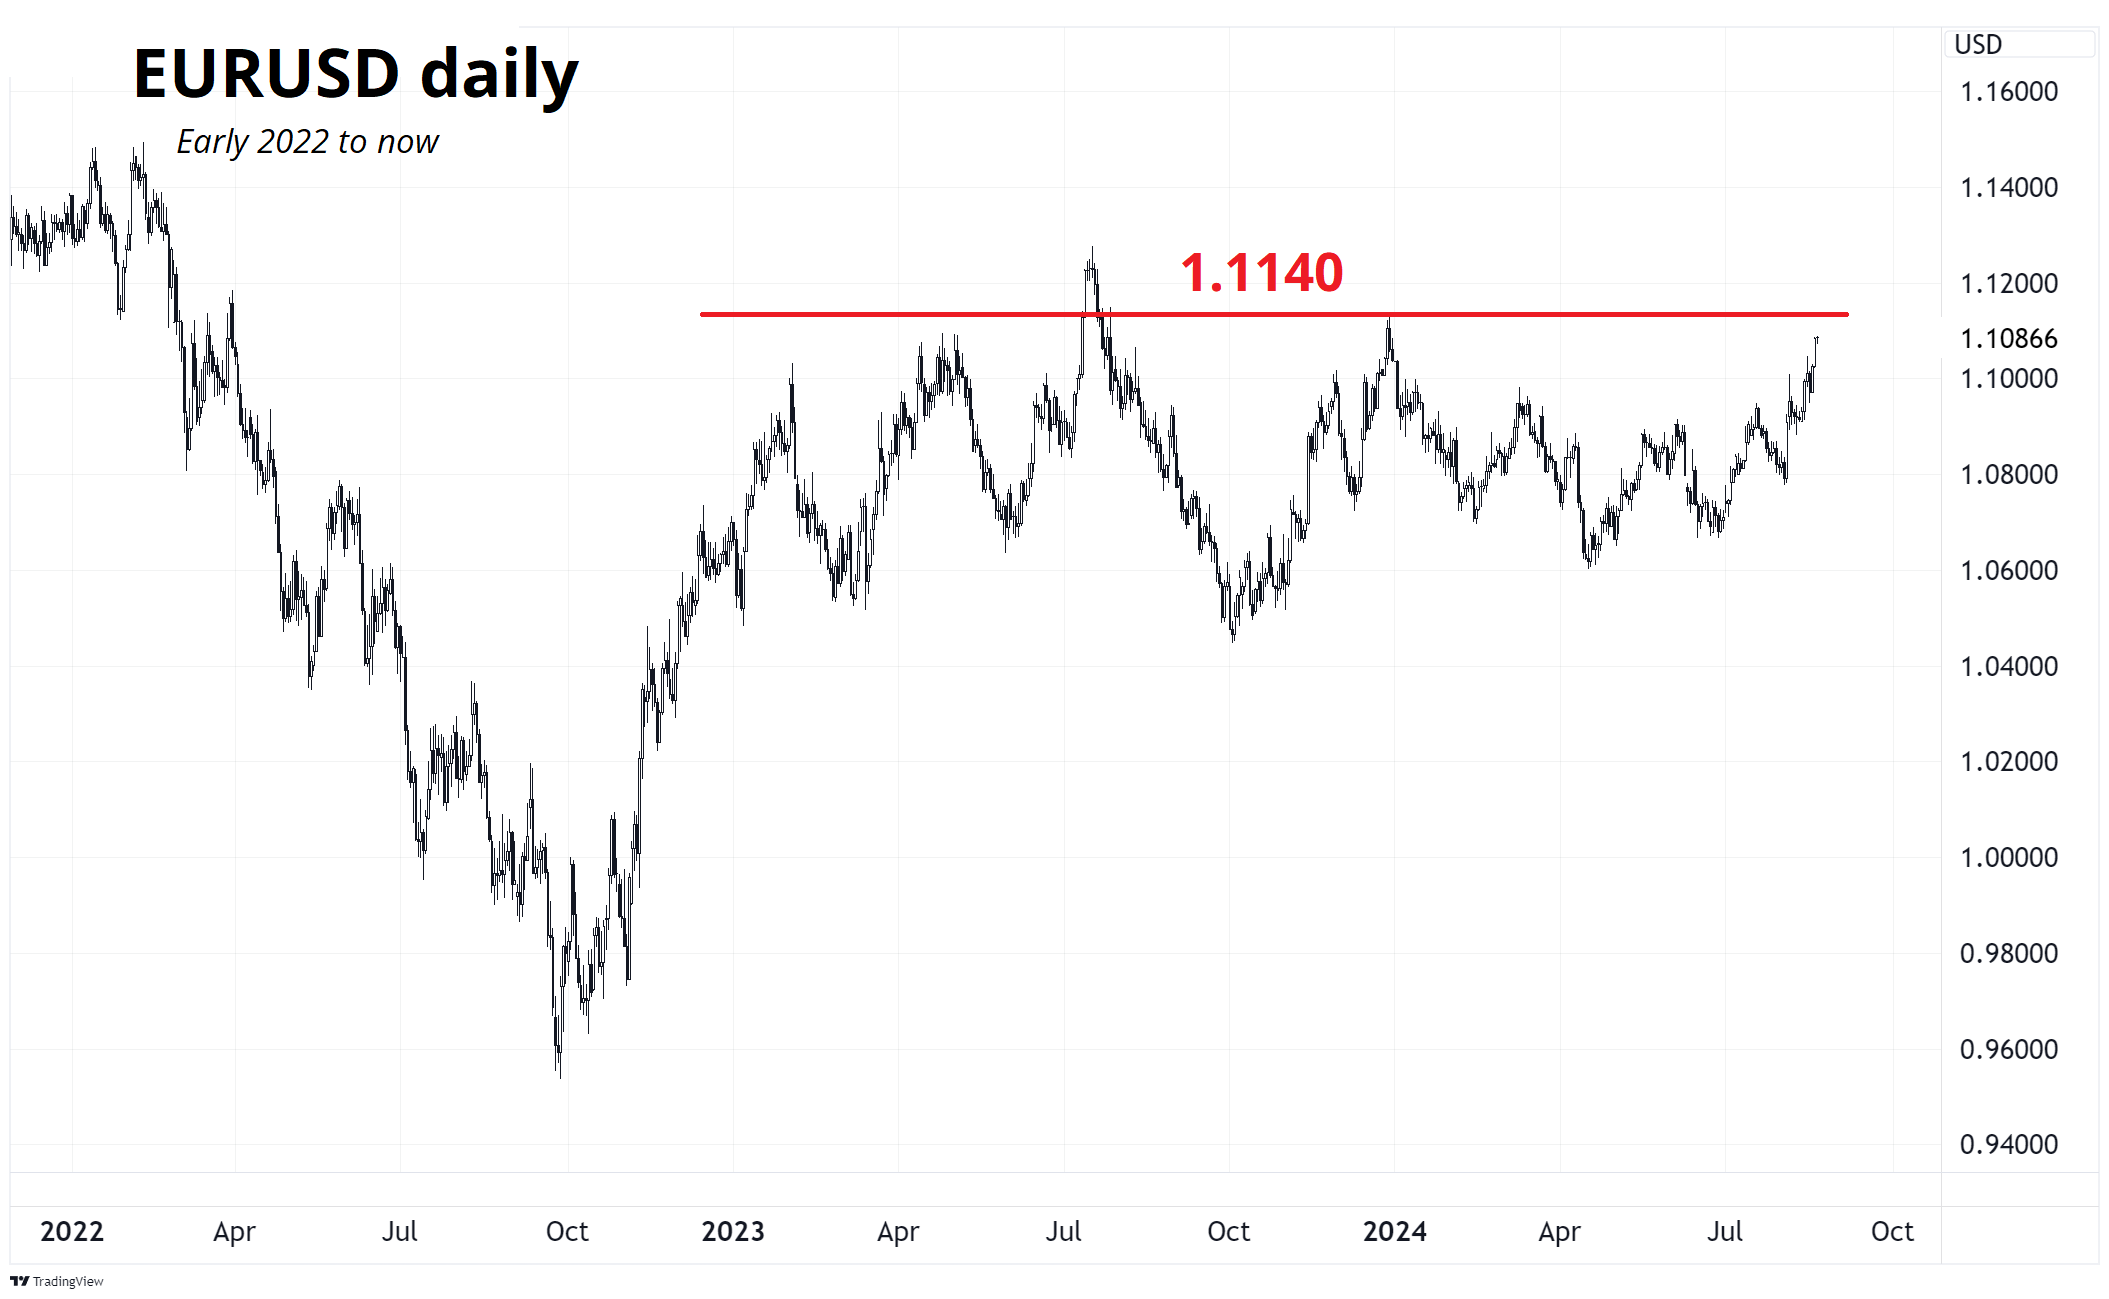
Much like USDCAD, the euro is right at a huge level as we have closed above 1.1100 just nine times in the past two years. We have only closed above 1.1130 five times in the last two years. We are in rarified air.
Final Thoughts
There were a few articles going around last night about the release of the papers from the BOJ workshops. This article in particular got some attention: Bloomberg: Research notes indicate interest rate hike is still on table.
I would just note that the BOJ research paper referenced (see here) is a discussion of workshops held on May 21, 2024. Given those workshops were well before the BOJ hiked, I can’t see how they are much relevant to current discussions. They could have simply been the justification for the last rate hike—they don’t necessarily indicate anything about future rate hikes. The BOJ note is super big picture and covers discussions held three months ago.
Finally, Kiwi is ripping, much to my chagrin. I will stick to the parameters outlined in the sidebar.
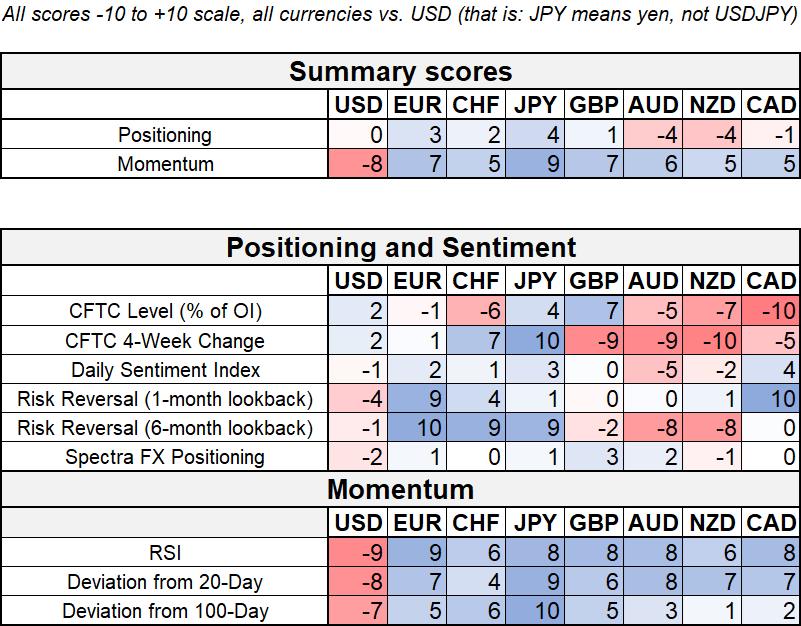
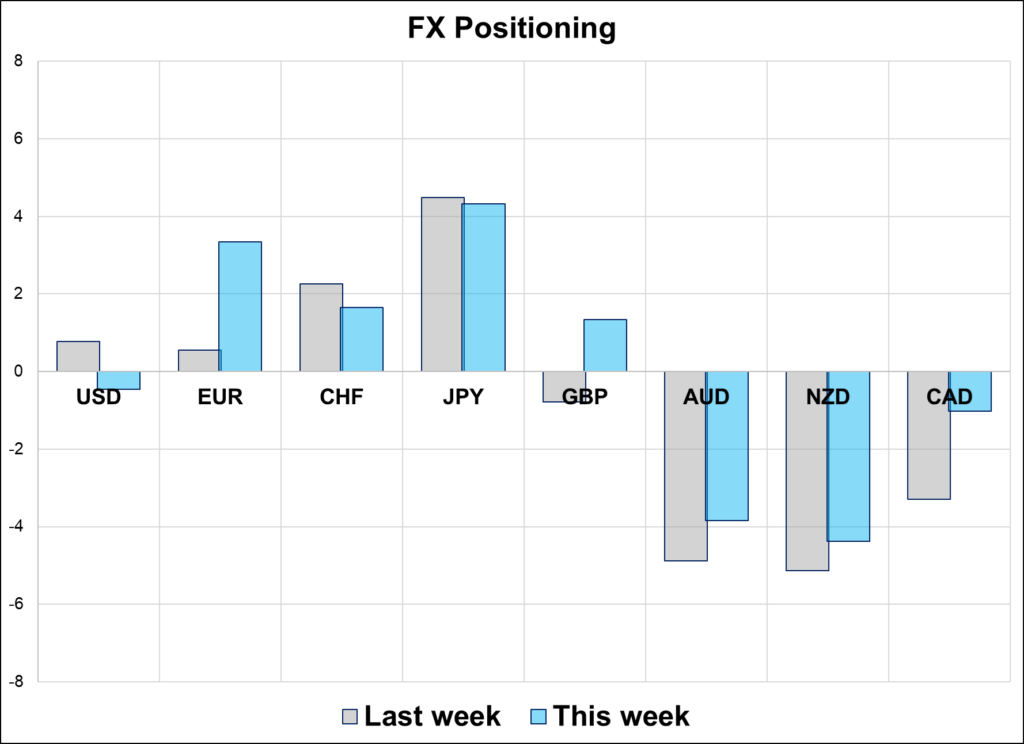
See below for the Spectra FX Weekly Positioning Report.
Have a golden day.
The Spectra FX Positioning and Momentum Report
Flipping Yen
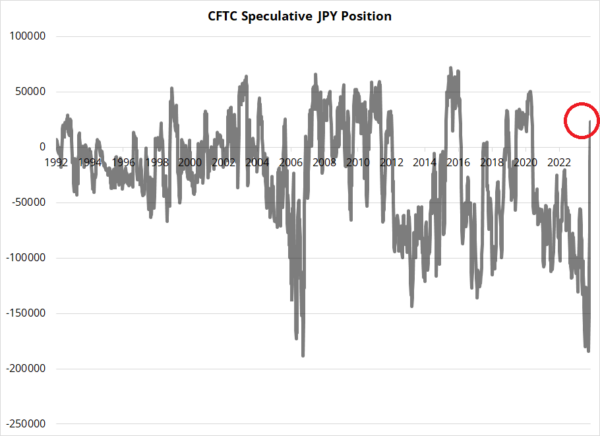
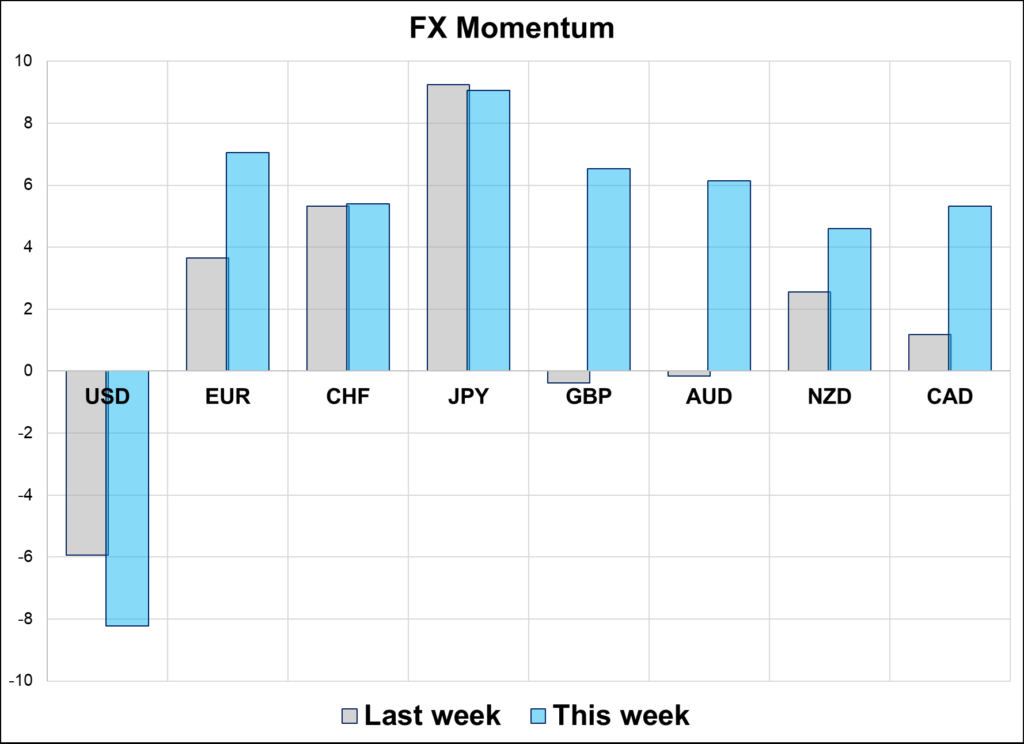
Hi. Welcome to this week’s report. There has been a complete 180 in many metrics over the past few weeks as the CFTC has exited mega short JPY positions and now flipped long. USD momentum has been extremely bearish of late as we slow-motion crash up towards the top of the EURUSD range. Key levels in EURUSD are heavy in the 1.1100/1.1130 zone.
In lieu of the normal write up this week, I am excerpting from Cameron Crise’s excellent piece this week because it captures the yen flip nicely and makes some interesting observations about future performance of various securities after a multi-sigma possy flip. The following excerpt is provided with Cam’s permission.
Huge Futures Position Changes Usually Seem to Work: Macro Man
https://blinks.bloomberg.com/news/stories/SIGS3CDWX2PS
By Cameron Crise
It’s funny to see how various rate-sensitive market prices have diverged on Monday, with the yen in particular following the abrupt shift in IMM positioning. If history is any guide, then USD/JPY (and especially NZD/JPY) could keep falling further.
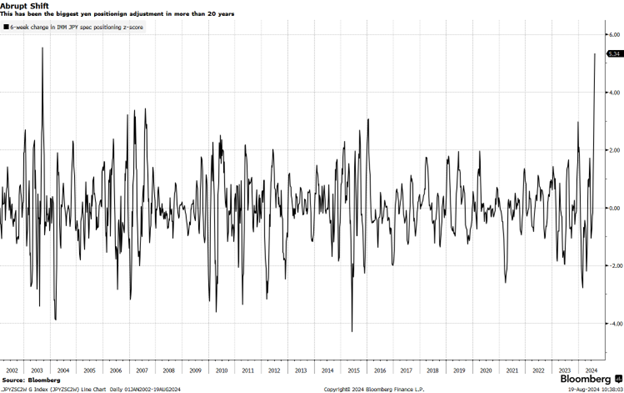
While the nominal speculative position in IMM futures is now somewhat long yen, the adjustment over the past six weeks has been nearly 5 and a half standard deviations, using a two-year look-back window.
That’s the most abrupt position-shift since September of 2003.
The obvious question is “what happened next?”
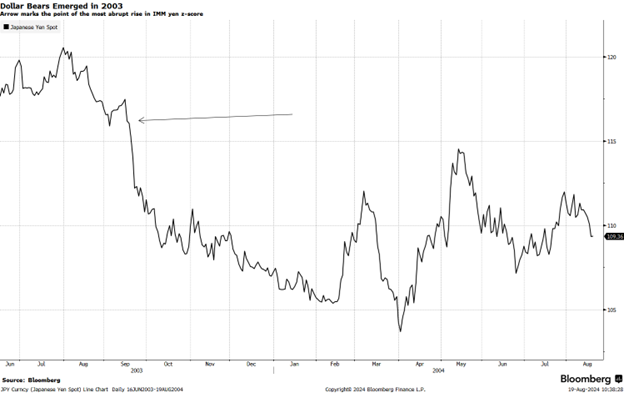
Well, it was a very different world back then, and that period coincided with what we might call the beginning of the “dollar going down forever” theme. This saw USD/JPY fall sharply over the ensuing months, though losses were tempered by strong a BOJ/MOF bid at 105. Ironically enough, Japan’s authorities may have taken profit on some of those purchases in some of its recent dollar-selling activity.
More broadly, though, I was curious about how often we see huge futures positions adjustments that shift the z-score by 5 standard deviations or more over a six-week window. That’s admittedly an arbitrary set of criteria, and assessing futures positions can be a little tricky.
As discussed recently, in FX they represent only a small cohort of total market participants, whereas in bond futures they capture basis trades, equity and commodity markets capture hedging activity, etc. Anyhow, the table below sets out extreme shifts in futures-positioning z-scores over a 6-week span back to 2002.
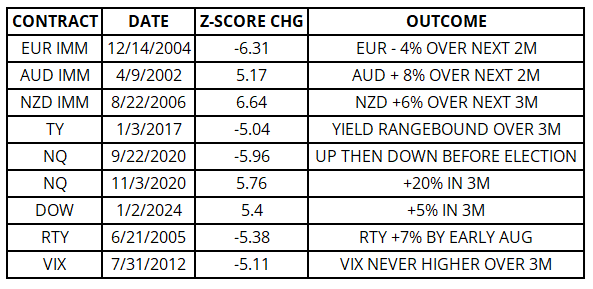
On balance, the price action has tended to follow the direction of the big positioning shift. That bodes ill for the likes of NZD/JPY, as the kiwi futures position has dropped by just over 5 sigma over the last six weeks as well. Granted, the sample size of the study above is not particularly large, but the only time when the price action clearly moved against the positioning was a Russell 2000 rally nearly 20 years ago.
Thanks for reading this week’s positioning report and thanks be to Cam for his insights!
Here is the updated chart of CFTC JPY positioning:
