Bracing for a quiet week and some random vol on meaningless headlines
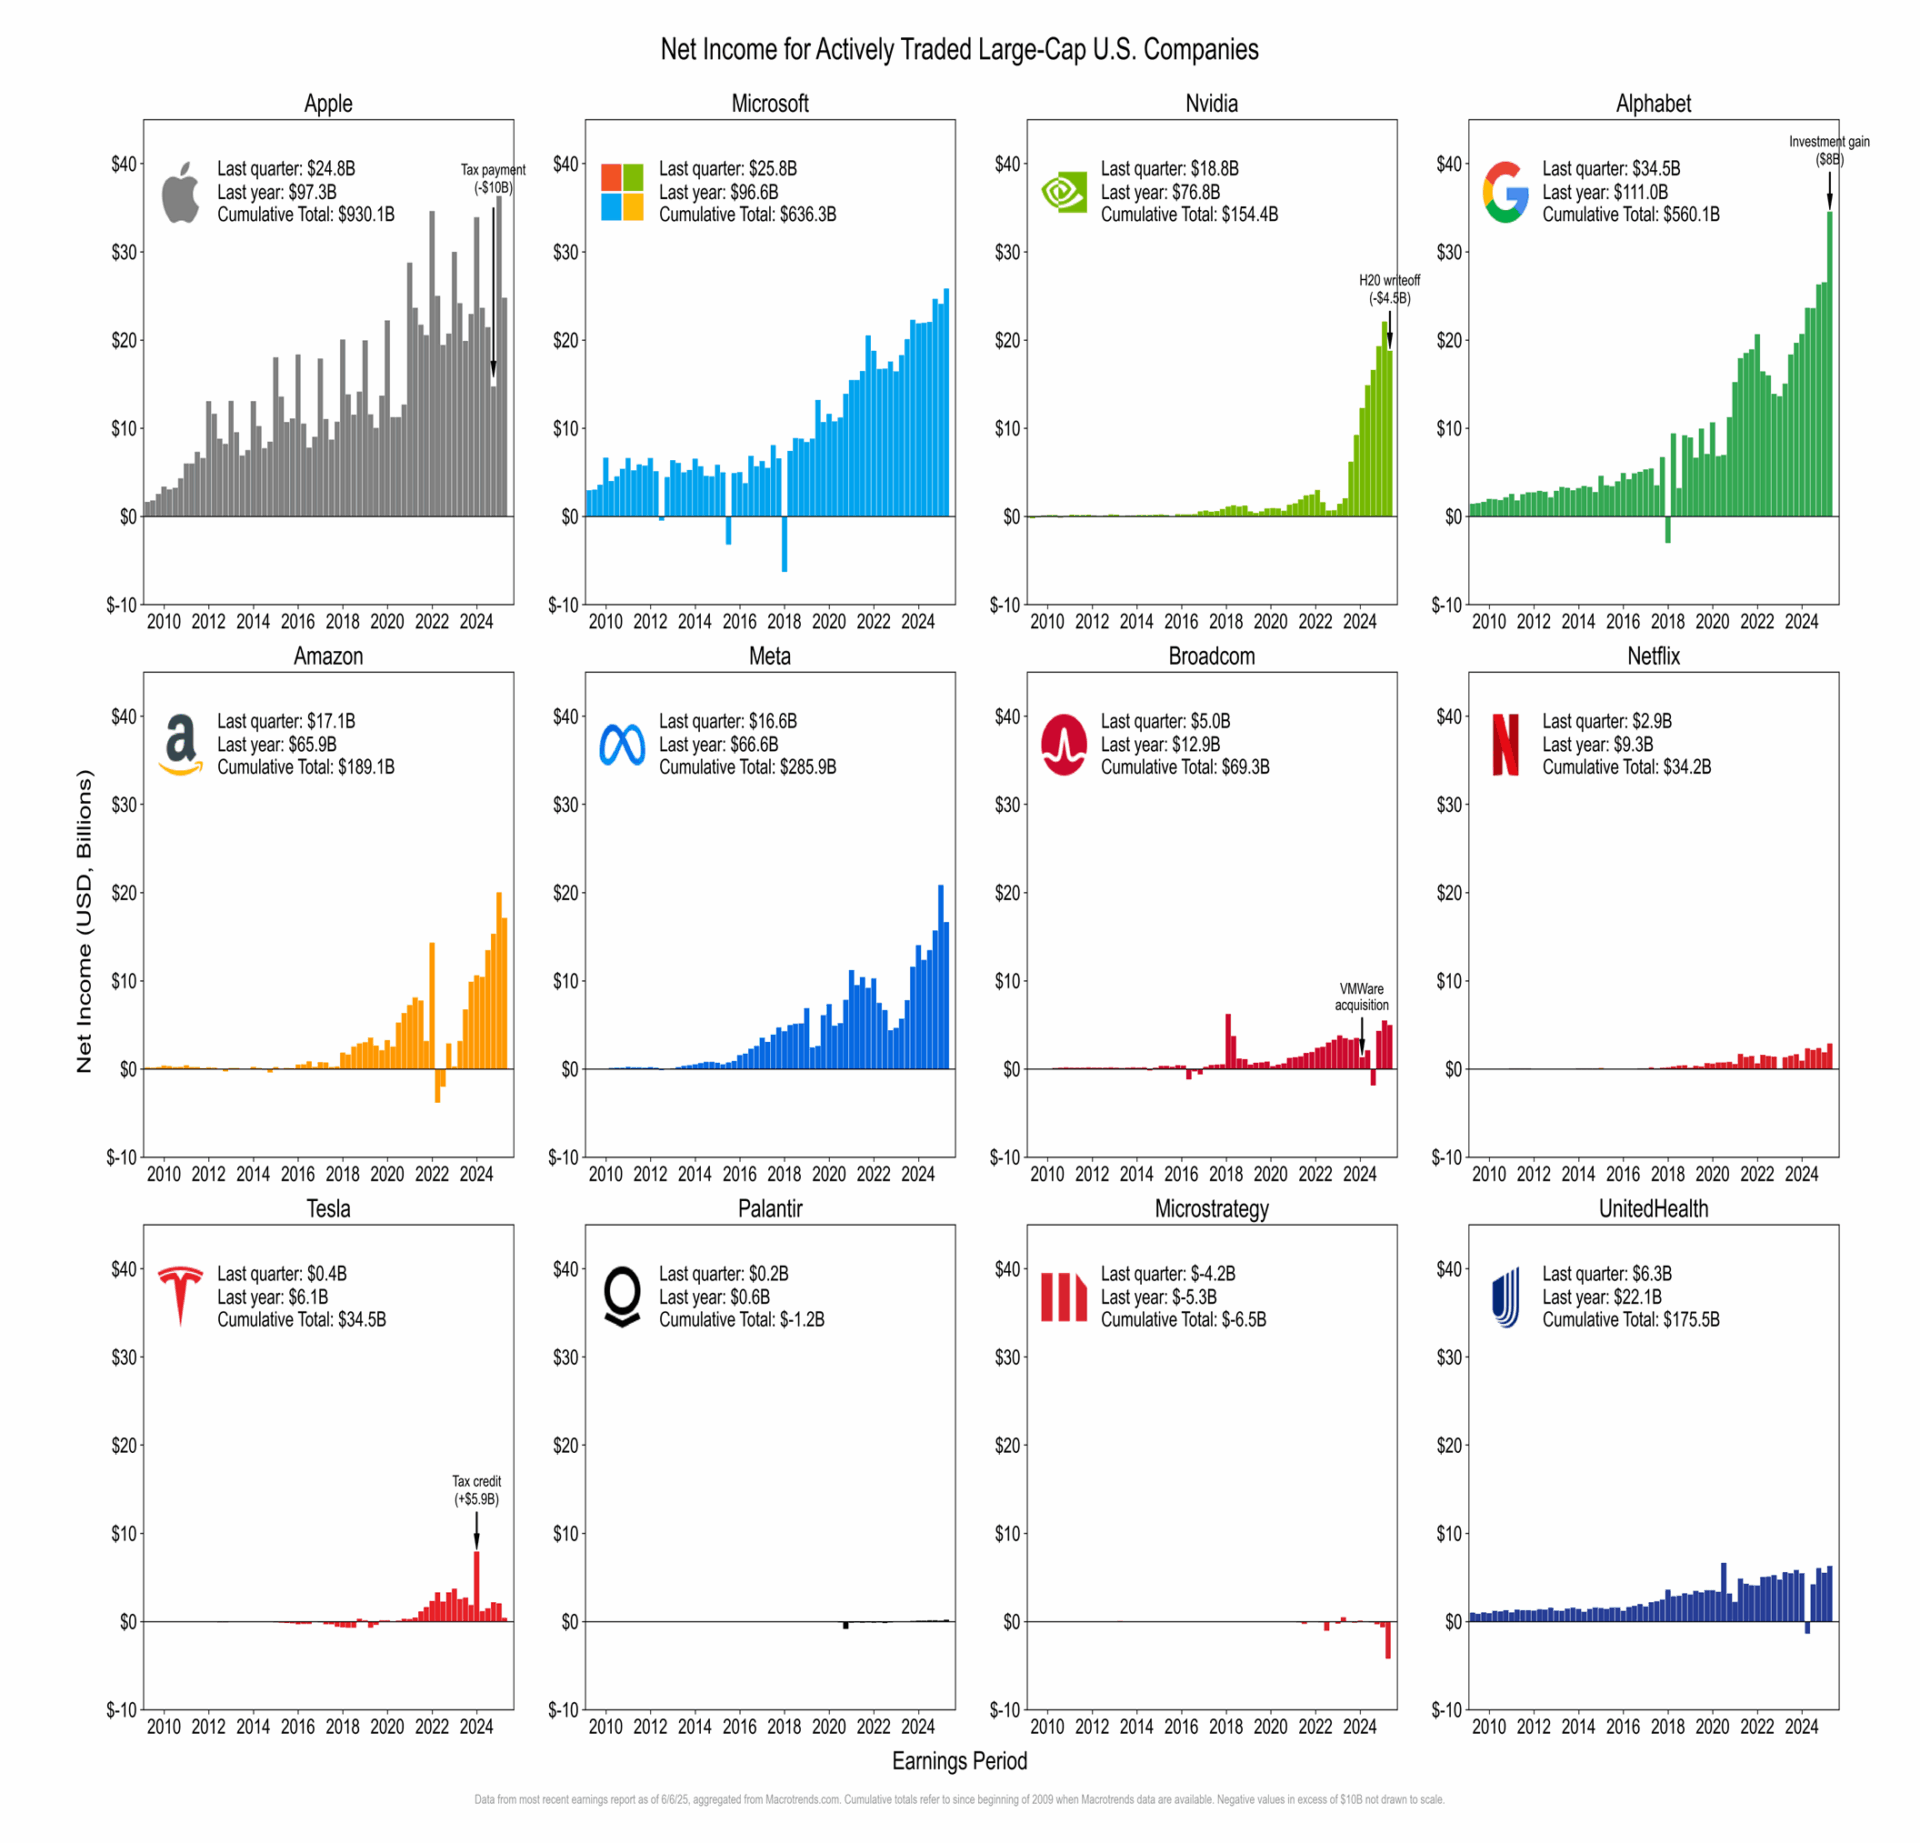
US Large Caps, Quarterly Net Income
Bracing for a quiet week and some random vol on meaningless headlines


US Large Caps, Quarterly Net Income
Flat
Carry continues to work as the USD vs. G10 stagnates, but high-yielders outperform. Looking at FXCTEM8, Bloomberg’s FX Carry Index, we see a chart that looks like this:
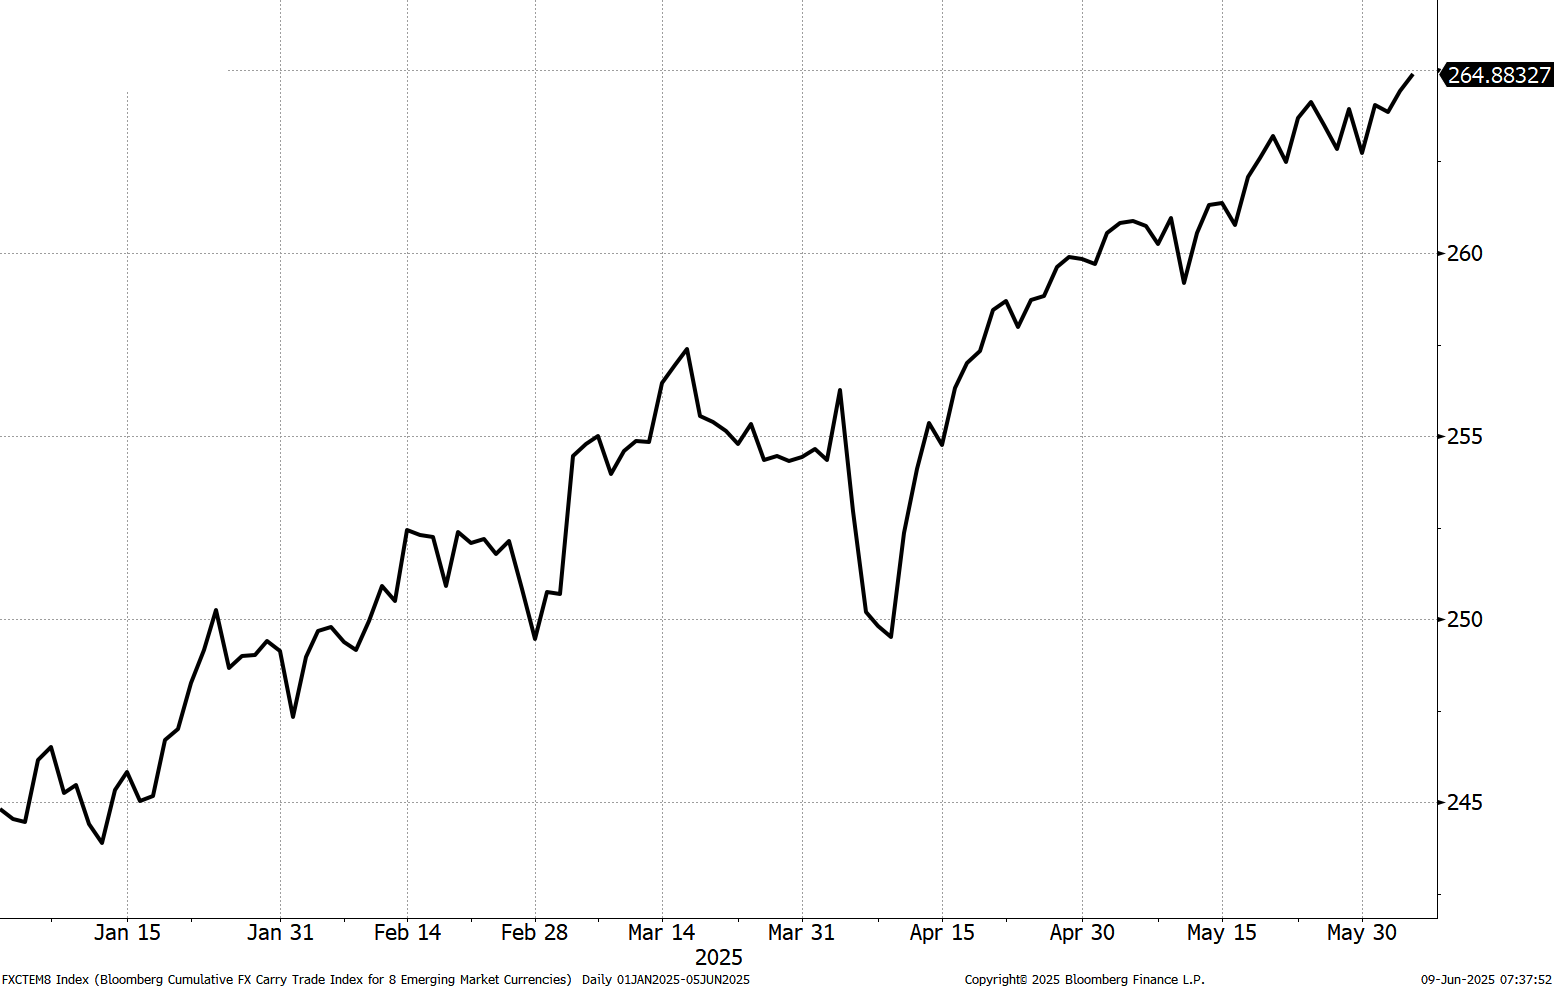
Here’s a description of the index, in case you’re curious:
FXCTEM8: The Bloomberg Cumulative FX Carry Trade Index for 8 Emerging Market Currencies
The EM-8 Carry Trade Index measures the cumulative total return of a buy-and-hold carry trade position that is long eight emerging market currencies (Brazilian real, Mexican peso, Indian rupee, Indonesian rupiah, South African rand, Turkish lira, Hungarian forint, Polish zloty) that is fully funded with short positions in the U.S. dollar. It is assumed that the investment is in three-month money-market securities, with each of the eight EM currencies assigned an equal weight in the currency basket.
While carry is popular, I don’t see many signs of a bubble or even a bubblette in FX carry trades. There have been enough risk aversion flareups this year to restrict the market from going all-in on risk loving trades like FX carry. Zooming out, the big picture chart is not scary either. If anything, it’s just starting to break out.
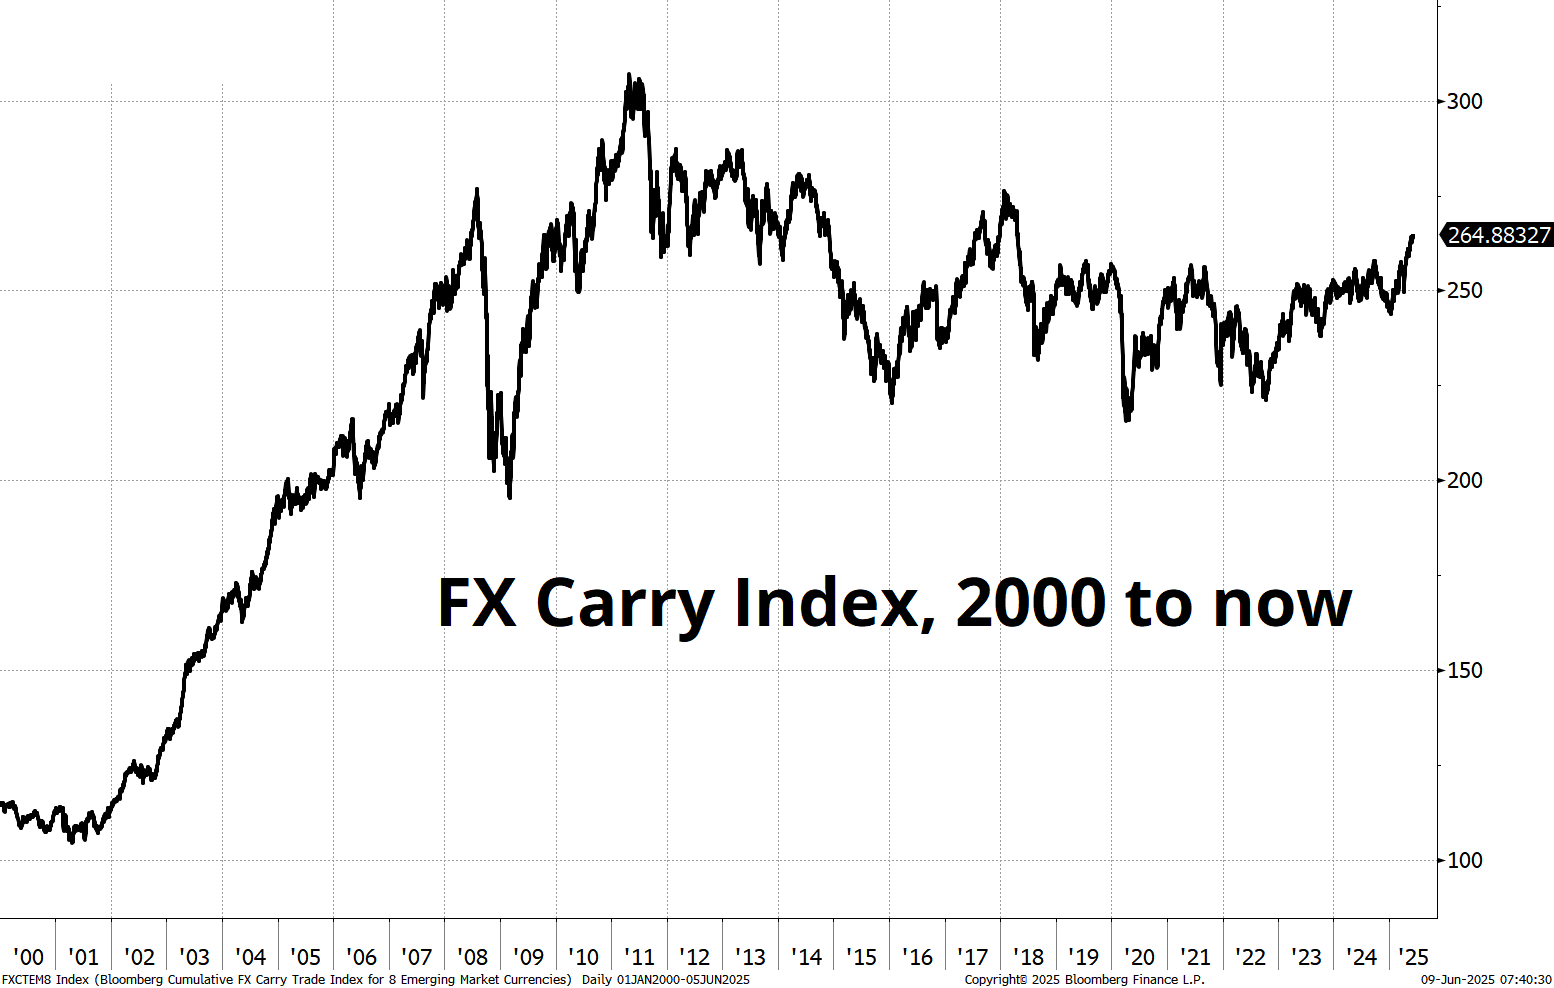
Also, note that the big USD down regime from 2002 to 2007 was absolutely epic for FX carry. USD down and low volatility are great for FX carry, though the big difference then versus now is that the US economy is fine right now (it was in recession in 2002/2003) and global growth isn’t great (it was booming 2002 to 2007). To get more juice from FX carry, you would hope the rest of the world outperforms the US (economics and stock performance).
The next signpost for where we’re headed on risk positive trades is the outcome of the China/US talks currently underway in London, but I will say that market beta to trade war headlines has dropped significantly. The market just doesn’t really believe that deals are real, threats are legitimate, or tariffs rates today will be tariff rates next month. As such, announcements of truces, reprieves, flip flops, or reversals are all viewed as temporary and subject to change. So, market reactions to headlines have become much less dramatic. I suppose it’s reasonable to expect the US to take a more hardline approach here as the S&P 500 is back near the highs, but let’s see.
There is a bit of uncaptured seasonality in Initial Claims in the middle of the year. Looking back to 2000, here are the average releases by week of the year. This implies that Claims could be up around 255k this week, and that might not mean all that much. Just FYI.
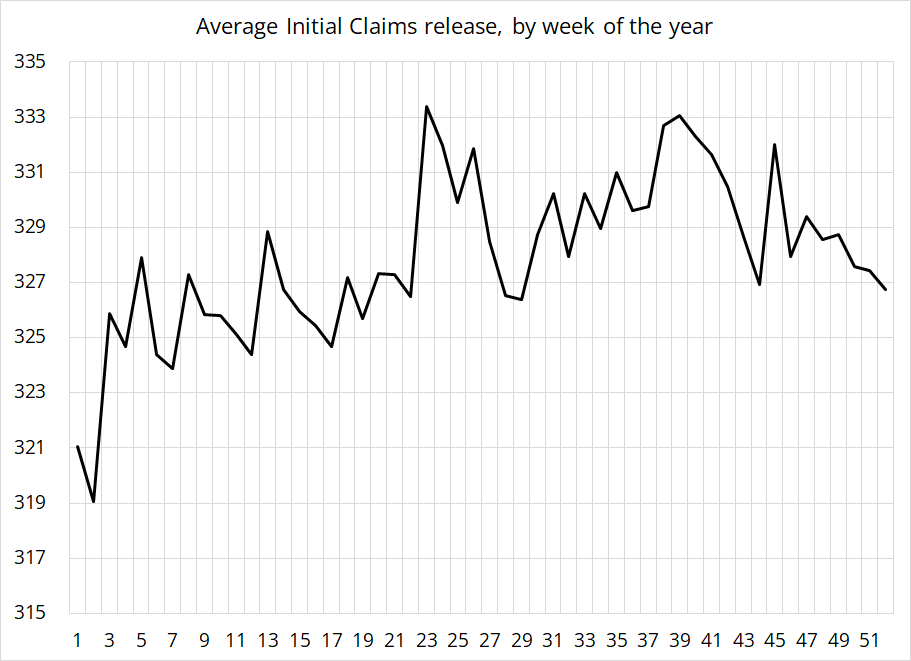
These figures are already seasonally adjusted, but there seems to be an issue with that seasonal adjustment as it fails to capture the persistent rise in claims mid-year. The averages are noisy, so this could also just be randomness.
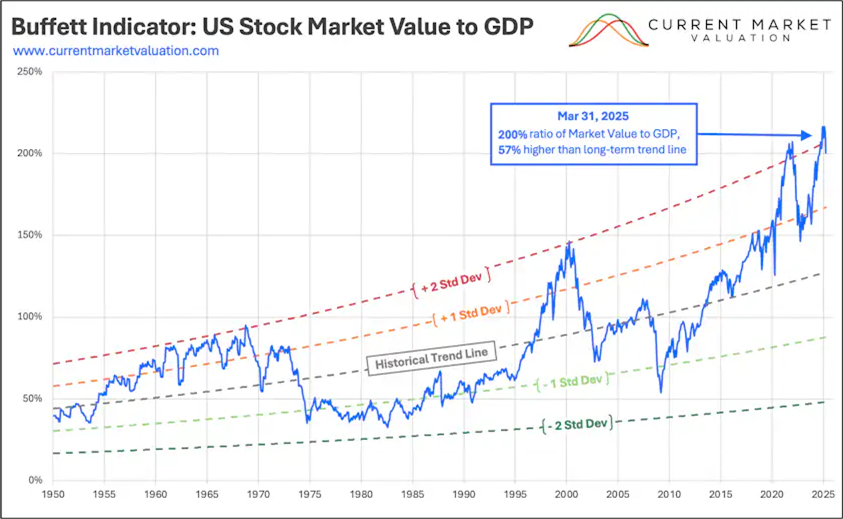
What the ratio fails to capture, however, is profit margins. That is, how much profit do US companies generate per unit of GDP? If profitability rises, the ratio of the stock market to GDP should rise. Stocks would not necessarily be overvalued, they would just be reflecting increased profit margins (a better ability to suck more profits out of a given unit of GDP).
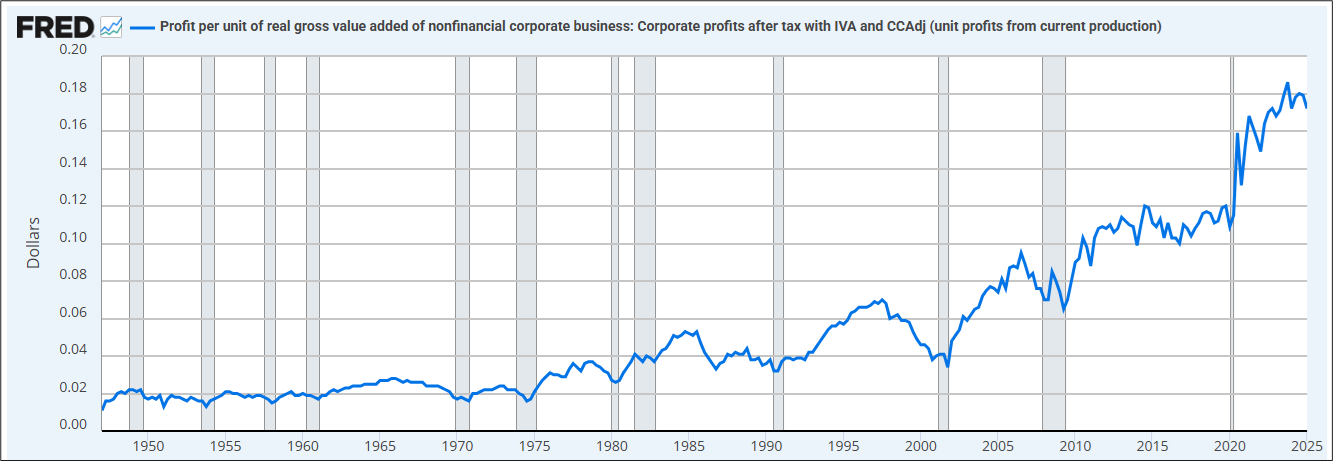
If you look at today’s fact of the day, you see the historically enormous profits currently coming from MAG7 and other companies. And if you look at corporate profitability over time, you will see that it mostly goes up and down with the Buffett Indicator.
US profits per unit of gross value added (nonfinancial businesses)
https://fred.stlouisfed.org/series/A466RD3Q052SBEA
In the 1960s, profit margins rose and so did the Buffett Indicator. In the 1990s, profit margins rose and so did the Buffett Indicator. In 1998-2000, valuations went up as profitability went down and this led to a collapse of the stock market in 2001/2002. Now, valuation is rising in synch with a massive and persistent increase in profit margins.
The fundamental question is: Are profit margins mean reverting? The old school assumption pre-2000 was always that profit margins are fundamentally mean reverting and data from 1950 to 2000 mostly supported this. If they still are, we are in for one heck of a return to the mean! But profit margins have been trending higher for the past 25 years, so maybe tech oligopoly is a persistently high-margin regime that’s here to stay? Anyway, the point here is that the Buffett Indicator doesn’t mean anything. You need to look at profits as a percentage of GDP, not just GDP in isolation.
Have a historically profitable week.
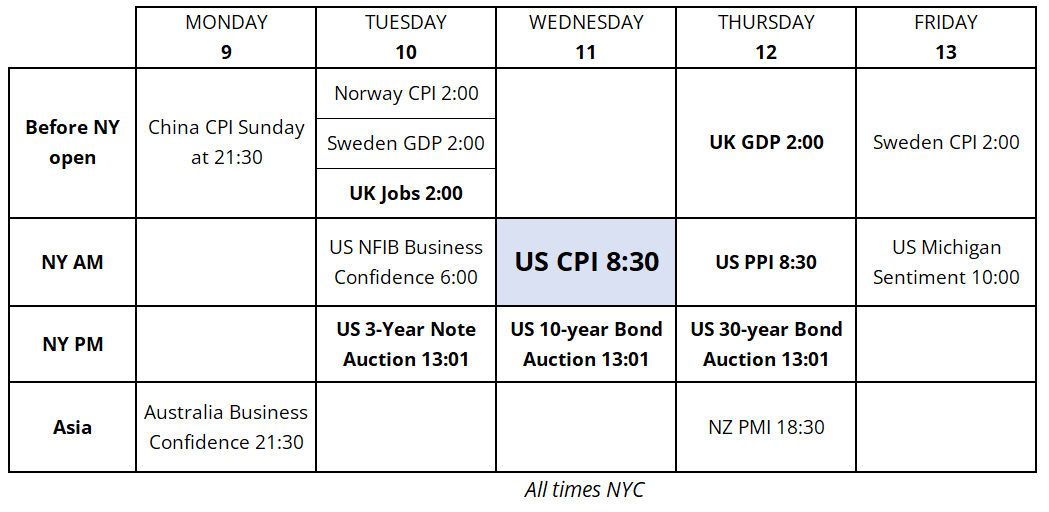
Calendar for the Week of June 9, 2025

US Large Caps, Quarterly Net Income