We have had four main narratives of late but maybe it’s time for a fifth


We have had four main narratives of late but maybe it’s time for a fifth

Long PLN5 @ 1071
Stop loss 964
Take profit 1264
Big week for the US economic outlook as we get quadruple jobs data as it’s week one of the month. This will be a critical week overall for data as the ISM and soft data are sure to mean revert, but the real proof will be in the jobs data. JOLTS comes out first, and it tends to be a hard mean reverter. Last month’s figure was weak / low, so in theory we should expect a higher / stronger number.
If JOLTS comes in weak, that’s super weak because it normally mean reverts. Then, we get ADP Wednesday, Claims Thursday, and NFP Friday. I lean towards weakness in those three as hiring freezes post-Liberation Day should start to emerge as the labor market was already at an inflection point.
As discussed in Friday’s am/FX, Initial Claims are more likely to come in high this week after last week’s 340k print.
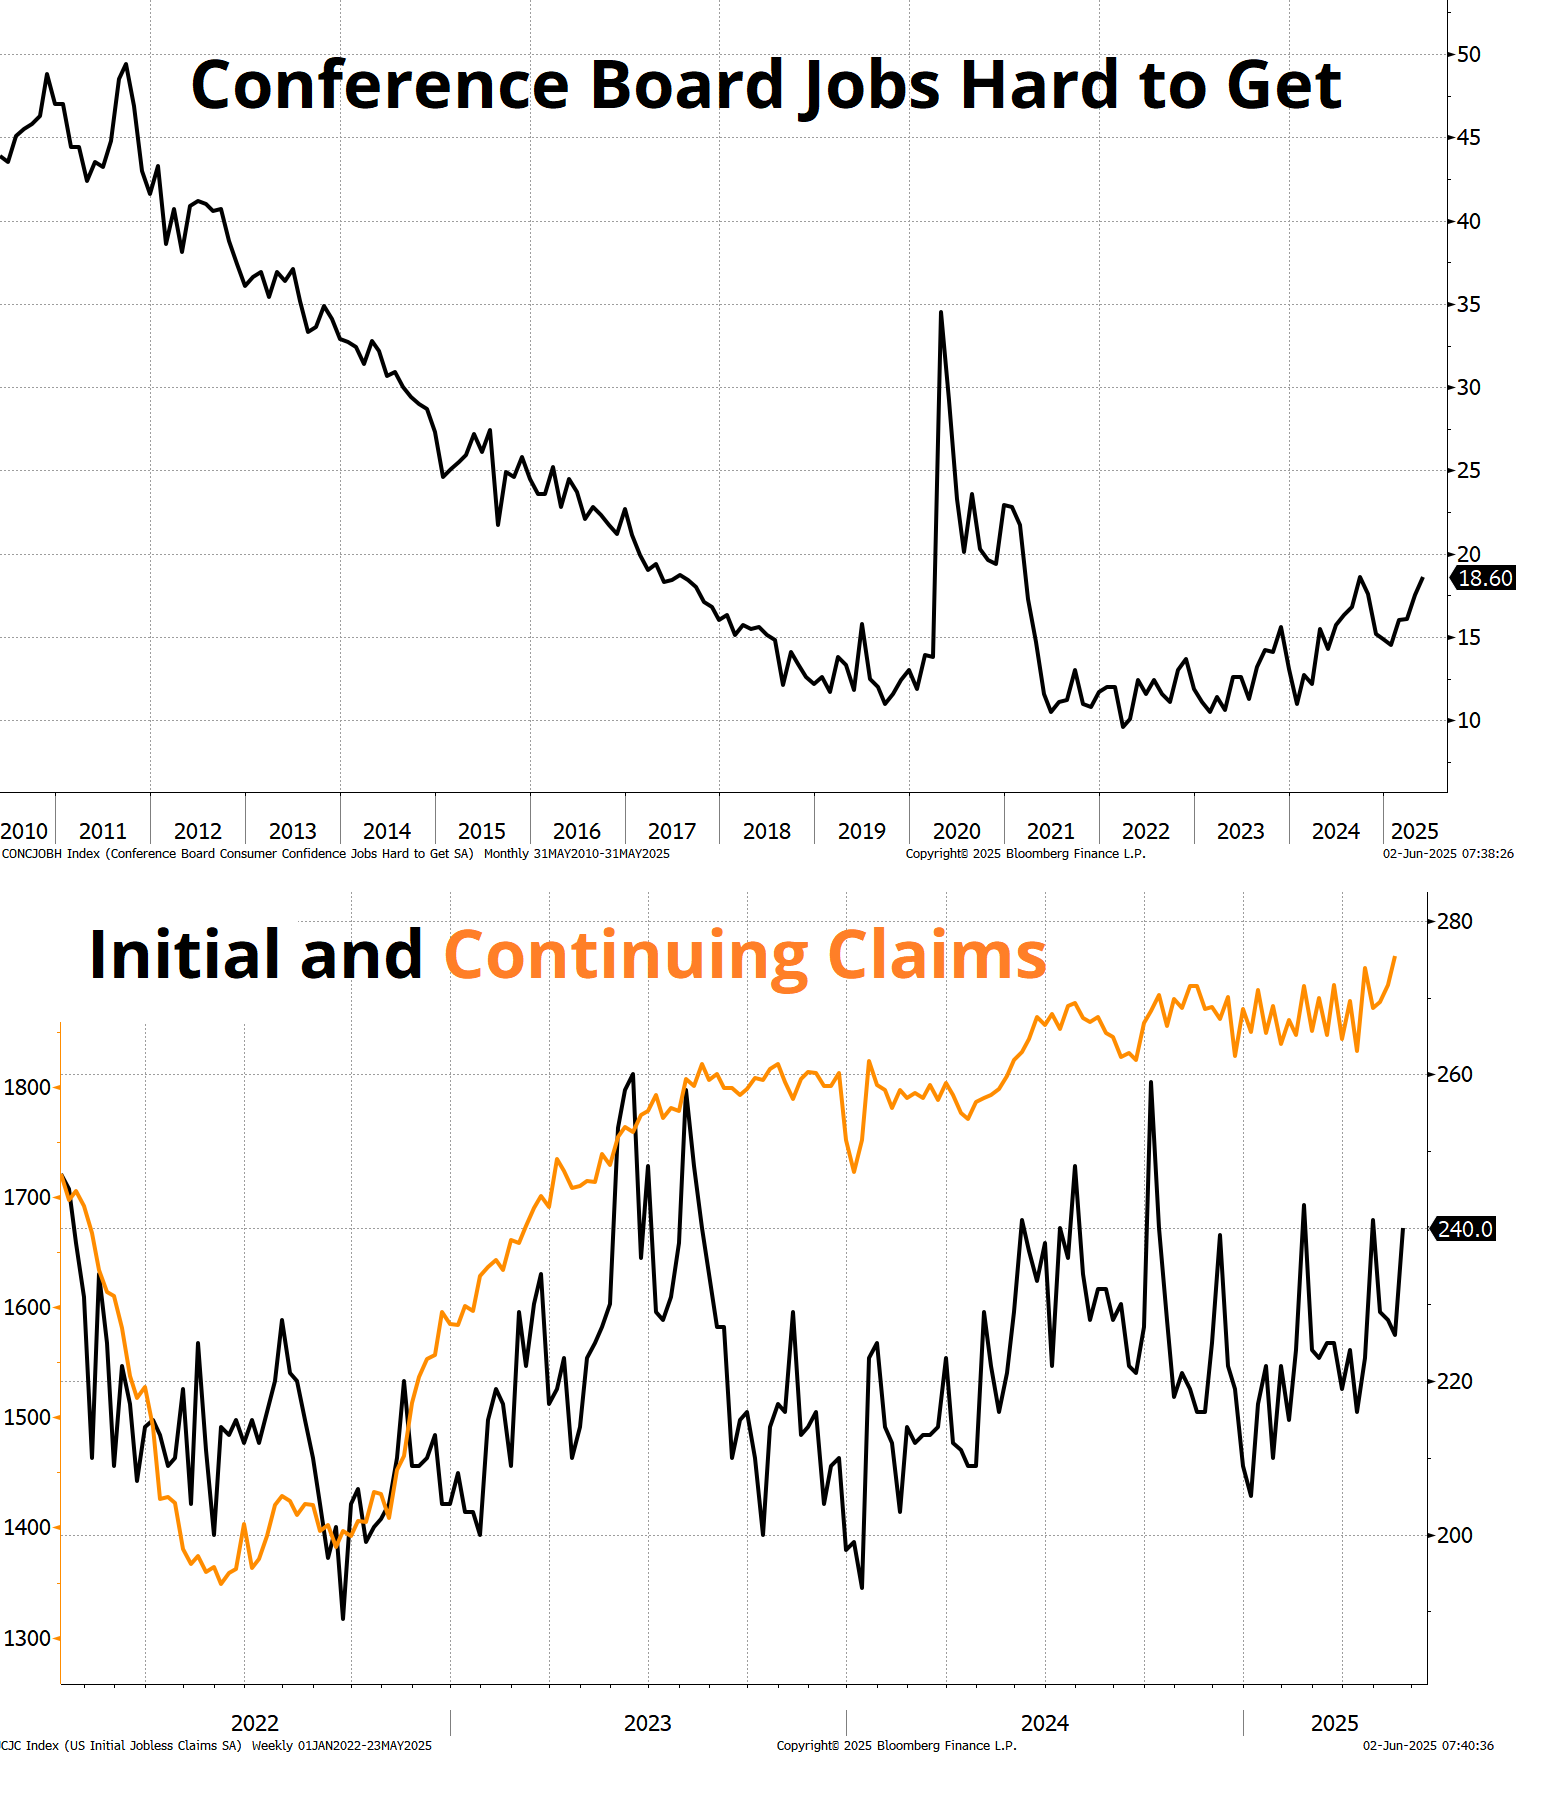
You can see the gradual but unmistakable weakening of the key labor market indices in that two-panel graphic there, and those series tend to lead the unemployment rate by a few months.
Looking back to 1998, there are 325 months total, and 61 of them met the following triple condition, a condition that is currently met:
The Unemployment rate in those 61 months came in higher than previous the previous month on 33 occasions, and lower on just 11. It came in unchanged 17 times. So, I see a skew towards a higher-than-expected Unemployment Rate. And using the same conditions, headline NFP was strong 23 times and weak 37 times, with an average miss of 29,000 jobs. The Conference Board and Initial Claims data are about the best real-time gauges we have for the US labor market, and so it makes sense to expect weaker jobs data this week. The one exception is JOLTS, as mentioned, because of its mean-reverting nature.
Therefore, I think a good strategy is to fade any bond market weakness on strong ISM today or on strong JOLTS tomorrow. The ISM isn’t telling us anything other than the fact that tariff backpedaling improves sentiment. JOLTS is noisy. ADP, Claims, and NFP are the real data points to care about this week.
We are spinning four themes around and around with AI, Tariffs, Tax Cuts, and Bond Vigilantes dominating the narrative. The SELL AMERICA theme is a combination of all four, depending on the vibe. The AI theme (red line in chart) is rather steady but flipped from bullish pre-DeepSeek to bearish afterwards and now back to bullish. NVDA earnings were quite impressive given the China export ban, and while the price action in NVDA wasn’t great on Friday, the overall performance of NVDA and CRWV are bullish. The AI theme and its importance as a driver for MAG7 (which is outperforming again) is not dead.
Meanwhile, the tariffs theme has peaked and there is clearly less and less reaction to each tariff headline. The tariffs are going up and the tariffs are going down, but people are getting bored of it.
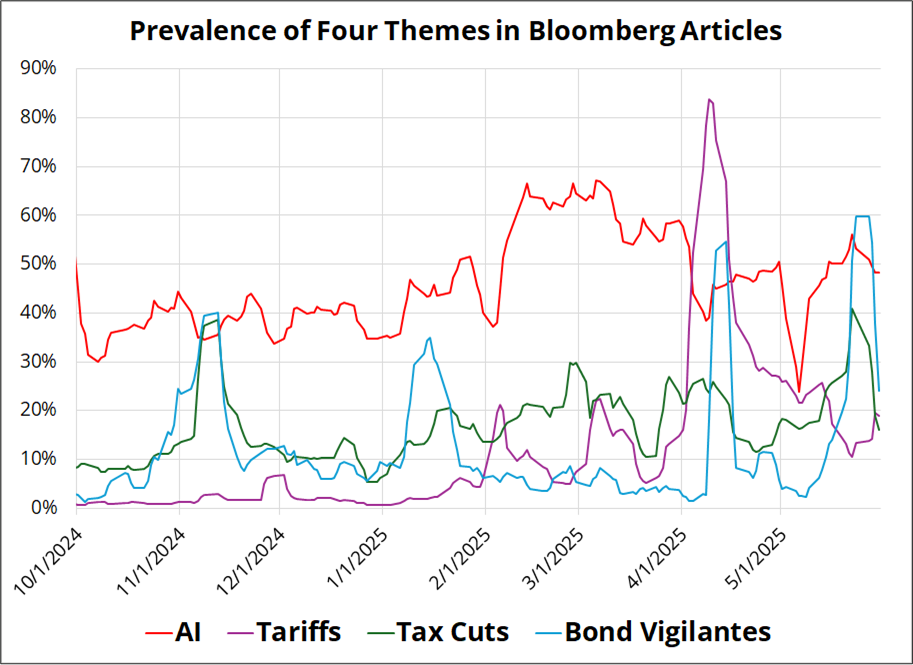
July 9 remains a key date as there has been little evidence of much progress on trade talks. We could get a flurry of deals over the next few weeks as the ticking clock creates urgency for Europe, Japan, and other trading partners. I’m surprised there haven’t been a few deals with countries like Vietnam where announcing a silly, meaningless deal like the one with the UK should have been easy but apparently is not. You can see the tax cut and bond vigilante themes move together, naturally. The market is in limbo for now on the Big Beautiful Bill as the Senate is slicing and dicing it for a while.
While those four themes have dominated since the election, it’s possible that the weakening US labor market emerges as an important theme this week. If it does, that would take bond yields decisively lower. As discussed last week, 4.55% is a big pivot in 10’s.
The BoC meets this week and while economists are split 50/50, some of that is probably just because they don’t update their forecasts very often. The market is priced for a 25% chance of a cut, while I think the real odds are much lower—maybe 10%. There is great uncertainty on the direction of the economy, Core CPI is quite high (and rising) in Canada, and the Bank of Canada is way ahead of the curve and near neutral.
The Bank of Canada estimates neutral to be between 2.25% and 3.25%. The current policy rate is 2.75%, smack dab in the middle of that range. Meanwhile, Core CPI is 3.2% and Trim is 3.1%. Both those figures are above the top of the Bank of Canada’s target range. As a reminder, The Bank of Canada aims to keep inflation at the 2 per cent midpoint of an inflation-control range of 1 to 3 per cent. The Bank of Canada uses measures of core inflation as an operational guide to help achieve the total CPI inflation target. So: Rates are at the midpoint of neutral, inflation is above the top of the band, and uncertainty goes both ways. There is no reason for them to cut this week, in my opinion, and 25% is worth a fade in rates, despite the negative payoff ratio.
Michael Drury, Chief Economist for McVean Trading & Investments, writes an interesting and thought-provoking article every single week. Below, a chunky excerpt from his most recent missive, reprinted with his permission. I like how he explains the rise in personal income, and I find his concern about inflation somewhat out of consensus as most economists seem to be more focused on the “inevitable” drop in US hard data. Mike is looking for sticky inflation and watching closely for the labor market to turn weaker, leaving us with something reminiscent of the 70s. Here’s the key portion of his note.
—
It is raining money in the US economy, and in the early stages of what is likely to be another surge in inflation – everyone’s a winner! (Until they aren’t, but that is a 2026 story). By our estimates, personal income (which reflects $25 trillion of our $30 trillion economy) is running at a 6%+ annual rate in the second quarter. That is more than enough to generate above trend real GDP growth and a hefty 3-handle on inflation, after a 3.7% GDP deflator in the first quarter. The main culprit appears to be government largess – especially in entitlement programs – even before the new budget added higher deficits in 2026 and beyond. We are big believers that inflation is purely caused by too much money chasing too few goods – and it is clear that there is plenty of money, while tariff uncertainty is limiting new investment. That is a recipe for higher consumer prices (with CEOs blaming the tariffs) – but asset prices will go up first, as during Covid.
Personal income rose by an unexpectedly large 0.8% in April, largely due to a little noticed social security give away signed into law by exiting President Biden on January 5, 2025. The Social Security Fairness Act (SSFA) ended the Windfall Elimination Provision and the Government Pension Offset, which had restricted double dipping by pensioners with both government and private sector income. For 3.2 million beneficiaries, monthly payments rose an average $360 – and they were paid back benefits from January 2024. That $360 for 16 months accumulates to $220 billion at an annual rate when paid in one month. Monthly social security transfers rose by 2.4% in January on the annual cost of living adjustment. Since then, they have risen 0.7% in February, 3.7% in March and 6.9% in April – and these are not annualized rates of change! A big drop is coming, likely next month, as the back payments end, but the change has added 1% to the social security baseline (5% of GDP). The $18.5 billion in actual buying power has accrued to mostly public employees (think first responders, teachers and administrators) will likely be briefly saved – boosting asset markets – then spent, lifting nominal GDP. How that splits between real and inflation depends on if more goods and services are available. We guestimate not many more goods, due to tariffs, and about the same level of services, due to immigration reform. That leaves plenty of room for companies to raise prices – and fatten already sound margins to “defend” against tariffs. Let us be clear that we are talking about a higher inflation baseline – probably 3-3.5% — even before contemplating price increases caused by tariffs.
Any weaker data on employment will carry a stronger narrative next week, given the fear that tariffs will slow the economy, even if it is a random walk lower. More importantly to us, any indication that the consumer is moving to the sideline (after an admittedly strong run also assumed due to front running tariffs) means that the recent surge in income is more likely to have ended up driving prices of existing assets higher (remember all this data is in the rear-view mirror by several weeks). The strong rebound in equities prices and the failure of the housing market to completely collapse in the face of the return of 7% mortgages are both indicators that too much money has been chasing too few goods – in this case existing goods. As we learned during Covid, much of the long and variable lag between more money creation (whether from fiscal giveaways or easier monetary policy), is due to the money spinning around in financial markets and driving up prices of existing assets before a wealth effect makes consumers confident enough to spend. However, they will spend if they have money – even when economists say there is going to be a recession.
We are concerned that the current expansion in global stimulus is history rhyming with the 1970s, when those who set monetary and fiscal policy simply were not able to tell us that we have already overcommitted our future income – and so they printed more and more money to avoid disappointing voters who don’t like to hear no. The global economy has long known that it would have to pay public pensions (social security, veterans, rail road retirement etc…) to the swelling baby boom retirees – and that this age group had high voter turnout, so it would be hard to change the rules of the game. The key to affording rising entitlement spending has been less discretionary spending – first with significant erosion of defense spending, and later the Republican revolution locked down growth in federal nondefense discretionary as a share of revenues. The Great Financial Crisis made another contribution with lower interest rates. Now, the US is faced with the aging of the baby boom, higher interest rates, a desire for more defense spending due to China decoupling, and a limited ability to cut non-defense discretionary, as it has already been whittled to the bone.
Trump’s policies address this issue by taking advantage of the US’s preeminent position as the world’s suburbs – and pushes the pain of the US adjustment onto the rest of the world. They will have to bear more of the cost of their own defense. They will have to contribute more to support of US tax revenues via tariffs – which basically means their exporters will have to work for less money. More jobs should be shifted inside the US, reducing entitlement spending and boosting tax revenues. He wants easier monetary policy, as lower interest rates would both relief the Treasury’s burden and weaken the dollar, making it cheaper to do business in America. Finally, rules for entitlement spending should be tightened so that foreigners and those who don’t want to work are excluded. Unfortunately, this budget discipline is undermined by a dedication to sustaining his earlier tax cuts – and adding even more. Moreover, while reduced contributions to foreign defense spending could cut total outlays, rather the call is to increase the US military. The result is a budget plan that expands debt to GDP from already elevated projections.
In the 1970s, the outcome of spending on both Vietnam and expanding social programs was sustained and rising inflation. It came after a period of strong growth due to the government funded Space Race – and no recession from 1961 to 1969, breaking the one-every-four-year post-war pattern. The US has enjoyed a long expansion since the Great Financial Crisis – even the Covid recession was brief with US growth averaging above potential since 2019 due to aggressive fiscal stimulus. The runaway post-Covid inflation was quelled by higher interest rates in 2022. However, monetary policy eased again in 2024 despite inflation remaining over 2% and the unemployment rate at record low levels – with real GDP running at 2.8%. The market expects even more Fed easing – especially if the tariff uncertainty slows growth to below potential. The Fed’s jawboning currently only delays those cuts due to higher one-time inflation shocks from tariffs.
As in the 1970s, the expectation is that growth will cover all sins. The return of recession in 1969 erased the budget discipline of the 1960s, with persistent deficits ever since. We still do not expect a recession in the US, largely because we do think its impact can be pushed overseas. However, the rest of the world is increasingly relying on fiscal stimulus to offset the costs imposed by the US. The Germany debt brake is off. China is expanding its federal deficit. In Japan, which led the way down in rustbelt correction – the goal to reignite inflation after years of deflation was successful – and core inflation has resurged to 3.5% after cooling slightly post-Covid. Is this the path for the rest of the world? Will the US keep printing money in competition with the rest of the world to make the dollar weaker – or will Trump’s shift of the US budget burden keep the US at the top of the global heap, even as the cleanest shirt in the hamper?
We think one thing Covid proved is that inflation works out better for those at the top of the income/wealth ladder than for those down below. That seemed the case in the 1970s as well, but wealth was more widely dispersed – and more in real estate than equities. For businesses, inflation creates instant profit, as revenues rise with no immediate cost increase. Yes, input prices rise in time – but short run, increased liquidity creates a fatter stream of costless cash flow. Even if interest rates are rising, credit demand is not. Liquidity allows capital investment for more profit growth, which eventually trickles down to compensation and spending. Competition from new investment reduces the ability to raise prices – and the invisible hand allocates as best it can (there is always government interference).
In today’s investment environment, liquidity gravitates to technology. Even increased defense spending really means technological advances, not military personnel. That favors the technology leader – the US. Unfortunately, that also suggests that a little inflation doesn’t hurt – so a little more would be alright too, huh?! Bottom line, we are far less sure than the Federal Reserve that the inflation anchor is firm. Covid weakened global fiscal discipline, and central banks seem less independent from their fiscal masters around the world.
—
End of excerpt
Waller delivered a speech this weekend. It does not cover much new ground, but if you want a good description of where he’s at, and where he’s been at for a while, you can read it here.
https://www.federalreserve.gov/newsevents/speech/waller20250601a.htm
Key paragraph:
In conclusion, given my belief that any tariff-induced inflation will not be persistent and that inflation expectations are anchored, I support looking through any tariff effects on near term-inflation when setting the policy rate. Fortunately, the strong labor market and progress on inflation through April gives me additional time to see how trade negotiations play out and the economy evolves. Assuming that the effective tariff rate settles close to my lower tariff scenario, that underlying inflation continues to make progress to our 2 percent goal, and that the labor market remains solid, I would be supporting “good news” rate cuts later this year.
Have a day free of false precision.
Trading Calendar for the Week of June 2, 2025
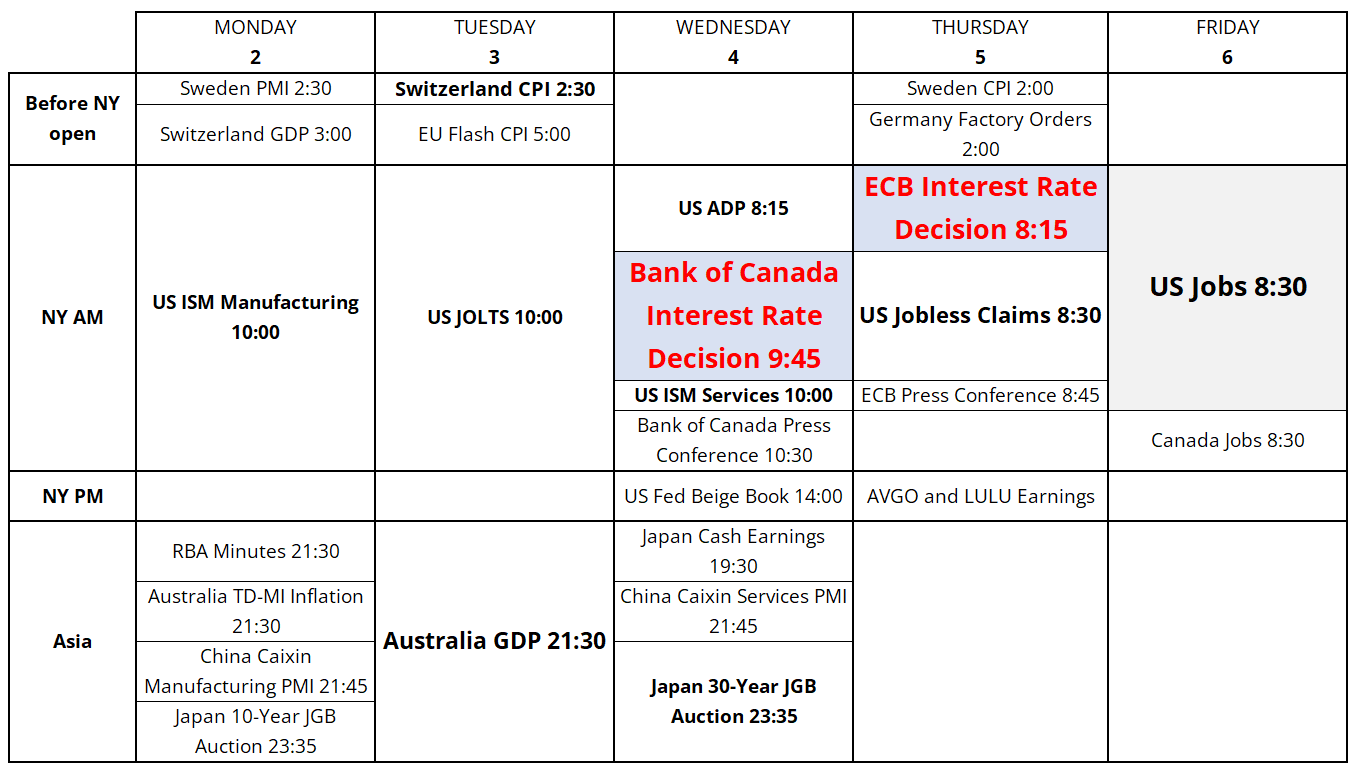
Notes (I will elaborate on these in am/FX throughout the week):
https://x.com/jamonholmgren/status/1927246358592839991?s=51
Tell me you don’t understand false precision without …
