I am excited to see what Chris Waller has to say
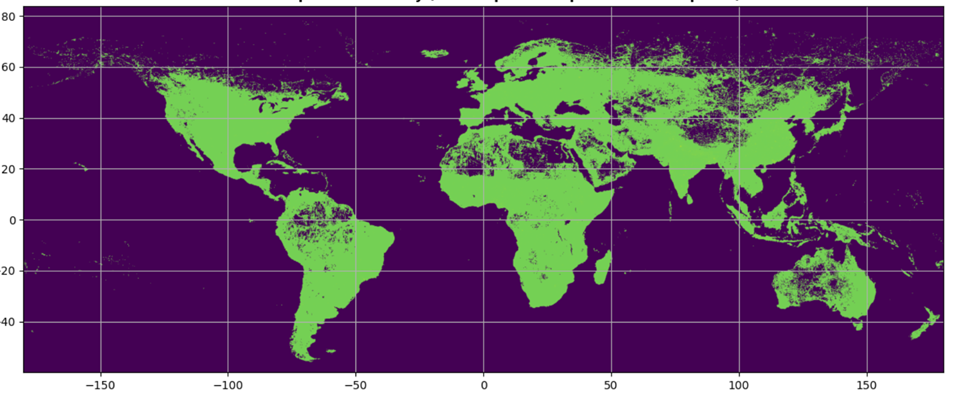
A map of inhabited Earth (green pixels = inhabited)
The world is split into pixels 400km2 wide.
Pixel is green if population > 0 and purple if population = 0

I am excited to see what Chris Waller has to say

A map of inhabited Earth (green pixels = inhabited)
The world is split into pixels 400km2 wide.
Pixel is green if population > 0 and purple if population = 0
Short EURUSD @ 1.1729
Stop loss was 1.1867, now 1.1767
Take profit 1.1511
Short TNA @ 64.60
(the 3X small cap ETF)
Stop loss was 69.11, now 67.81
Take profit 57.57
Long GCQ6 at 4610
Stop loss 4294 Take profit 5320
Given my short time horizon (average holding period 10 days, approx.) it’s not super common to have three trade ideas in the sidebar at once. I got a few questions about why I am long gold and short EURUSD at the same time given the standard correlation is thought to be USD up = gold down. Here is the answer.
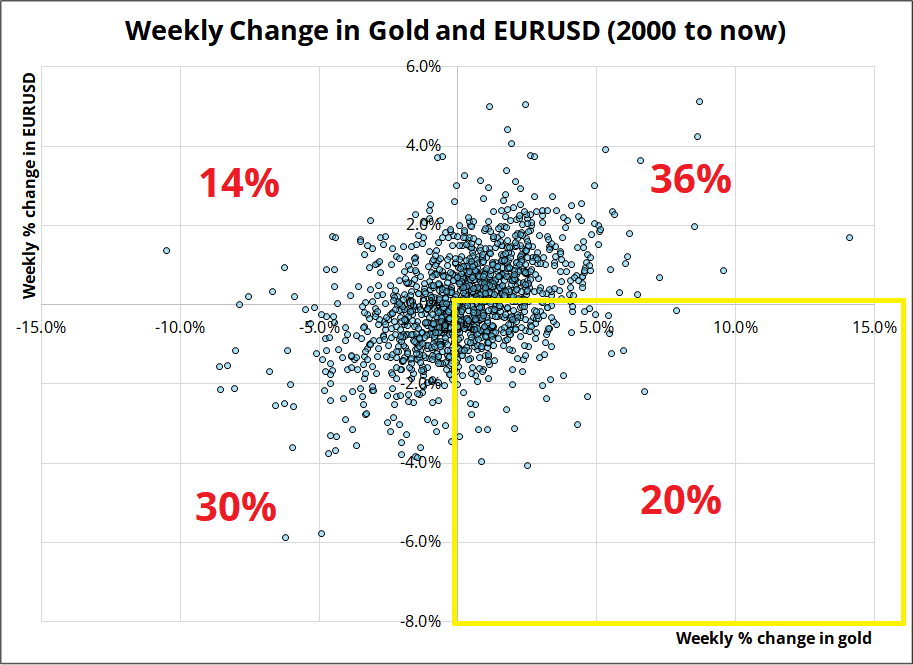
I was curious how the regime of EURUSD down + XAU up was distributed over time, so I made this graphic. It looks remarkably similar to a UPC code.
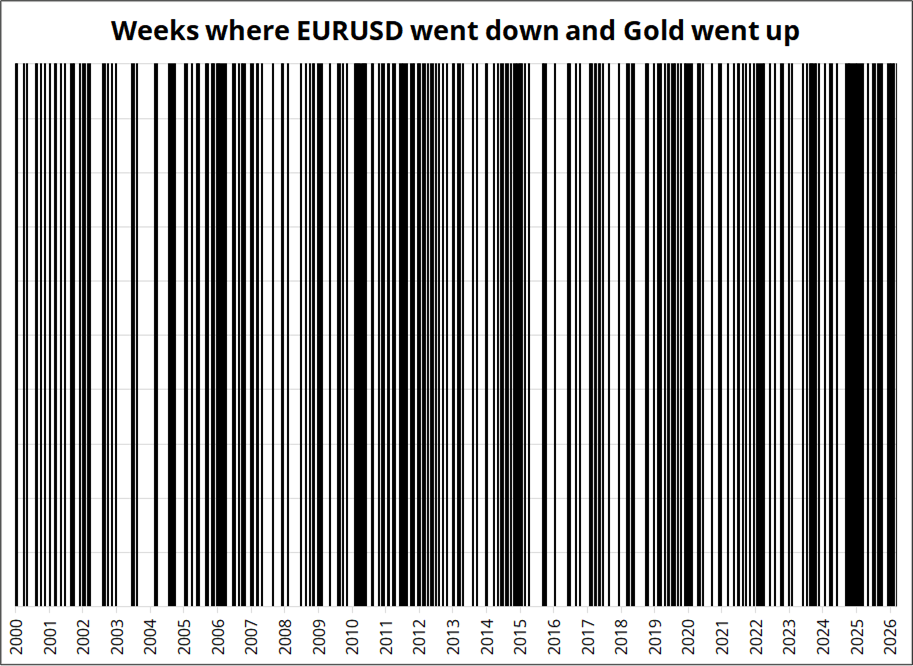
A few things that stand out here (the dense/dark zones):
Meanwhile, the short small caps trade is working fairly well so far. I am moving my stop loss on the EURUSD trade lower as it has captured about half the hoped-for move, and I don’t think the original stop is logical anymore. If we get above 1.1700/50, the idea is probably wrong at this point. As always, see sidebar for details on open trades.
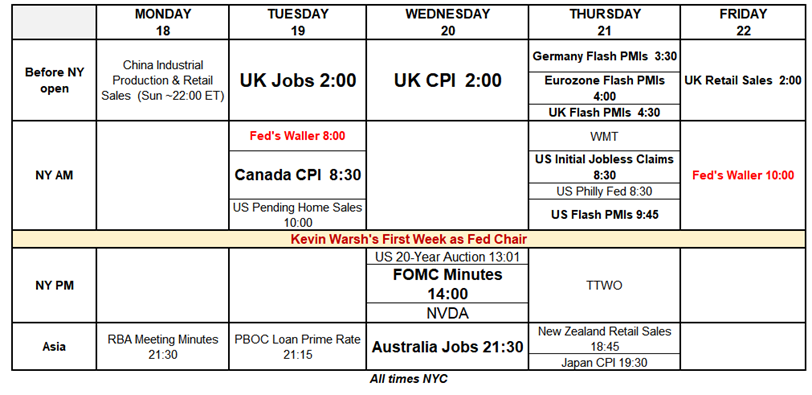
When I made the calendar last week, there was no sign of Waller on Bloomberg’s calendar. Now, he is scheduled to speak twice this week. I believe Waller’s two appearances are the most important events this week. If he flips hawkish, that’s a game changer. If he embraces a very dovish track, that is too.
On April 17, he described a prolonged conflict as a tricky scenario but never mentioned anything about potential hikes. Let’s see what he says this week. The Tuesday appearance is a panel slot, and the Friday one is most interesting as it’s a full-on speech covering the economic outlook.
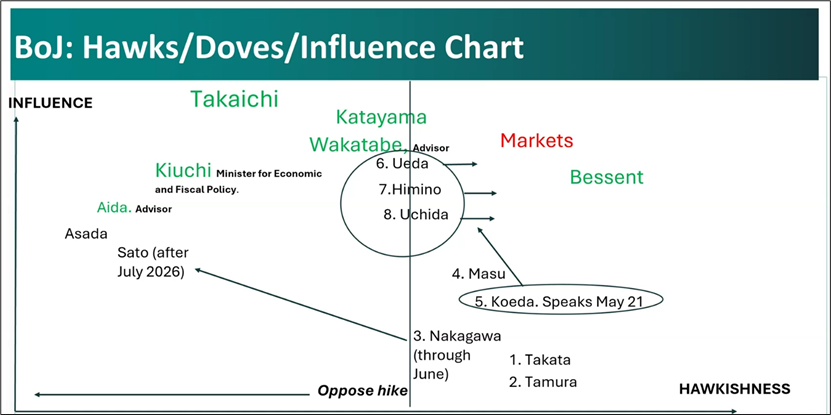
A useful chart from Simon Flint. Koeda likely to become the decisive vote for a hike in her speech on May 21.
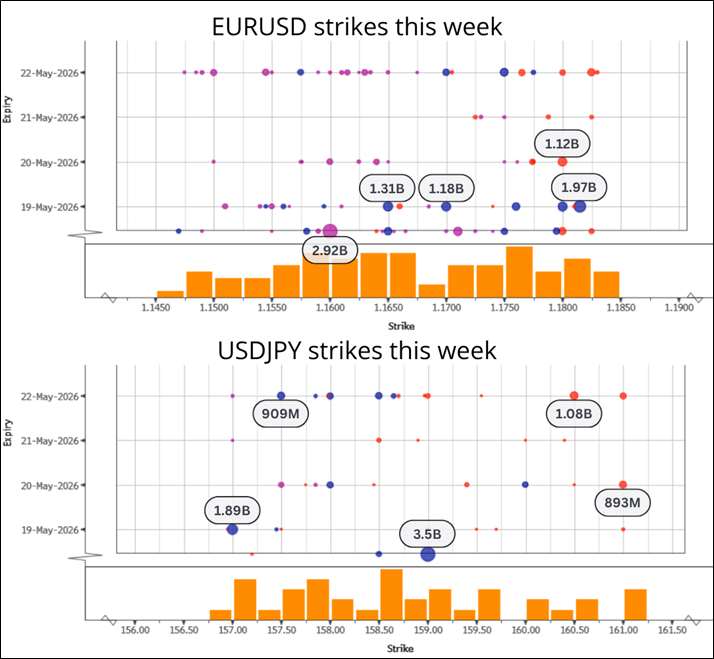
As we get closer to 160.00 in USDJPY, one must assume intervention is on the table again. The MOF is fighting a losing battle vs. macro right now as bond markets fall and U.S. exceptionalism returns.
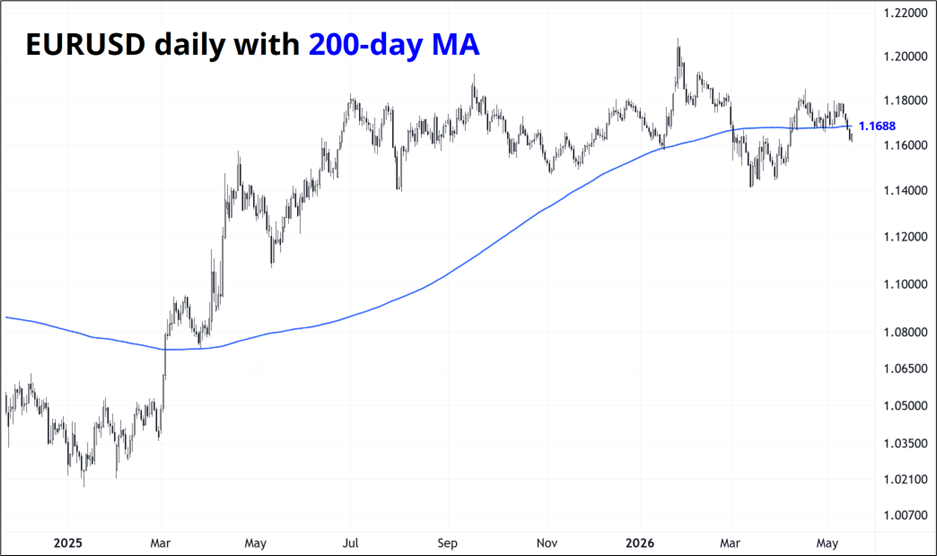
1. Ideally, EURUSD should not go back above 1.1700. The 200-day has been a good pivot.
2. Article on Burnham’s chances of winning the by-election in the UK.
3. Polymarket odds of Burnham winning the by-election.
4. China data was not good.
Have a green week.
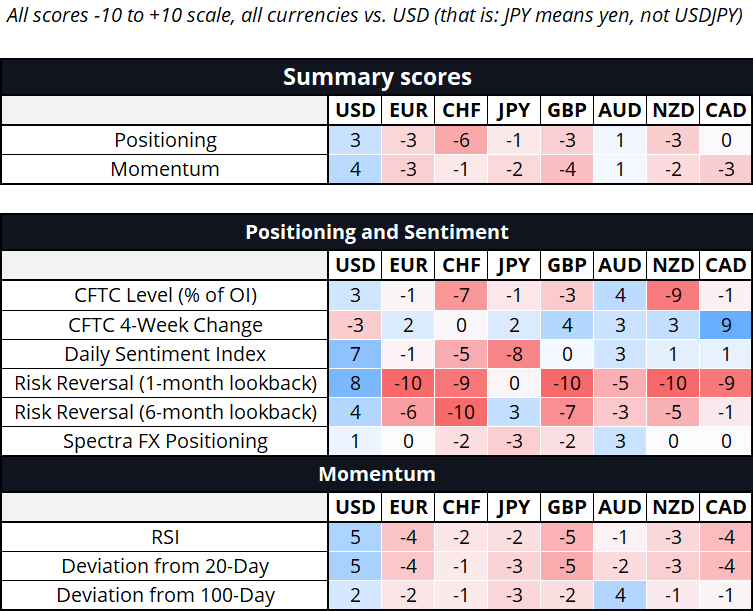
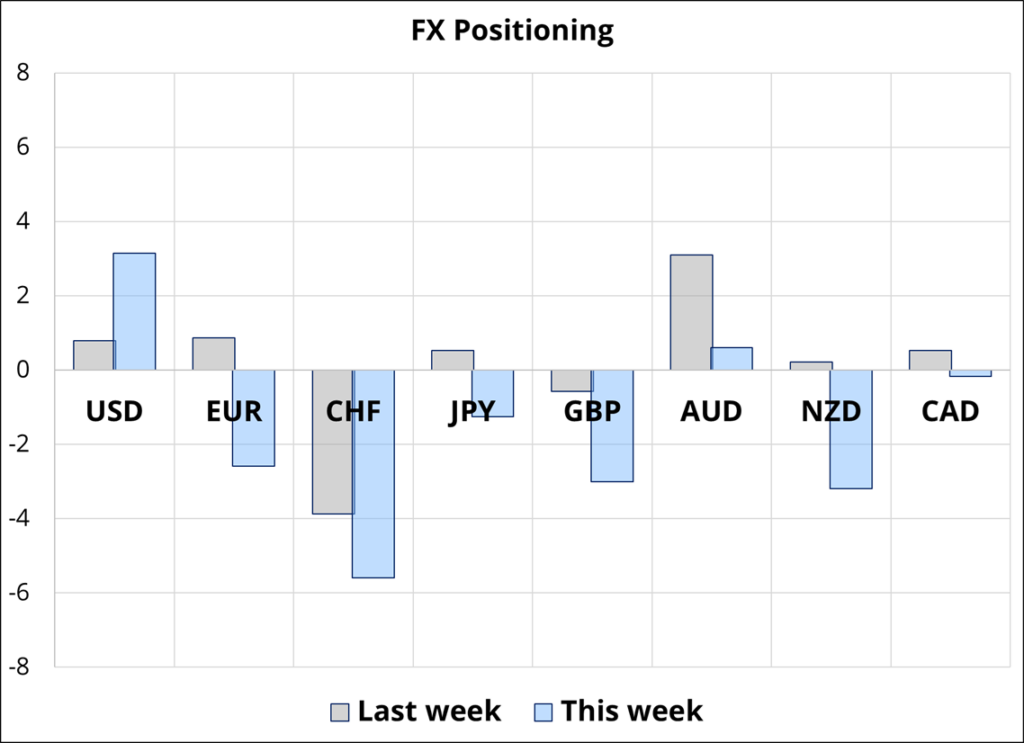
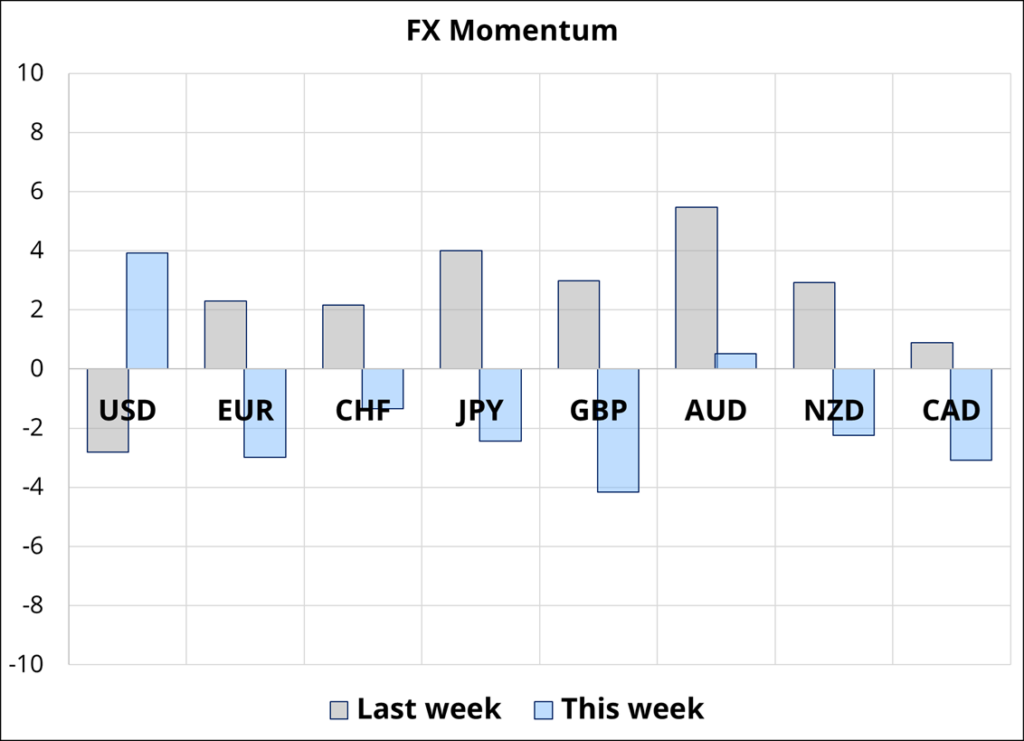
Hi. Welcome to this week’s report. (To read about how I use and trade this report, see here.) Our positioning report shows the market has now clearly gone long USD as the Fed story heats up with hikes priced in over the next 12 months. You can see a lot of red in the risk reversal zone there as options markets have moved meaningfully away from preferring USD puts to a preference for USD calls. In GBPUSD for example, the options market was bid for GBP calls in January while 25-delta puts are now bid 1.2 vols over calls. Spec volumes remain low in G10; the interest level is maybe 3 out of 10.
A map of inhabited Earth (green pixels = inhabited)
The world is split into pixels 400km2 wide.
Pixel is green if population > 0 and purple if population = 0