Interconnected, government-backed flywheels drive everything
If you are ever feeling down about a creative project, ChatGPT can help.
Sycophant that it is.

Interconnected, government-backed flywheels drive everything

If you are ever feeling down about a creative project, ChatGPT can help.
Sycophant that it is.
Flat
Everything is a procyclical flywheel right now.
Government invests in INTC while negotiating with China and NVDA over chip exports. Government allows NVDA to sell chips to China. NVDA invests in INTC.
President issues cryptocoins and supports crypto industry, pumping crypto prices. Crypto DATs issue stock to buy crypto. Crypto rallies. Crypto DAT stocks rally. Crypto DATs issue more stock to buy more crypto.
Government picks ORCL, OpenAI, and SoftBank for Project Stargate. ORCL secures stockpile of NVDA GPUs. ORCL signs non-binding $300B deal with OpenAI. Government signs deal with China to give TikTok to ORCL and OpenAI investor Andreesen Horowitz.
US tech stocks rally, weight of US stocks in MSCI World goes up. Global investors can’t afford to go off benchmark and thus buy more US stocks. US stocks rally, increasing their weighting in MSCI World. Passive investors buy more tech stocks.
All these flywheels are interconnected. What is good for NVDA is good for OpenAI and what is good for ORCL is good for META, GOOG, MSFT, AMZN, and AVGO. These self-reinforcing loops continue to feed directly into one another.
There is no reason to fight the power as this system is self-reinforcing and government-backed. Until the day Mark Zuckerberg or Jensen Huang stand at the podium and say that AI Capex has peaked, Chuck Prince has it right. Keep dancing.
Unfortunately for the always-popular short USD trade, all these flywheels generate inflows into the US and make it hard for the dollar to crater. Even a dovish Fed has some positive aspects for the USD as it boosts the continuation of the debasement trade, which reinforces the bullish megatech flywheel. It’s weird.
By forecasting higher growth, above-target inflation, and… More rate cuts, the Fed is openly declaring a run it hot strategy with mega sensitivity to the slightest jiggle in labor markets and zero cares about inflation above target year after year after year. Mike McKee’s question was on point:
“Every year since 2015, your SEP has stated that you would reach your inflation target two years later. And this SEP says your going to… Hit your target two years later. Two percent does not seem to be in sight. Does that suggest that the 2% target is not really achievable and does this present any credibility problems for you in telling people that’s what you’re going to do if you can never reach it?”
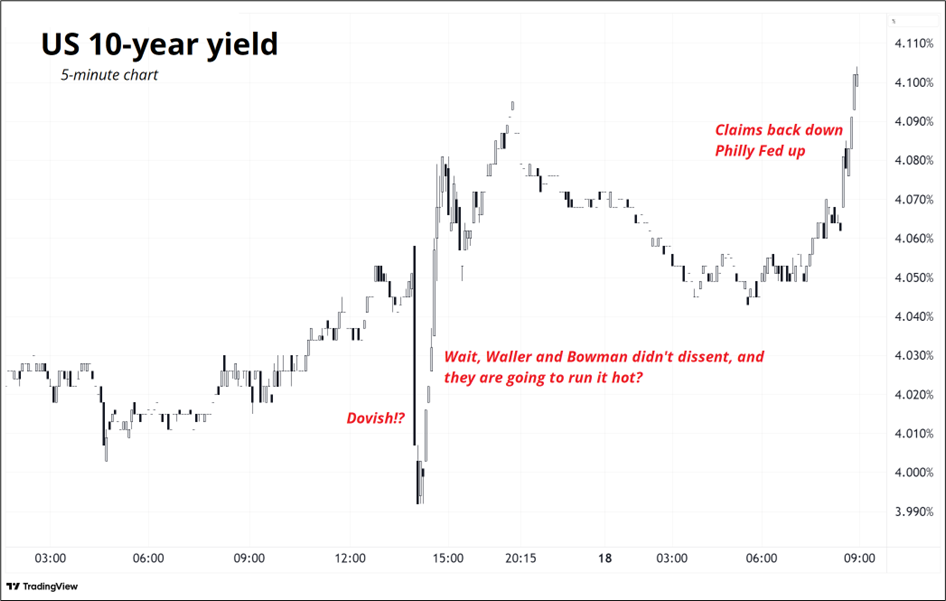
Powell’s response was: “Nobody knows where the economy is going to be in three years.” I mean. What are we doing here? There was a sense that Waller and Bowman opting for 25 basis points helps the Fed’s credibility a bit, but my feeling is that the projections and the policy are so disjointed now that we can safely say the inflation target is pure theater. I am even more confident than ever that 3% is the new 2%.
As I have been saying for a while, this is all only really interesting if the US economy remains solid or heats up. If it cools and unemployment rises and spending falls, the Fed will keep cutting and they might go a bit more than is priced in, or a bit more than they would have sans government intervention, but it won’t be all that exciting.
BUT! If inflation has based at 3% and heads towards 3.5%, the policy mix is wildly off base. Let’s see.
The bond market is not fully onboard with the Fed’s rate cut prescription as we have bounced pretty hard off 4.00%. The kneejerk market reaction to FOMC was kind of weird to me as we went in thinking Bowman and Waller might dissent, and they did not, and a Fed explicitly projecting a “run it hot” regime isn’t really great for bonds.
Now that we rejected the 4.00% area, the line in the sand for bond bulls is 4.20%. If we get up through that, it’s a mega rejection on high volumes and things could get zippy. I think silver and gold will be highly vulnerable in that situation, as they already trade a bit wobbly. I would also expect stocks to correct pretty aggressively if 4.20% is broken and I suppose this could coincide with the Week 39 bearish seasonality? Chart of the 10-year yield here.
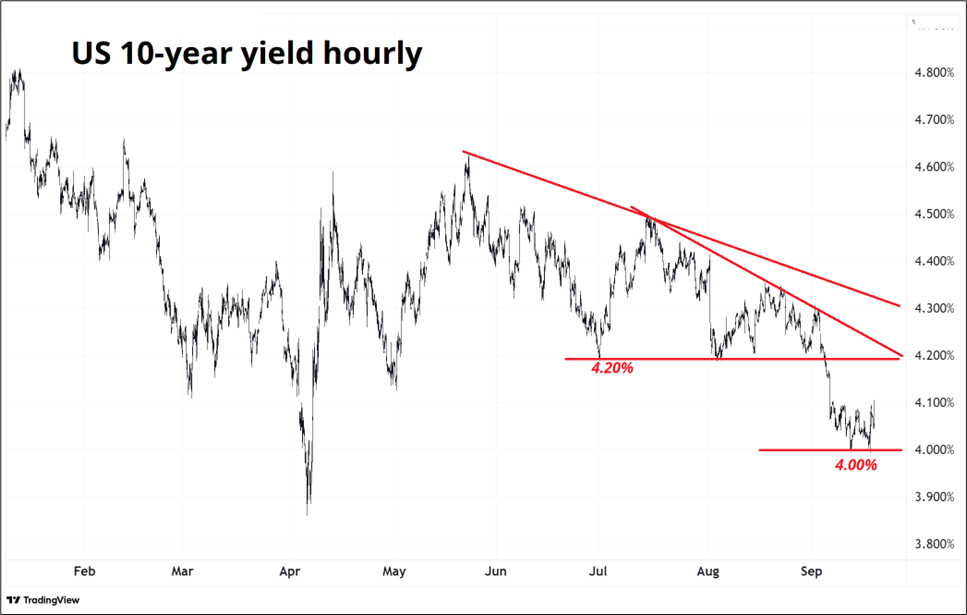
Note the old broken support and the descending trendline both come in right at 4.20%.
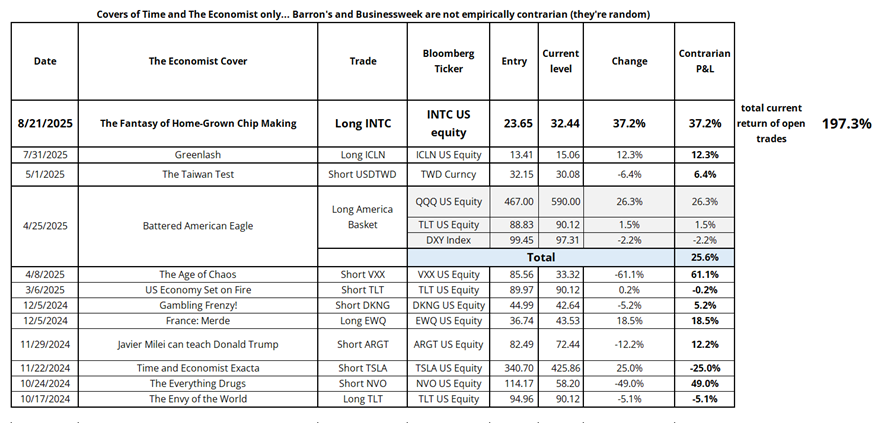
The Economist Costanza trades continue to perform incredibly well. A few weeks ago the magazine published a cover casting doubt on the Intel deal.
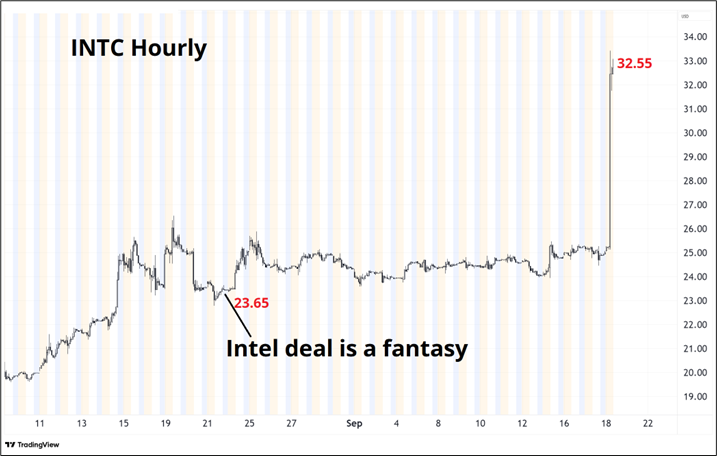
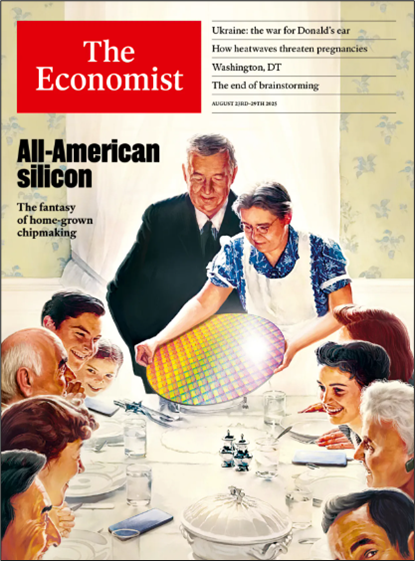
This is not hindsight or cherrypicking. I tweeted it the day after the issue came out. If you are not familiar with the empirical evidence behind the Economist as a reverse indicator, please see here. Some had asked me if the recent AI cover from The Economist is a signal, but my answer is no. The cover is not clearly positive or negative and the first rule of this thing is that the cover has to be unambiguously directional.
Here is the latest portfolio update. Trades are all reported on Twitter in real time. No cherry picking, no hindsight.
Have a backslapping day.
If you are ever feeling down about a creative project, ChatGPT can help.
Sycophant that it is.
