Betteridge
A comical but accurate law that is not actually a law is: Betteridge’s Law. It’s a useful heuristic when consuming financial media because the best way to put forth a visceral clickbait headline that is intentionally sensational is to simply pose a question. Here’s the full definition from Wikipedia:
Betteridge’s law of headlines is an adage that states: “Any headline that ends in a question mark can be answered by the word no.” It is named after Ian Betteridge, a British technology journalist who wrote about it in 2009, although the principle is much older. It is based on the assumption that if the publishers were confident that the answer was yes, they would have presented it as an assertion; by presenting it as a question, they are not accountable for whether it is correct or not.
It came to mind as the AFR ran this:
And Noah Smith ran this:

Is Japan facing an awkward situation after intentionally devaluing its currency from 75 to 160? Yes. Are they showing a new generation of economics students how the trilemma works? Yes. Is it a currency crisis? No.
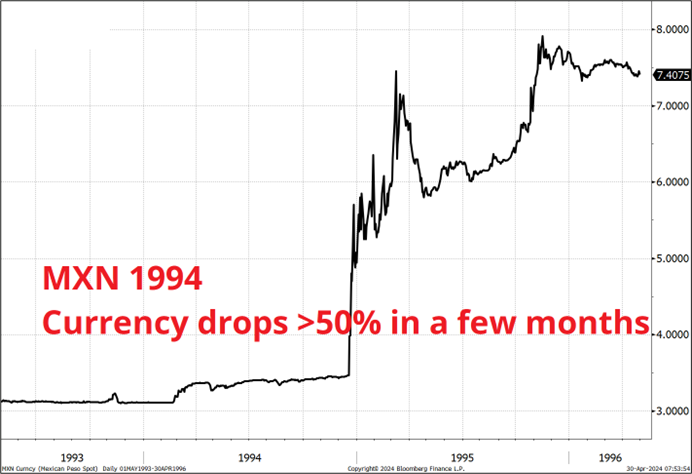
For context, here’s what a currency crisis looks like. A 50% drop in the currency in 6 months, and 10% inflation YoY in Thailand in 1997. A 50% drop in the currency in a few months, and 50% YoY inflation in Mexico in 1994.
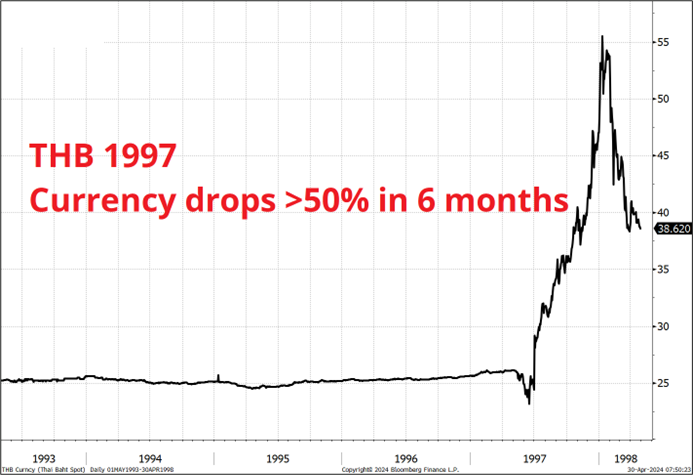
The JPY has dropped 6% in the past 6 months and Tokyo YoY inflation just clocked in at 1.8%.
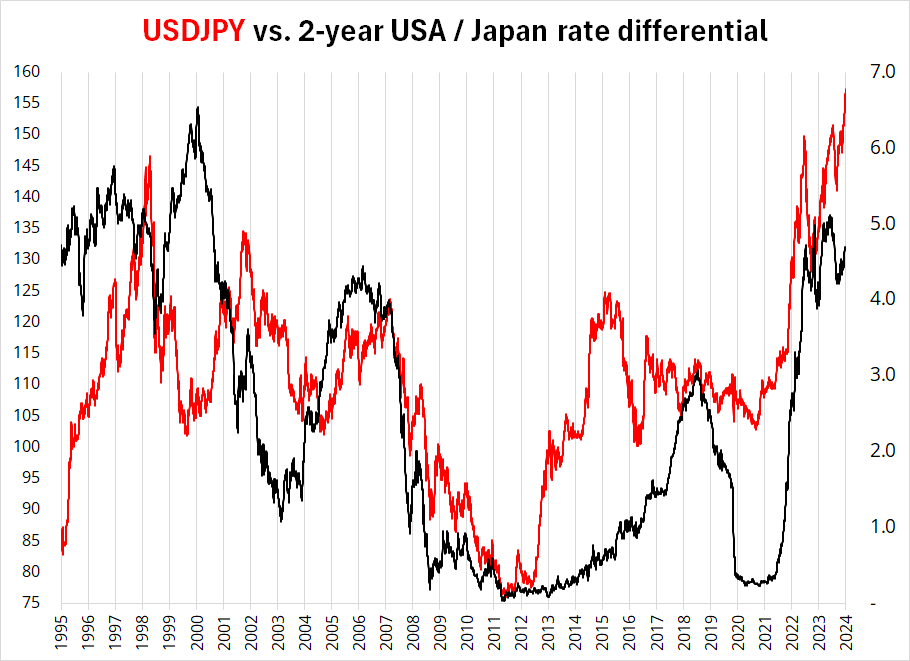
While I have been wrong on the intervention timing and level, I am still skeptical of any sort of out-of-control collapse of the yen. The trilemma issue is that the BOJ is loose and therefore the currency must depreciate. That’s fine.
All the MOF can do is buy time and hope for lower US yields. But without getting into the real vs. nominal FX rate and all that, here’s USDJPY and the 2-year rate differential going all the way back to the start of my career. You can see that the 2-year rate differential (the black line) is nowhere close to the all-time extreme. So yes, the trilemma is in play here, especially with YCC adding to the story, but it’s not like we are in unprecedented territory.
Meanwhile, if you are into behavioral finance, we have now ticked all four boxes you see at the extremes.
- Crisis language and doom and gloomers getting busy
- Wild, extrapolation-style price targets.
- Memes
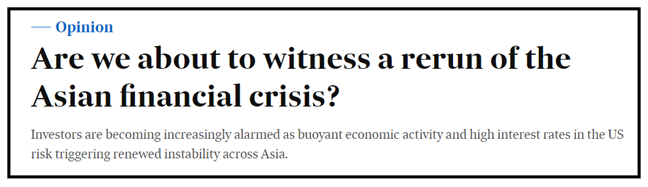
- The Economist enters the fray.
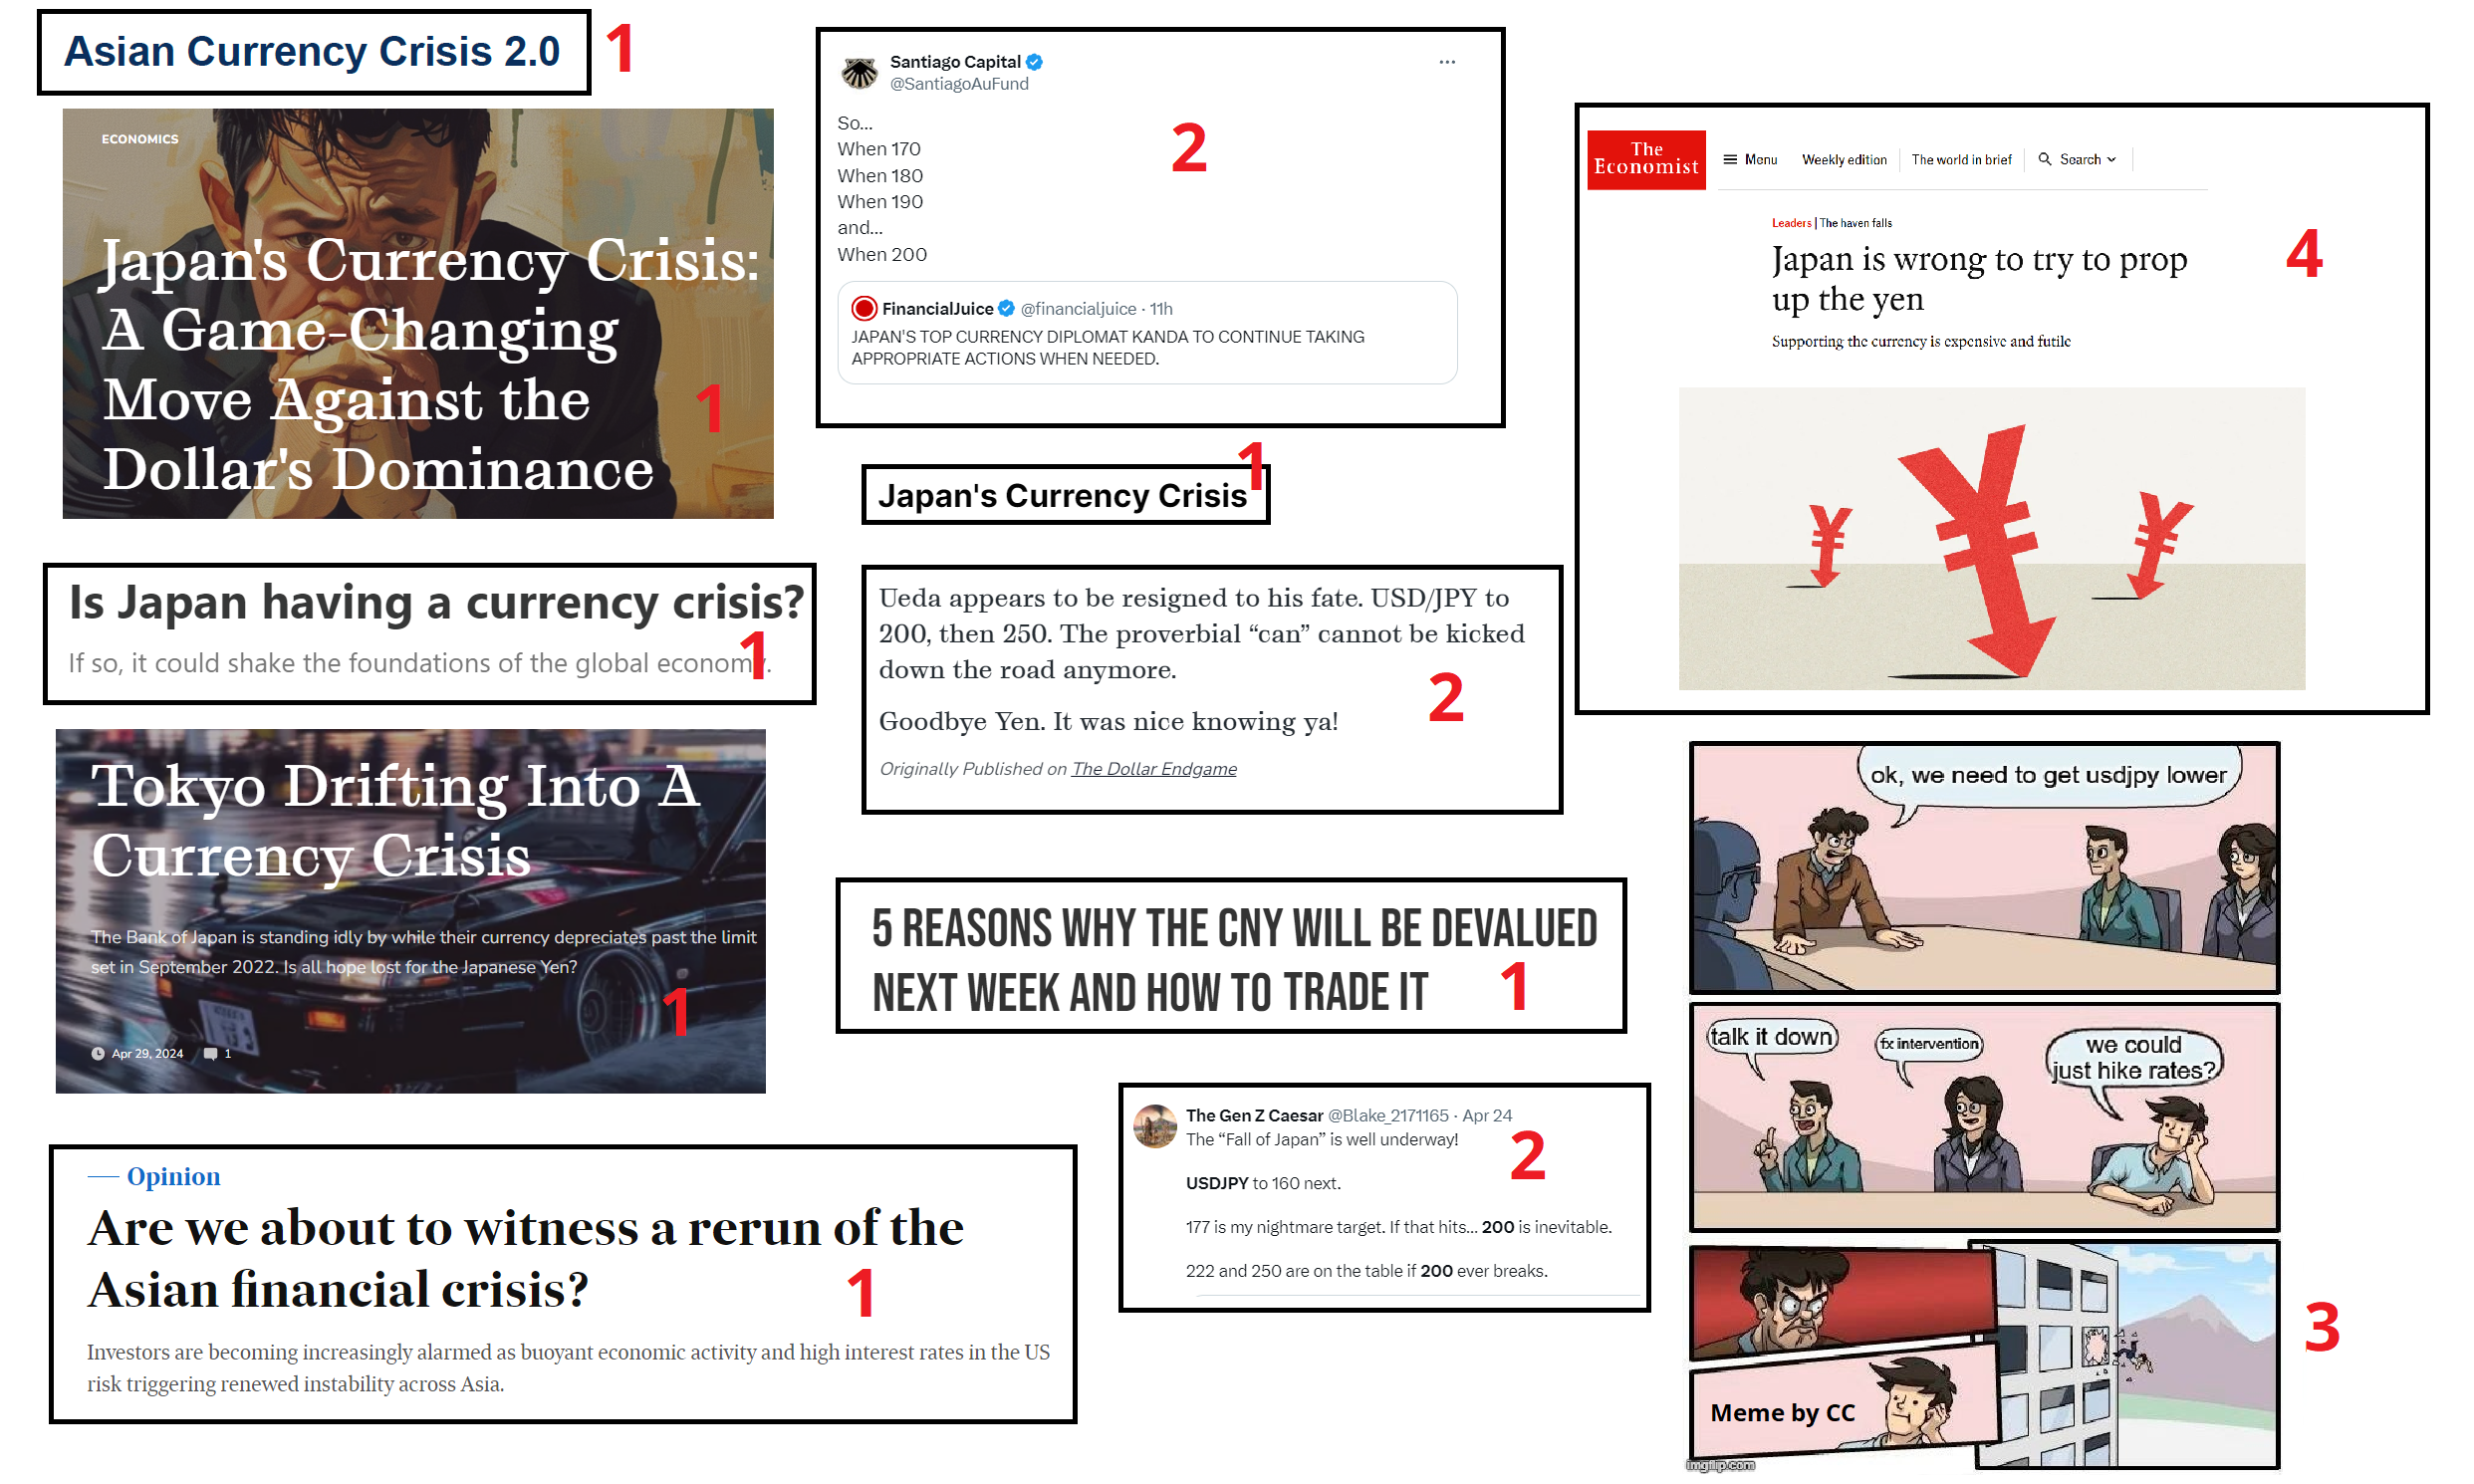
All those headlines and images are from the last 7 days. None of this means that USDJPY needs to peak right here, but they are clear signs that we are now in the hysterical phase.
I wish this “Brent” guy would stop talking about copper
A few people sent me the CFTC positioning data for copper. Thank you! It shows a large buildup of copper longs, adding to my thesis of copper lower now ‘til May 31. One last thing and then I’ll stop talking about copper so much. A momentum indicator I use for overbought and oversold is called The Deviation. I have written about it in two of my books because I find it simple, intuitive, and useful. It measures the distance between spot and the simple 100-hour MA. The measure tends to top and bottom at similar levels unless the security or asset enters a completely new volatility regime.
In the case of copper, it tends to peak around 4% above the 100-hour. In this case, the peaks have been lower and lower, which indicates waning momentum or divergence.
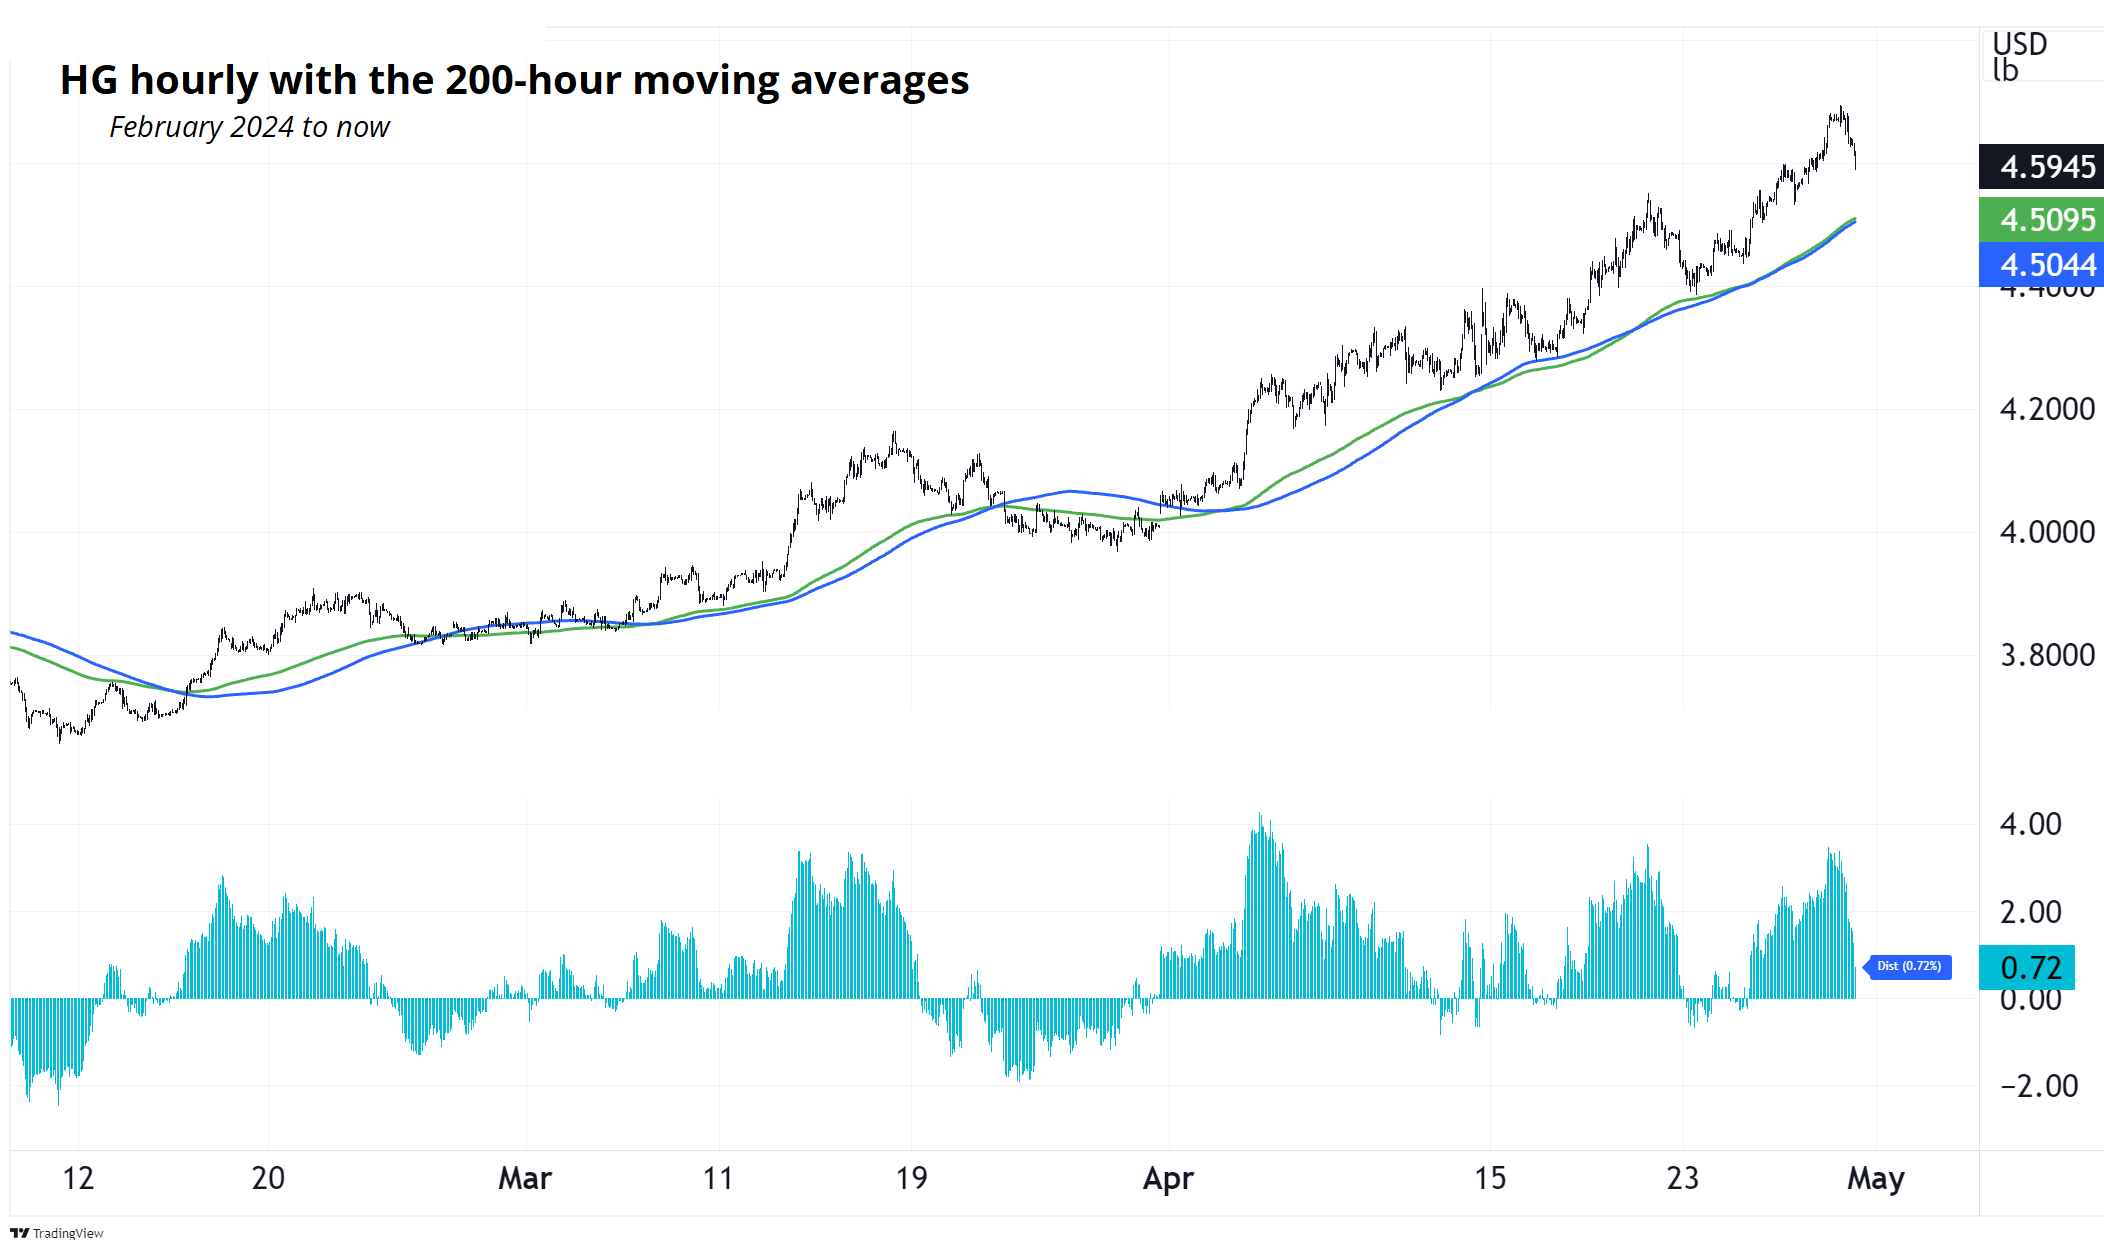
This divergence is bearish. Note the MAs on the chart are 200-hour MAs (not 100), and I’m using COMEX copper here, whereas some charts I showed on other days were London copper. The first stop for copper should be the moving averages that have defined the trend (~4.5050). Then, 4.30ish looks possible.
If you’re bullish USD, USDCLP is at an interesting level and has a high beta to falling copper. The reason there is no call to action on this is that I’m agnostic USD right now. If I was bullish USD, I’d be recommending long USDCLP.
Final Thoughts
The thing where central bankers quit and then go off and Hindsight Harry criticize other central bankers must be irksome for those that remain in government employ. I mean, c’mon. It’s rude. Central banks are bad at regime shifts because their models, by definition, don’t incorporate them. It’s the same with private forecasters. All the Hindsight Harrying in the world is not going to change this when we enter the next new regime or crisis.
Have an ostensibly rectangular day.
The Spectra FX Positioning and Momentum Report
MXN is clean, symmetrical, and orthodox
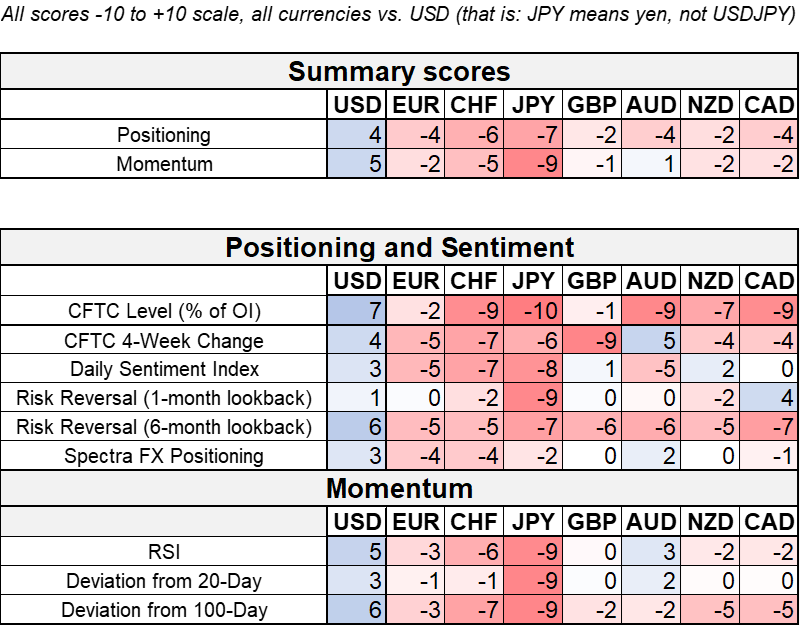
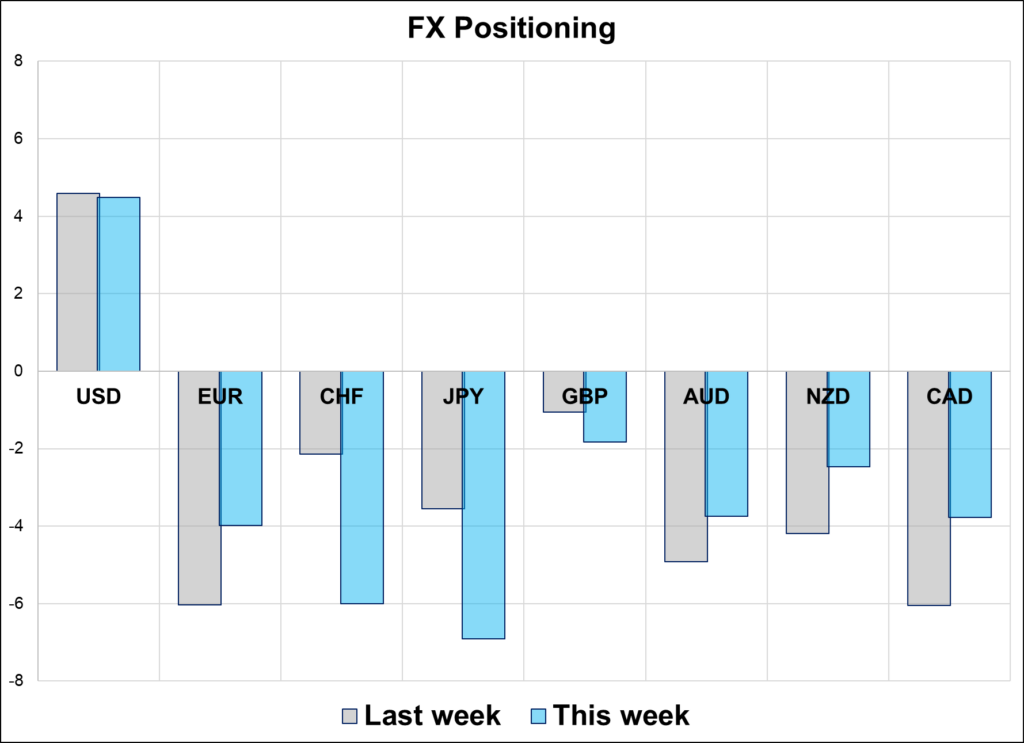
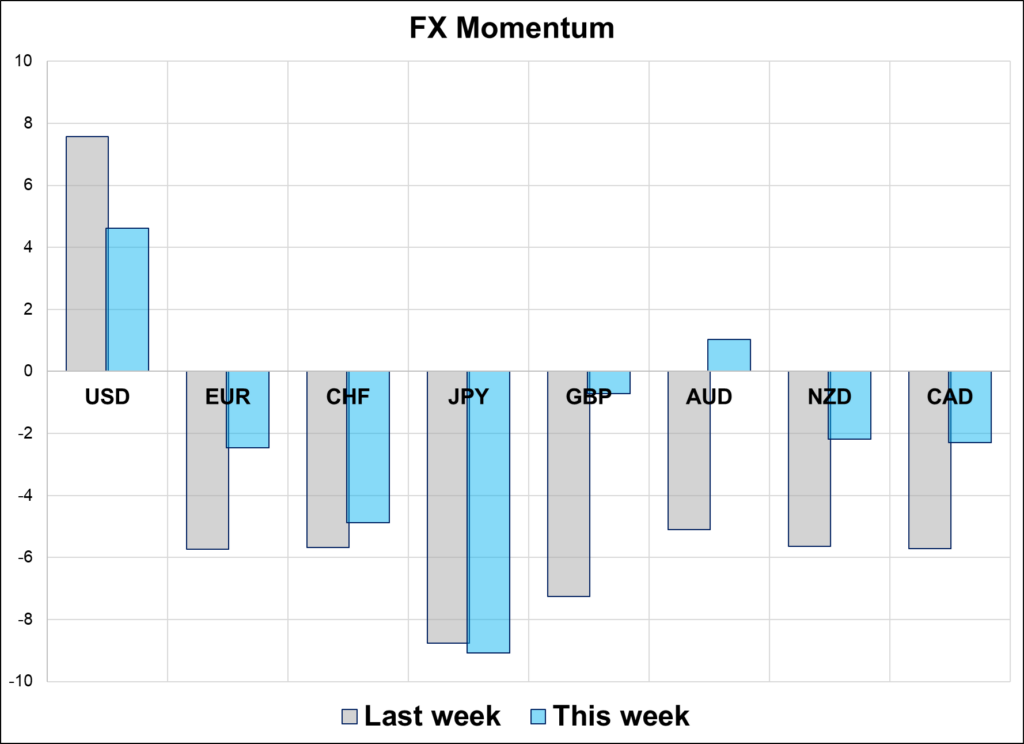
Hi. Welcome to this week’s report. The dollar has lost upward momentum against most pairs, but positioning remains heavily long USD. CHF and JPY are particularly popular while there was some lightening up of shorts in AUD, NZD, and CAD. Some of this was driven by the strong AU CPI report, but that obviously does not explain reduction of risk in Kiwi and Canada.
Two Things
1. The CFTC has completely unwound their GBP long. Positioning there has been a near-perfect reverse indicator for cable for at least a year.
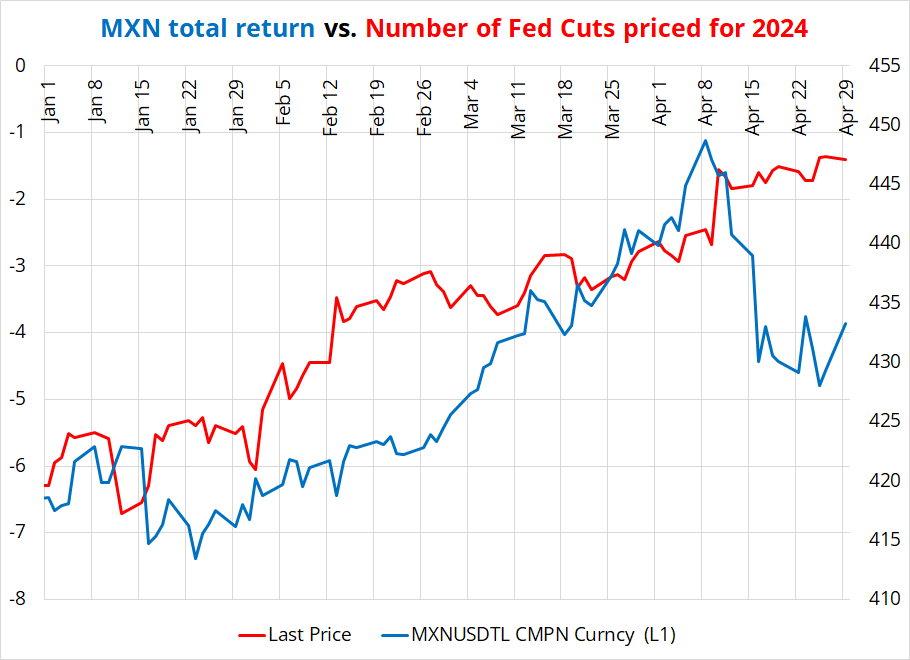
2. One of the largest positions throughout the past 12 months has been long carry, and especially long MXN. This position appeared to be bulletproof but the change in Fed pricing from 3 cuts in 2024 to just 1.5 was enough to do to MXN what the rocks did to the Tesla Cybertruck Armor Glass™ during a 2019 demo. This is relevant going into this week’s FOMC because with the blowoff in USDMXN, there is now room for a new round of appreciation if we somehow unwind the change in Fed pricing that has happened this month.
This chart covers 2024 and shows the number of Fed cuts priced for this year in red, with the total return from short USDMXN in blue (blue line up = MXN good). You can see the resilience of MXN and then, whoops.
I think you can make both of the following arguments this week:
- If the Fed opens the door for hikes, MXN will get hit again. Obviously there are no weak MXN longs alive after the MXNJPY stopfest last week, but the pair should retain its beta to Fed policy if pricing were to continue to walk tighter.
- With positioning clean, there is plenty of room for USDMXN to drop back towards the 16.50 area if the Fed does not ratify hawkish expectations this week. Sell spot on a dovish Fed and then optionalize it once the dust settles.
In other words, MXN should respond symmetrically and in an orthodox fashion to whatever the Fed serves up on Wednesday. If you have a view going into the Fed, MXN is a good place to position for it.