I like lower JOLTS
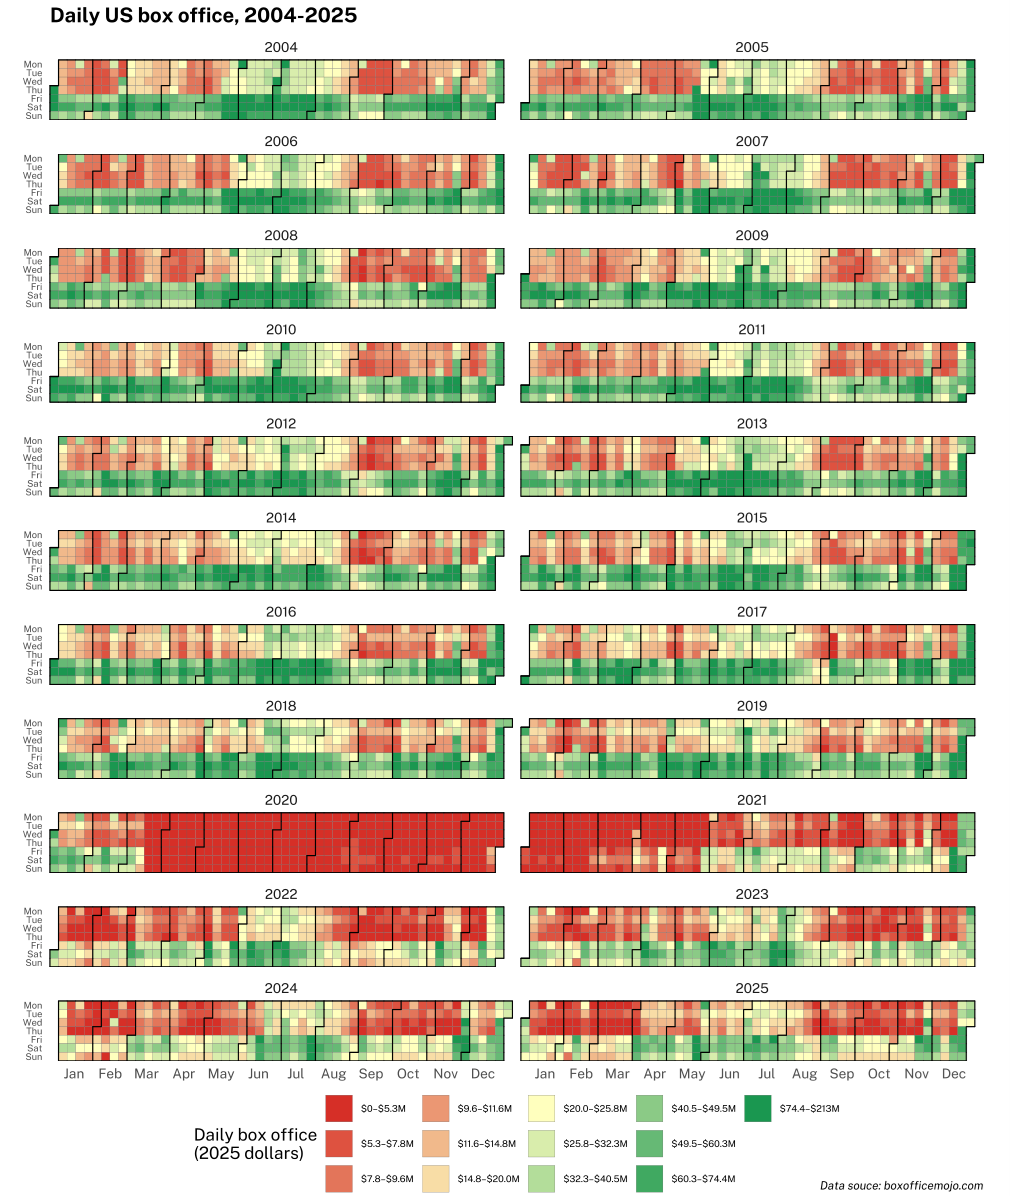
Daily US Box Office
2004 to 2025
Imagine showing this to someone in 2015 and having them guess what happened.

I like lower JOLTS

Daily US Box Office
2004 to 2025
Imagine showing this to someone in 2015 and having them guess what happened.
Flat
Today I want to take a look at JOLTS because there are times you can outguess the median economist on this one. If you were to simply stare at the JOLTS chart below for a bit, you might think “Wow, that’s jiggly.” Yes. Yes, it is.
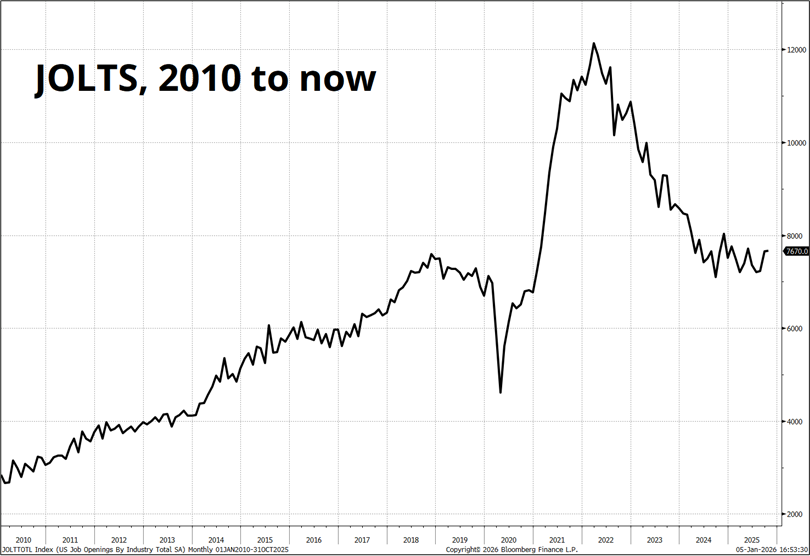
It’s like some sort of spike-backed iguana or something. Those jagged spikes are stochastic noise with a strong tendency to mean revert. While they don’t look like much on the chart, they are the main source of forecast error in JOLTS. Instead of accounting for mean reversion, economists anchor on prior releases.
If we simply look at “what did the last two JOLTS do?” and add up the misses (actual vs. expected), we can then look at the current month and see if there’s a relationship. There is. Here’s the data.
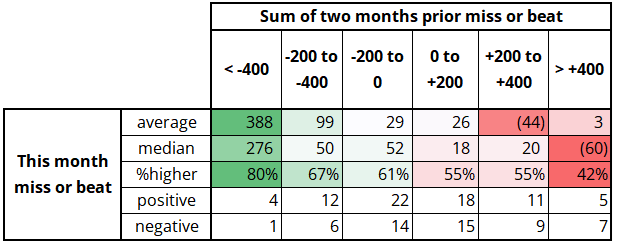
After huge misses, JOLTS tends to be strong. After huge beats, JOLTS tends to be weaker. The skew (i.e., JOLTS tends to beat way more than it misses) reflects a recurring underestimation of JOLTS by economists over the past 15 years.
This mean reversion tendency in JOLTS is notable because it just put in its biggest two-month beat total in history: +461k for September and +553k for October for a two-month total beat of +1,014,000. After predicting 7,100 for JOLTS in SEP and OCT, and it coming in around 7,600, economists are now predicting it to come in around 7,600 for NOV and I believe it’s more likely to come in around 7,300-7,400. There is a huge caveat here in that both the September and October JOLTS were released on the same day 09DEC25, so the two-month beat here happened all at once.
Also, note that I chopped 2020 to 2023 out of the data because the size of the JOLTS numbers and misses during COVID blows up the rest of the sample and I think it’s safe to say that we are not in that sort of labor shortage / supply shock regime. We are in a standard regime more like 2011-2019 or 2024/2025. A simple glance at the first chart above (back to zigging and jiggly vs. the explosive moves during COVID) tells me we are in a normal regime, not a supply shock regime. The two are easy to differentiate. Still, it’s an important assumption, even if it’s an easy and safe one to make, so I’m letting you know.
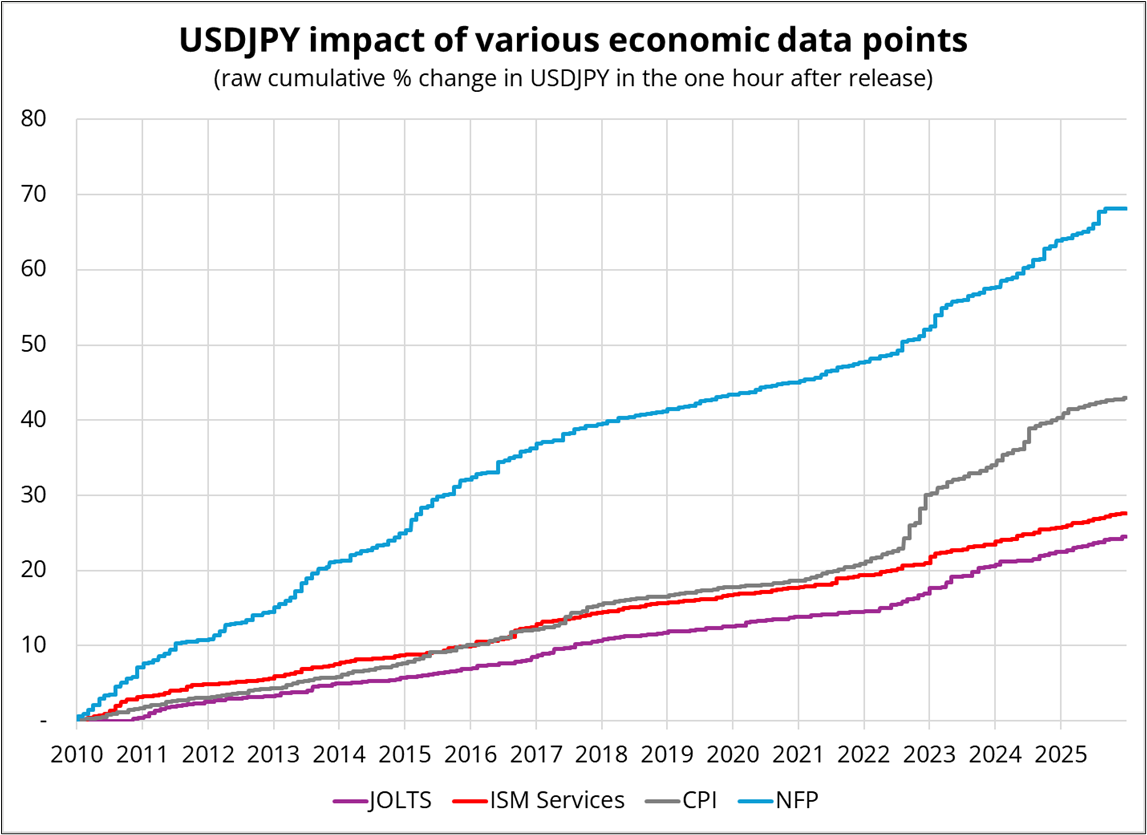
But does JOLTS matter for markets? I would say yes. Here’s the impact of four US data releases on USDJPY since COVID. This measure simply takes the absolute value of each 1-hour move after the specified release and adds it to the prior total. This creates a running cumulative total that shows the relative impact of various economic data points on a security.
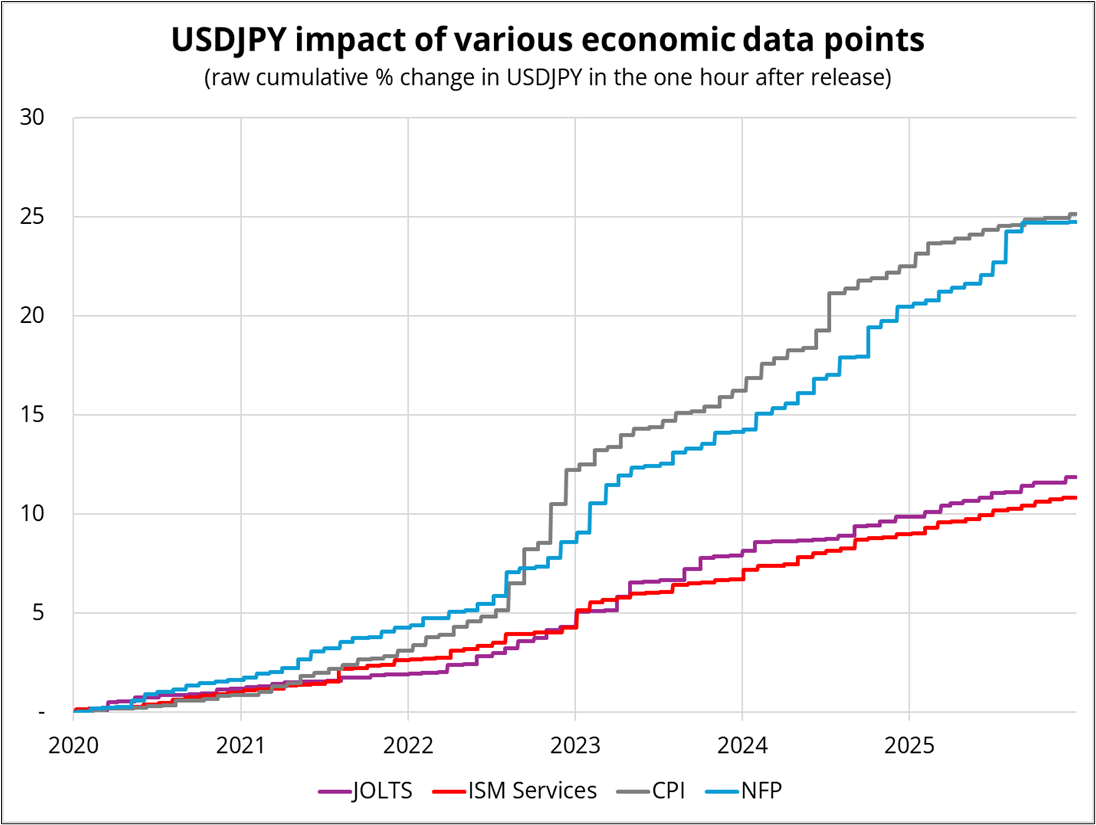
The y-axis is total percent movement in USDJPY in the one hour following each economic data release in the given time frame. You can see that JOLTS has moved USDJPY a tad more than ISM in recent years. That’s partly an indictment of ISM—survey data has been a red herring for years and people finally started realizing that in 2023/2024, but it’s also a sign that people do trade the JOLTS release.
With January FOMC not a completely done deal, a flurry of weak labor market data is about the only thing that might trigger a Fed cut. That would start with weak JOLTS and be followed by a negative NFP. Here’s the same chart back to 2010.
Finally, here’s the same chart one more time, with only JOLTS, so you can see how its importance turned up in early 2022.
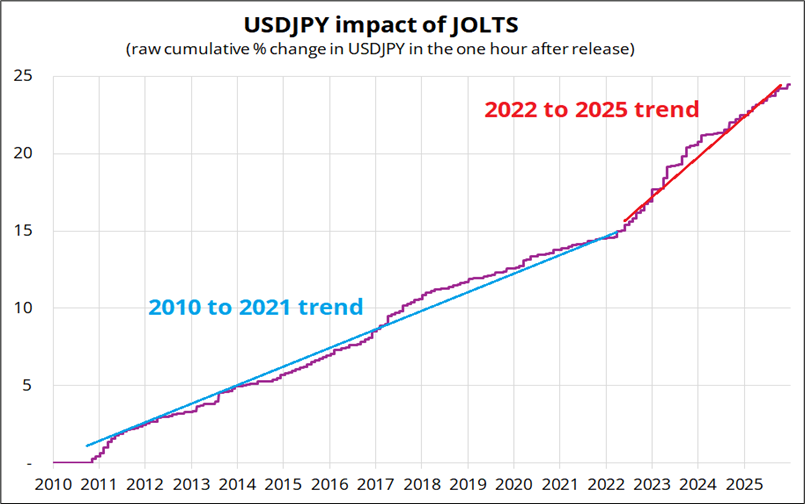
The impact of CPI and NFP also went steeper in 2022, but ISM never really changed slope. ISM has become a useless indicator, though that could change one day.
And finally, here are market reactions in USDJPY over the past 2 years (1-hour USDJPY price change after JOLTS, in percent).
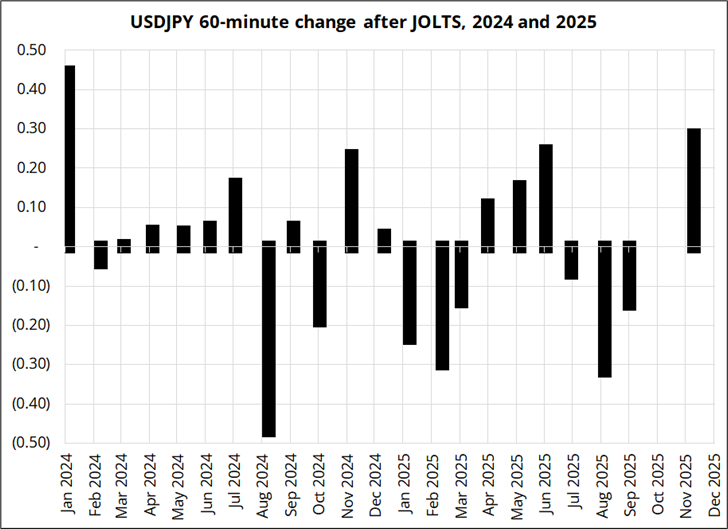
Dates on x-axis show the actual release date of JOLTS (that’s why there’s no data for October 2025)
So while the government shutdown is a bit of a wildcard in my analysis (because the last two JOLTS releases came out in one day), I still believe that mean reversion is the bet when it comes to JOLTS. If you’re thinking about going long US bonds or short USDJPY, you might as well do it before JOLTS, not after. While USDJPY continues to wander away from interest rate differentials in the bigger picture, data-driven rate repricing still drives USDJPY in New York hours.
Have a Blockbuster Day™.
Top comment: Imagine showing this to someone in 2015 and having them guess what happened.
