Predictive powers
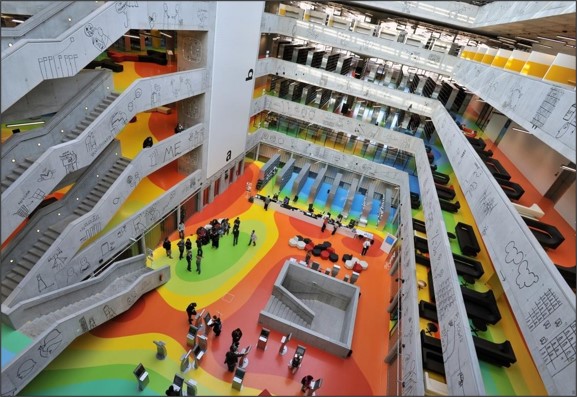
This engineering library in Prague has a rainbow pattern on the floor that reproduces a structural engineer’s computer model showing how the reinforced-concrete floor slabs deform under load.

Predictive powers

This engineering library in Prague has a rainbow pattern on the floor that reproduces a structural engineer’s computer model showing how the reinforced-concrete floor slabs deform under load.
If PPI is weak (headline and core), buy AUDUSD and sell USDCHF at 7 a.m. Friday with a 60 pip stop loss on each. If PPI is strong, do the opposite.
10SEP CHFJPY put spread
199/196 for ~37bps off 200.50 spot
Winner: Cost 37, paid out 150
30NOV Long 1.23/1.25 AUDNZD c/s
vs. short 1.18/1.19 p/s
Cost 2.5 bps off 1.2093
I have discussed this in the past, but it’s time for another chat about what happens when PPI comes out before CPI. The two series are correlated, naturally, but the misses of the two series are also correlated. Before I show the evidence, let me explain some of the logic.
First of all, how often does PPI come out before CPI? This often:
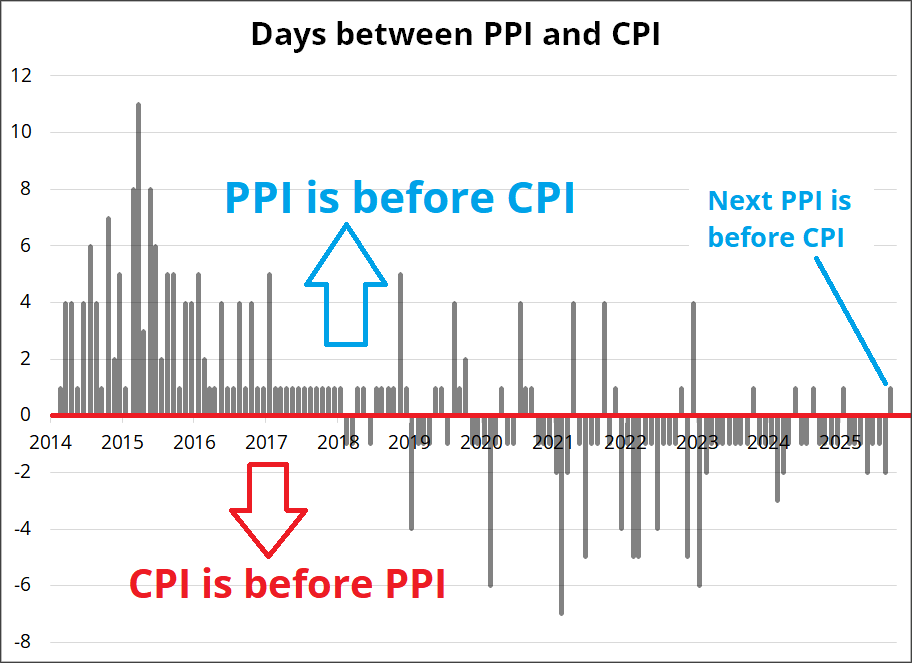
But if CPI and PPI are strongly correlated, don’t economists update their forecasts for the other once the first one comes out? No. Out of ~55 economists that predict PPI and CPI each month, only 3 to 5 update their forecast for the second one after the first one comes out. That will never move the median for an economic release forecast that is measured in increments of 0.1. Therefore, if there is a big miss in one series, it tends to predict the sign of the miss in the other.
Normally this knowledge is not particularly useful because CPI is more important and CPI usually comes out first. So an edge in predicting PPI is pretty boring. But an edge in predicting CPI is not!
There are different ways to slice and dice the PPI vs. CPI surprise data, but they all point to roughly the same thing: If both PPI series miss in one direction (headline and core) you are best to bet on CPI missing in the same direction. Here are some variations.
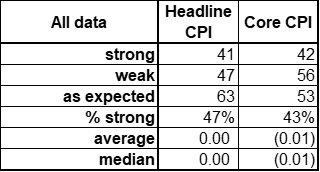
First, to make sure the data isn’t biased, here’s the full set (2014 to now). Mild bias to weaker.
And here’s CPI if Headline and Core PPI were both weak or both strong.
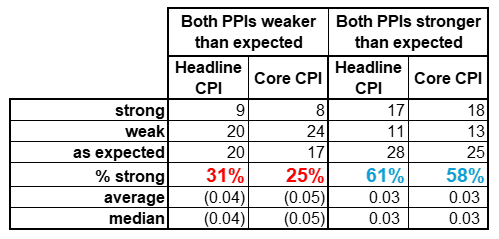
% strong = #strong / (#strong + #weak)
The data show that if both PPIs are weak, it is sensible to bet on weak CPI and vice versa. If you tighten the parameters to: “Only if sum of PPI misses (Headline + Core) is >+0.4 or <-0.4”, the results sharpen a bit, but the sample size drops to thirty.
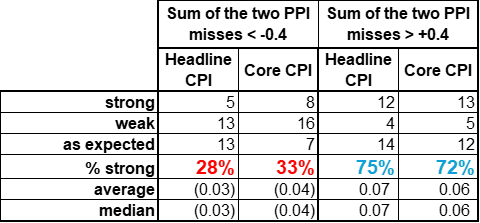
So what is the trade? Two possibilities:
To summarize: Shocks and factors economists fail to predict tend to impact PPI and CPI in the same direction. If you know PPI missed or beat, you have an edge when predicting a miss or beat for CPI. It’s bizarre to think a Fed policy decision with a 6-18 month lag comes down to a single data point, one week before the meeting. But hey, recency bias is real.
Many single stocks have shot skyward due to explicit or second-derivative state sponsored support from the Trump admin. Pending a potential flash of Blue at midterms, the market may start to price the reduction of support for those lucky winners picked by the U.S. government in 2025/2026.
Below is a basket of booming beneficiaries that might become busted bets as they are bound for a bout of underperformance if Big Blue breaks through in the midterms.

I am not an equity analyst, and the twelve stocks I chose are fairly obvious but debatable choices. This is more of a behavioral call than a policy or election view. The market is soon going to sniff out Red Wave winners and lighten up, or even position for them to become Blue Wave losers.
Something to think about. Have a colorful day.
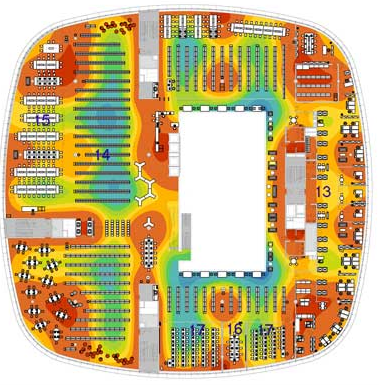
National Technical Library (NTK) is an engineering library in Prague. It has a rainbow pattern on the floor that reproduces a structural engineer’s computer model showing how the reinforced-concrete floor slabs deform under load.
And: cool art on the walls.
HT Ollie D