Splashy new hire for Spectra (plus equity dispersion, JPY, and more)
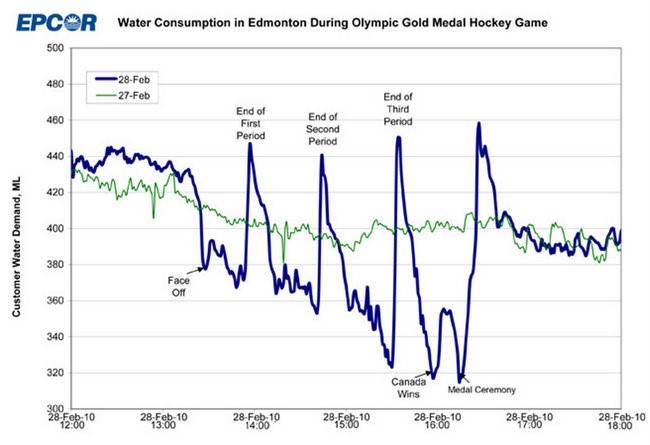
Consumer water demand in Edmonton, Alberta during the 2010 Olympic gold medal hockey game.
Green is a normal day; blue is the day of the gold medal game.

Splashy new hire for Spectra (plus equity dispersion, JPY, and more)

Consumer water demand in Edmonton, Alberta during the 2010 Olympic gold medal hockey game.
Green is a normal day; blue is the day of the gold medal game.
Long GCJ6 at 5072
Stop loss 4845, take profit 5399
Move stop up to breakeven (5072)
Long 12MAR 177.50 EURJPY put
for ~32bps off 182.30 spot
Simon Flint is now part of Team Spectra! I have known Simon for fifteen years and I can vouch for the fact that he is a world class EM strategist. He is market-oriented and practical, and has deep connections to policymakers and risk takers across Asia.
Most recently a Bloomberg columnist, Simon was a PM and Head of Research at a large Asia-focused hedge fund. He was also Head of Global FX Strategy at Nomura—where his teams earned Institutional Investor #1 rankings across Asia, Europe, and North America. He also held senior research roles at Merrill and Bank of America.
Simon holds a Master’s in Economics from the University of Cambridge, where he also tutored undergraduate macroeconomics. His teaching career was foreshadowed by his own tutor’s reference: “Simon finds Economics sufficiently difficult that he will understand the struggles of the average student.” He also holds a degree in International Relations, and has worked on conflict resolution in Mozambique, nutrition projects in Indonesia, and as a Hindi film extra.
If you are an institutional trading client of Spectra FX, Simon will become part of your day-to-day coverage. He will have a strong focus on generating actionable ideas in EM. You should soon start receiving emails from him and he will appear in your chats; and of course feel free to ping him!
The only time I can remember this much dispersion in equities was during Quant Meltdown in August 2007. This paper covers that incident. Prior factor meltdowns like the one we are witnessing this month were generally driven by forced liquidation, not macro risk / disruption forecasts. Sure, sectors like bricks-and-mortar and legacy media were obliterated in isolation in 1999/2000, but this absolute indiscriminate thrashing of entire industries, one by one, is something I do not recall seeing before.
There are neat ways of measuring dispersion, but I often find sophisticated statistical tools obscure reality. Linear regression, for example, is easy to justify statistically but fails to account for the non-linear nature of financial market data. Dispersion data can be useful, but the crazy thing about the current regime isn’t really just the dispersion, it’s the amount of massive single-name selloffs playing out in a world where the NASDAQ is still only 5% off the all-time highs.
The chart below shows rolling sum of 5%+ single-day drops over the previous month in black, and drawdown from ATH in red. This is for the 100 NASDAQ constituents. So if 20 dropped 5% or more yesterday and 20 the day before and zero in the 18 days before that, the number would be 40, etc.
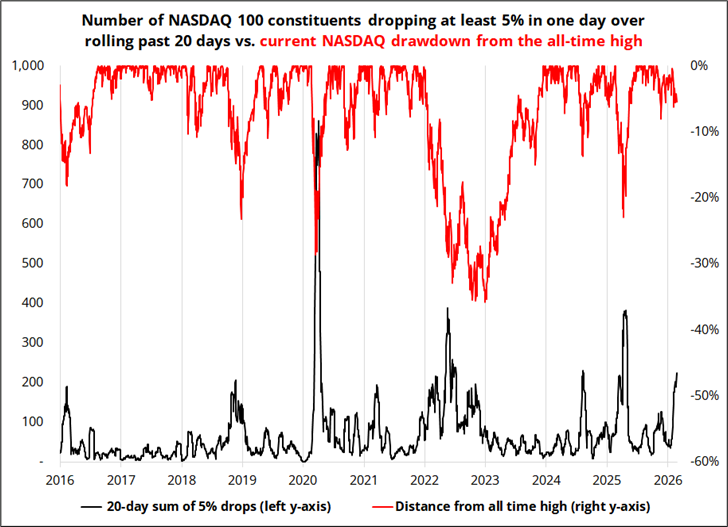
You can see that flurries of 5% drops within the index tend to be accompanied by large drawdowns from ATH in the index. This should nearly be a mathematical truism, and yet we are seeing many more 5% drops than usual and the index is holding in. Like lead/lag relationships, this could be interpreted either of two opposite ways. 1) Wow, the index is holding well! Or 2) This instability is going to lead to a major breakdown! I am more inclined to believe 1) because the tax cuts are about to spray a bunch of cash into U.S. bank accounts and the forward looking data like ISM Services New Orders is pointing to a strengthening U.S. economy.
I also looked back to 2000, because I was curious if the 2007 Quant Meltdown would show up. But it does not because it was a more extreme, but much shorter-lived phenomenon.
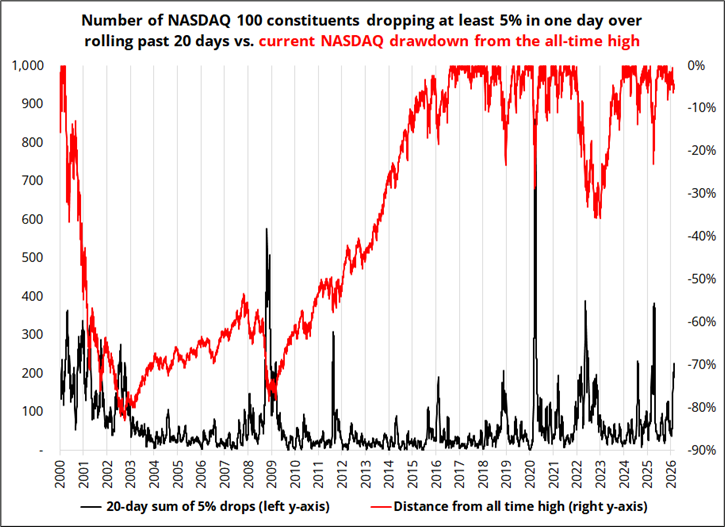
In fact, much of that August 2007 bloodbath happened in a single day.
Average return of intraday mean-reversion strategy applied to S&P during the Quant Meltdown of 2007
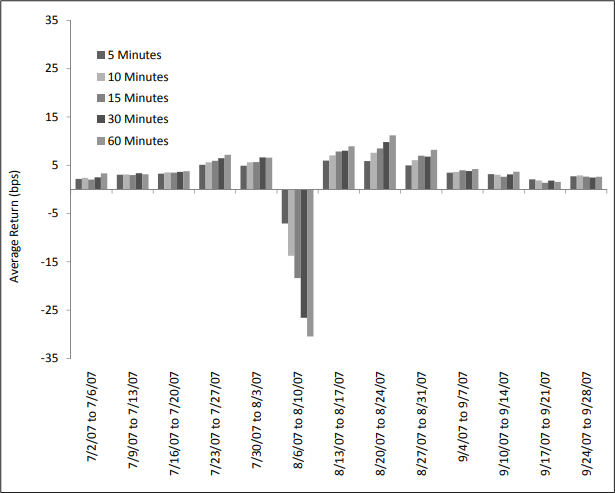
That blowup was more about massive overconcentration in specific strategies and a subsequent deleveraging and had nothing to do with macro or fundamentals. Some argued, however, that it was a yellow flag that showed liquidity was drying up ahead of the Global Financial Crisis.
By the same token, if a worst-case sci-fi piece by a well-known blogger can trigger what we got here over the past few weeks, maybe liquidity is not as plentiful right now as bulls might hope?
My bullish JPY view has come undone as Takaichi does not appear to support a rate hike from the BOJ and the news continues to point to the rate check as a rogue and random U.S. action ordered by Scott Bessent with no support from Japan. Full Nikkei article from last night is here. The idea that Japan might not want a stronger yen is obviously hugely concerning if you’re long yen! While a proactive U.S. Treasury actively trying to coax the USD down seems… Important, maybe? This is now three times Bessent has whiffed with USD-negative comments/actions. And he was the one that pushed back on Trump’s weaker USD comments, so it’s all a bit random and confusing and nothing close to a clear USD-negative policy stance from the admin.
Here are USDJPY thoughts from Simon Flint.
—
USD/JPY — looking to fade rallies into 157–158, with March 19 (Takaichi–Trump meeting) circled
USD/JPY justifiably jumped on reports that Takaichi “voiced apprehension over any further rate hikes” in a meeting with Ueda.
If that’s a faithful translation, it’s a big deal. Markets are pricing something like ~1.25% by year-end (WIRP JN, and ~1.5% is my rough “terminal” guess).
And that matters because the yen’s fate is partly a question of: can the BoJ hike when it needs to?
Takaichi’s stance is material (if true), because:
If the US prompted the rate check, then (by extension) Tokyo may be less willing than the market assumed to use domestic levers to rein USD/JPY in (rate hikes, fiscal restraint, etc.). Fewer Japanese tools = fewer reliable brakes.
The caveat: the US can act alone (as Trump has shown repeatedly), and if Washington is selling dollars it’s not “running down reserves” — it’s building them. That’s meaningful market power.
That’s partly why, if the Mainichi narrative drives USD/JPY into the 157–158 zone, I’d like to take a tactical punt on USD/JPY lower.
This is because of a confluence of “160” headline risk, cost-of-living politics for Takaichi, and the desire to show up to the March 19 Trump meeting without aggravating the host, nudges Japan toward doing something—to steady the currency.
But it’s tactical. It’s hard to fall in love with JPY.
—
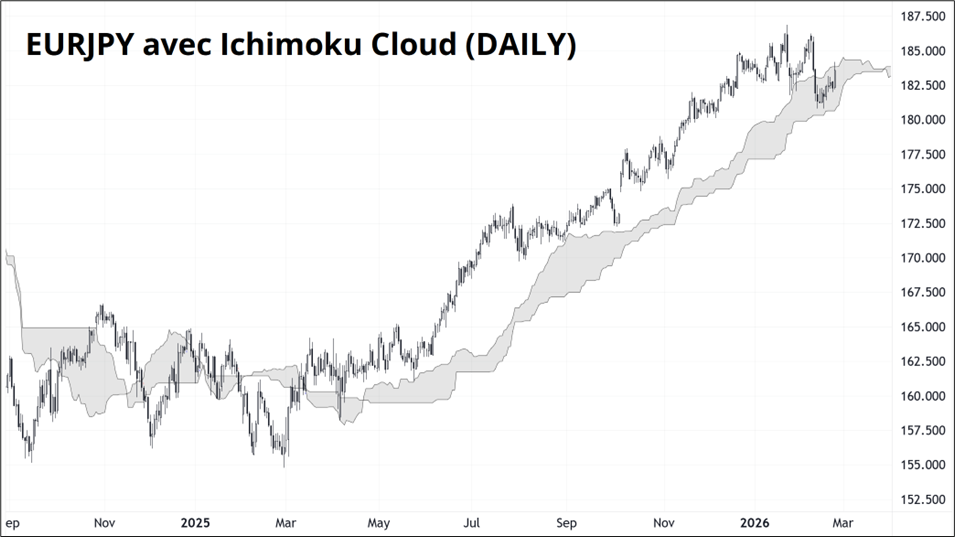
I agree with all of this, but I will share Simon’s thoughts whether or not I agree with them. All hope is not completely lost in EURJPY tech-wise, as the daily cloud has risen to 183.85 and we have yet to close above it on a daily close.
Here be the EURJPY chart:
May your day be flush with liquidity.
Consumer water demand in Edmonton, Alberta during the 2010 Olympic gold medal hockey game.
Green is a normal day; blue is the day of the gold medal game.
