Targeted equity correction continues as the infinite capex narrative cools
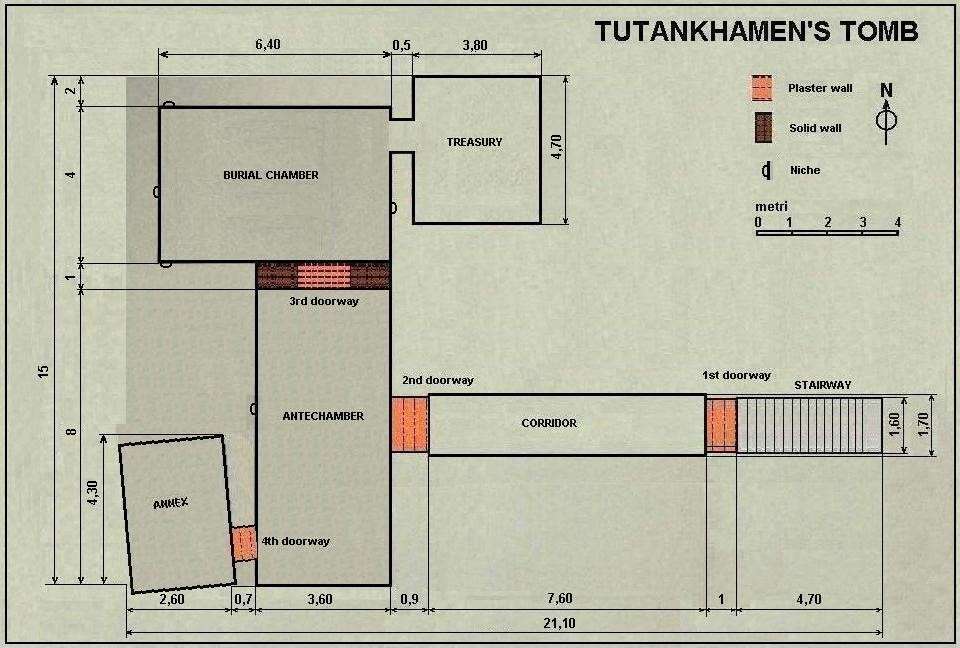
King Tut’s tomb was discovered on this day in 1924. It had remained untouched for almost 3,300 years.

Targeted equity correction continues as the infinite capex narrative cools

King Tut’s tomb was discovered on this day in 1924. It had remained untouched for almost 3,300 years.
Sell EURUSD at 1.1569
Limit order. Stop loss 1.1711.
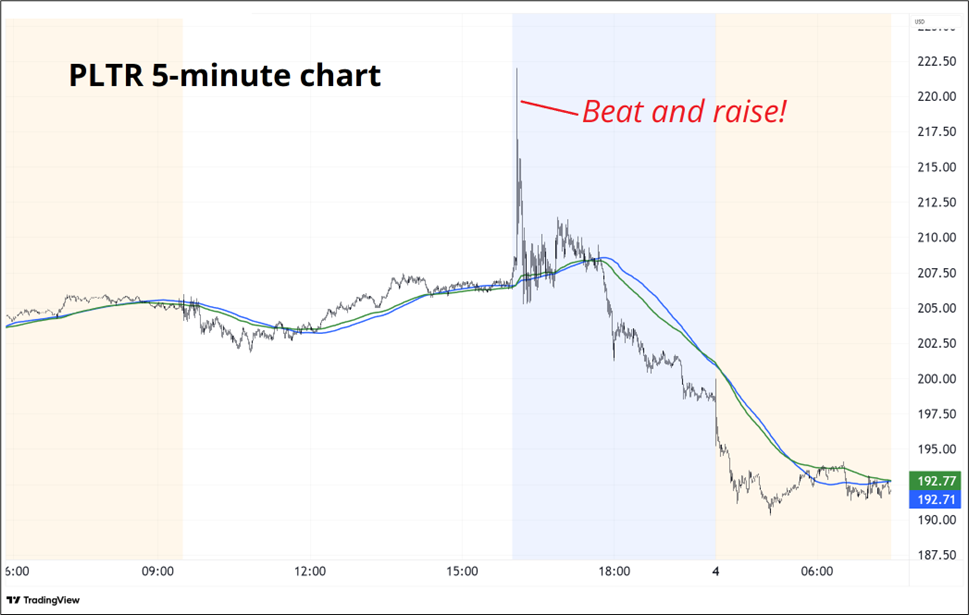
Last week, in am/FX: BOJ and stocks, I wrote about the growing number of yellow flags in stocks and reasons to short ORCL, CRWV, and NVDA with an emphasis on ORCL. The thesis was that weak crypto, the poor response to META’s capex increases, and a more hawkish Fed could put downward pressure on the megatech trade. You can add last night’s price action in PLTR on a beat and raise:
And a further drop in crypto:
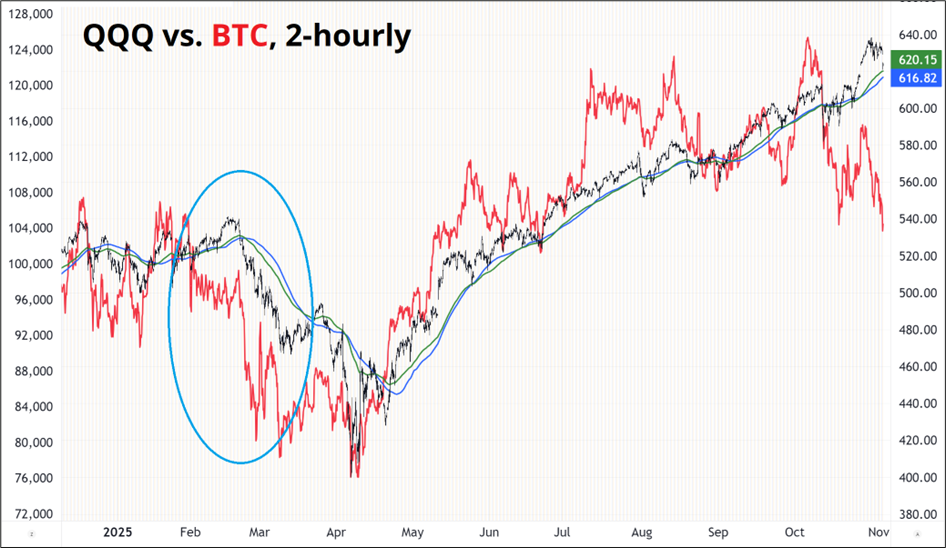
Much as the EUR narrative has cooled from “fiscal, yes!” and “best substitute for the USD” to “Germany, no!” and “USD is OK”… The AI narrative is turning a bit sour as the market has stopped rewarding FOMO spenders who have used up all their FCF and are now starting to issue debt to finance further dependence on the fate of OpenAI.
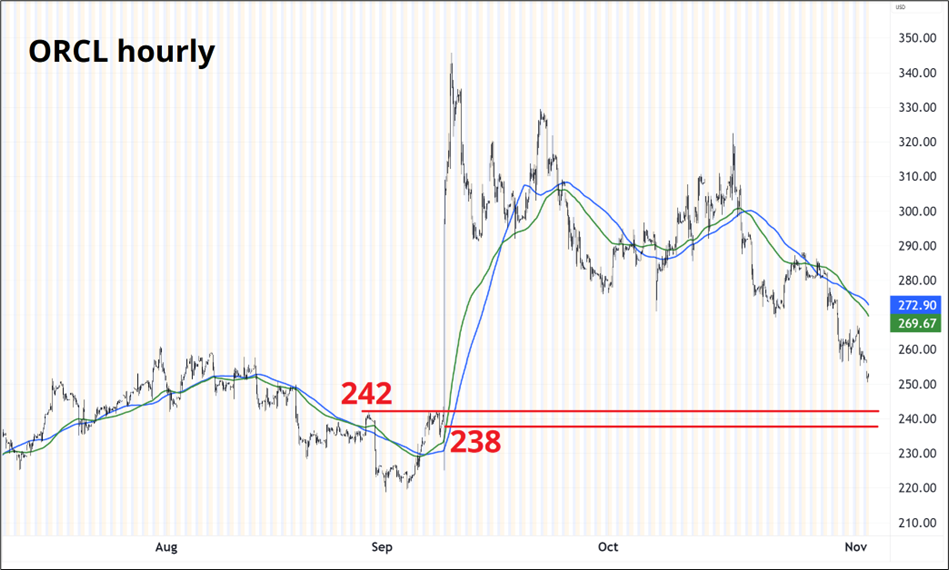
The target on ORCL is a full round trip back to 238/242. $242 was resistance before the mega-MOU with OpenAI was announced and $238 is where it was trading in the seconds before that announcement. NVDA is $191 before $221. The CRWV round trip target is $115.
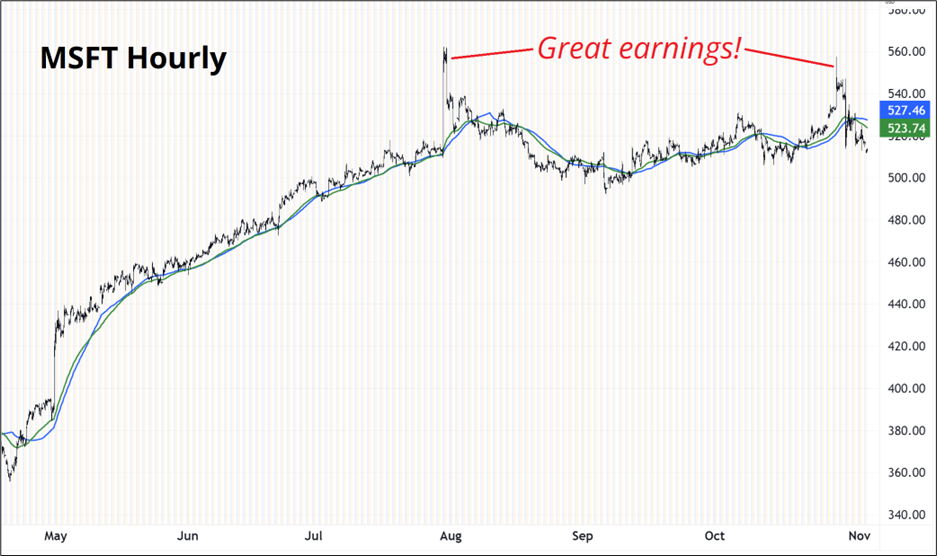
There is a growing pattern where these explosions higher are rejected. MSFT has also made a near-perfect double top with each high the result of a rejected spike on blockbuster earnings.
Yellow and red flags all over the place.
What does a more substantial correction in equities mean for FX? While I have been bemoaning the lack of correlation between FX and other asset classes, it’s important to remember that a huge driver of correlation is volatility. When FX vols are in the toilet, correlation will tend to be low as well. If we are going to get a more meaningful move lower in stocks, correlations are likely to pick up.
For example, look at the relationship between AUDJPY and QQQ under two conditions. The chart on the left shows all days since January 2024 where NASDAQ futures (NQ) were down 1% or more. There are few days where AUDJPY went higher and the r-squared is 50.6%. In contrast, in times of calm, when NQ is up on the day, the r-squared drops to 21.5% and the AUDJPY performance is all over the place.
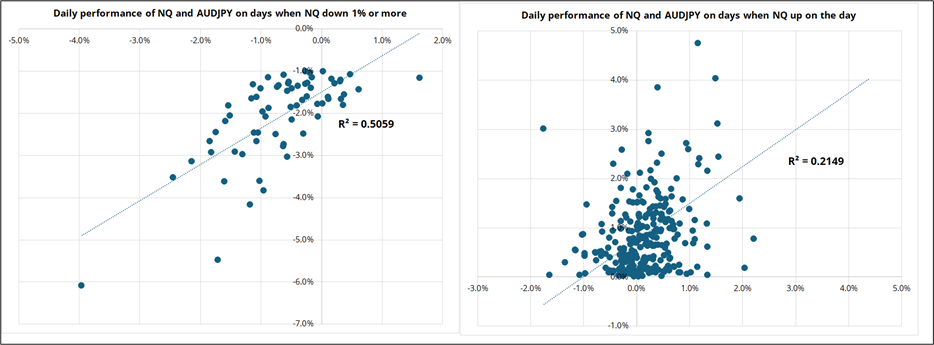
NASDAQ is y-axis, AUDJPY is x-axis. Y-axis is truncated at 5%, but note there was one +12% day in the NASDAQ in 2025
It is a nearly-ironclad rule that market stress increases both volatility and correlation. Therefore, as my concerns about a deeper correction in stocks grow, I am going to take profit on the long USDJPY trade. It makes no sense to sit here long USDJPY if I think the NASDAQ futures are going to 25,200.
With stocks and crypto wobbly, no strong view on ADP tomorrow, and the market now short JPY… Long USDJPY makes no sense to me anymore. I am tempted to go short CADJPY as CAD continues its impulsive weakness, but the timing ahead of ADP feels random. That is, if I had a reason to think ADP might be weak, I would be selling CADJPY right here. But I don’t.
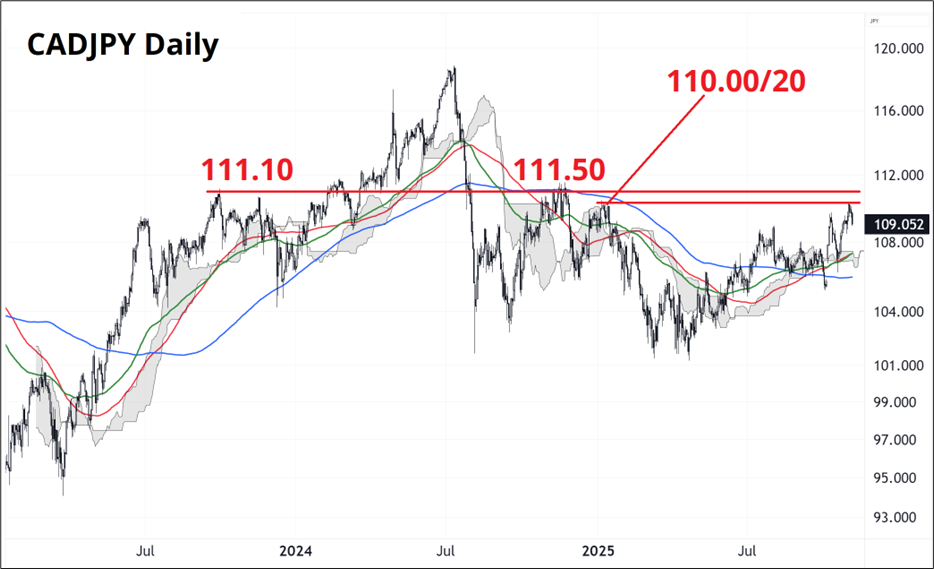
The chart here shows how 110.00/20 and 111.00/50 have been mega resistance in CADJPY over the past two years. If you think ADP will be weak, sell CADJPY here (109.05) with a stop loss at 110.61. Or buy 2-week 108.00s.
Have a regal day.
https://en.wikipedia.org/wiki/Discovery_of_the_tomb_of_Tutankhamun
King Tut’s tomb was discovered on this day in 1924. It had remained untouched for almost 3,300 years.

Disassembled chariot (left) and furniture (right) inside King Tut’s tomb
