July 29 to August 1 is crazy jam packed

The AI creates an image from song lyrics.
Can you name the song?
Answer tomorrow.

July 29 to August 1 is crazy jam packed

The AI creates an image from song lyrics.
Can you name the song?
Answer tomorrow.
Flat
We are in a strange week here with most currency pairs mid-range, no strong macro narrative, the Fed split, seasonality about to turn in many assets, and a variety of deadlines on the horizon.
July 30 is FOMC. While this is probably a nothingburger, there’s a small chance the doves will get enough hawks onside to send a dovish message with regard to the September meeting. With September all the way down to 50/50, a dovish July 30 outcome could move the needle.
July 31 is the date the Supreme Court will start to discuss whether or not the current tariffs are illegal.
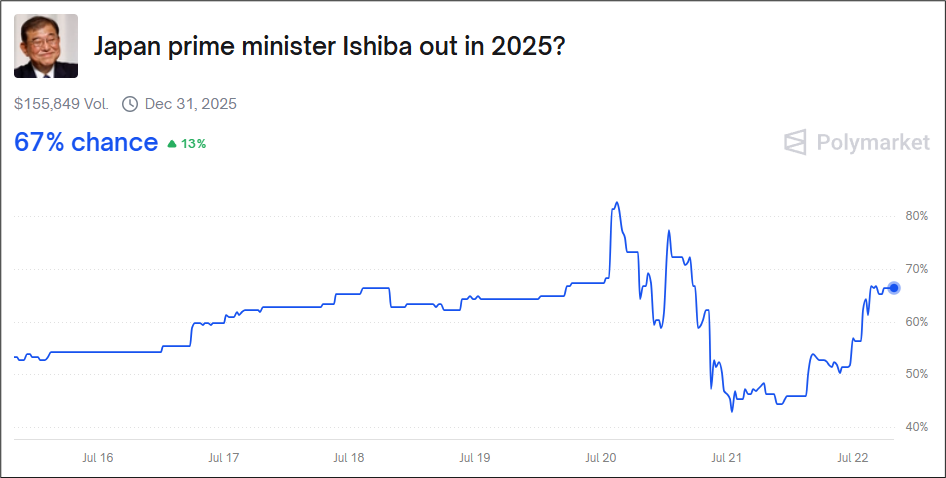
July 31 is a meeting of the LDP to decide Ishiba’s fate. USDJPY and US bonds are trading like the election story is over, but it is not. Pressure is growing on Ishiba to resign, and if he does, that will probably release the hounds on the JPY and bond markets once again. See here: https://english.kyodonews.net/articles/-/57750
August 1 is the deadline for countries to reach a deal with the United States on tariffs or face a US-imposed import tax. While it’s easy to joke about how this deadline will inevitably be delayed once again, there is so much complacency now that you cannot simply ignore the deadline. Also, the market reactions to tariffs have mostly been a function of positioning going in. Positioning now reflects extreme complacency and greed in a mirror image of the April lows.
You can throw in JOLTS, ADP, GDP, Core PCE, ISM, and Nonfarm Payrolls all between 7/29 and 8/01. And corporate and real-money month end. Wowzers. You’ve got events and events and more events, all stacked in a 3-day period around the turn of the month and the last business day of the month is almost always the highest-volume day of a given month due to month-end rebalancing. It’s a superstorm of activity, coming in eight days.
It’s probably best to save some bullets with nothing in particular going on this week.
As mentioned, the Prime Minister is not yet out of the woods. The odds on Polymarket have moved higher over the past 12 hours as the Japanese media is talking about rising pressure. Might Ishiba resign before July 31 in order to save face and not put his peers in a position where they have to force him out?
Current market odds:
Torsten Slok outlines a simple and solid hypothesis for why the USD might rebound. He suggests that with Section 899 no longer in play, the Mar-a-Lago Accord idea dead, and flows returning to the US, the discount on the USD vs. interest rate differentials might be set to close.
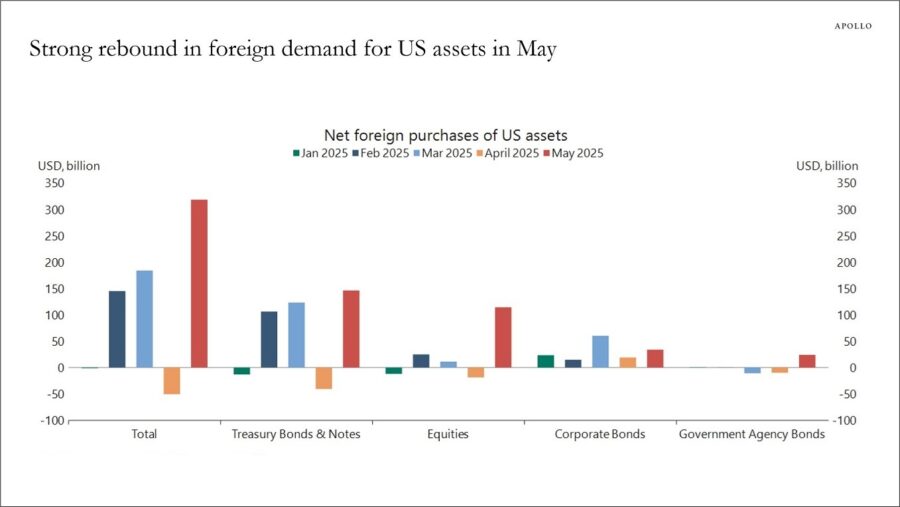
Kind of makes sense. When you think about all the pieces of the USD-bearish thesis: Section 899, Mar-a-Lago Accord, US economic weakness, Peak AI, Massive flight from US assets… Not one of those things is currently happening. Things that make you go hmmm.
https://www.apolloacademy.com/the-daily-spark/
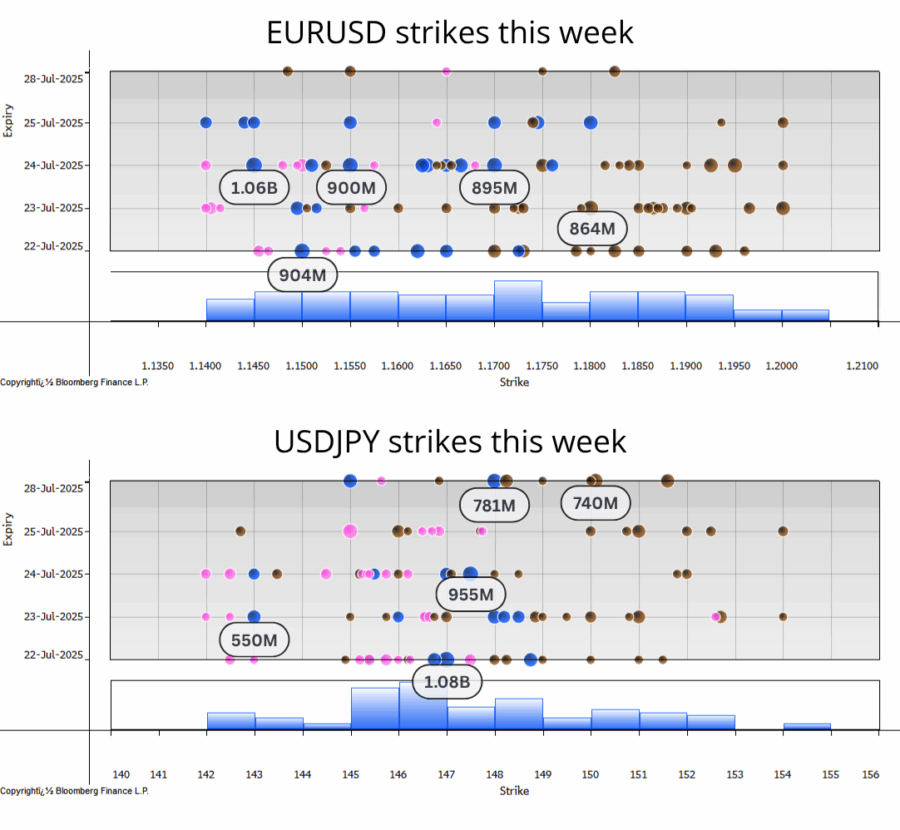
We are adding a new feature to the Positioning Report starting this week: The big strikes in EURUSD and USDJPY. I find this information useful for two reasons: 1) Big strikes are good technical levels. You can use them as support and resistance and watch how the currency trades around them. 2) They create gravity into 10 a.m. Owners of options tend to be underhedged relative to market makers, so anyone with a huge strike is trying to milk it as expiry nears and this creates loops of buying and selling around the strike.
This week, we see that the biggest EURUSD strikes are coming Wednesday with a huge cluster around 1.1650 and another blob at 1.1700. In USDJPY the Wednesday 147.50 stands along with a bunch of strikes 148.00/50 that expire tomorrow.
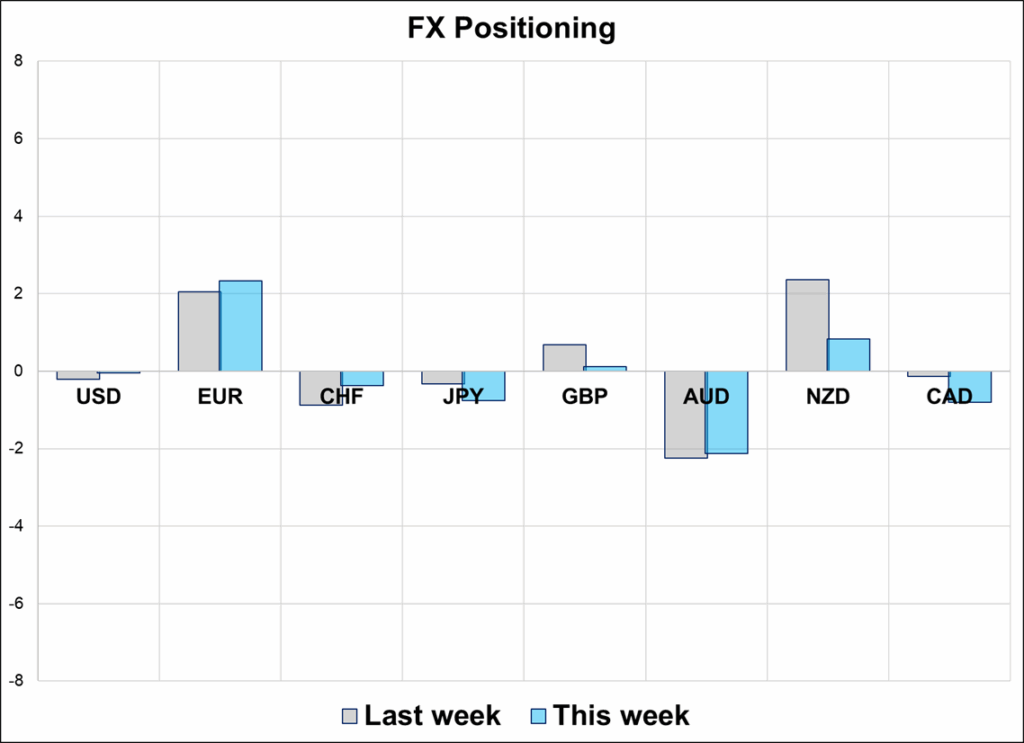
Positioning is about as close to flat as it gets:
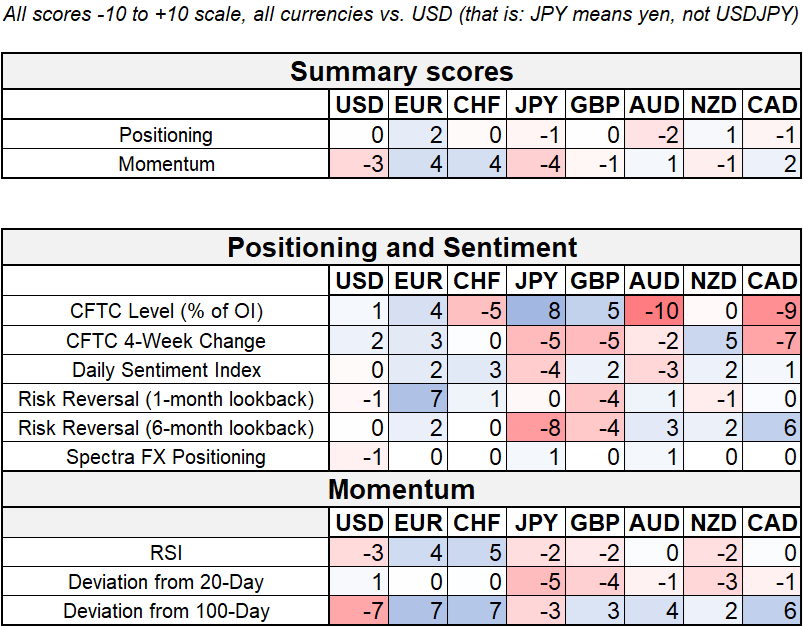
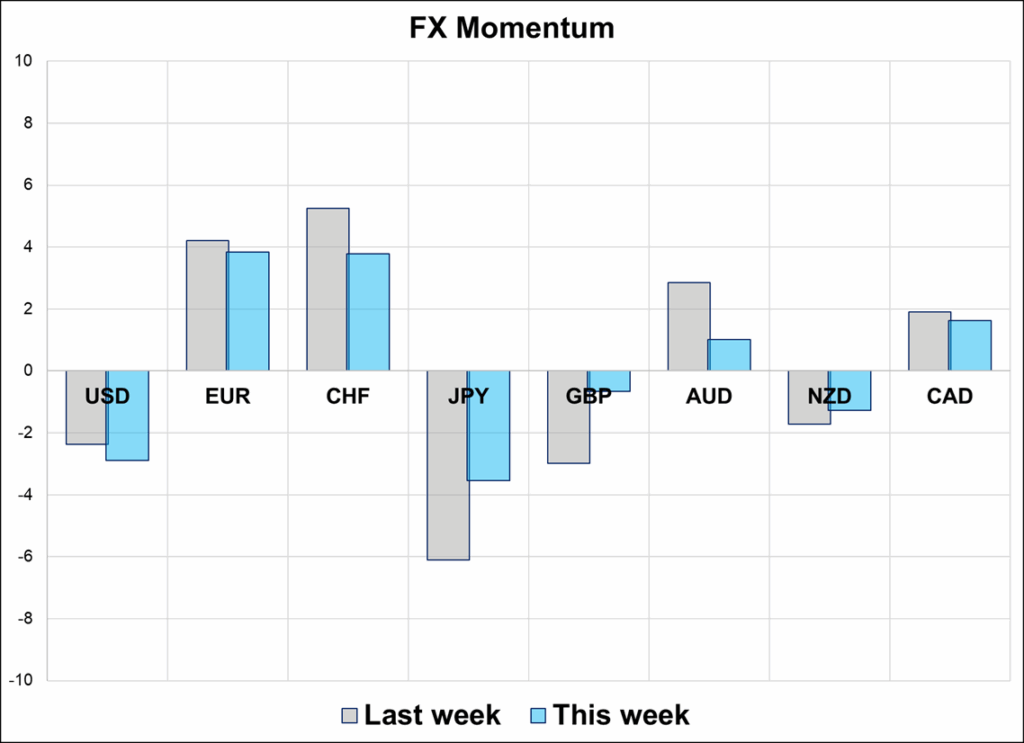
While momentum is also minimal:
I was thinking about whether 17 is kind of high for the VIX with stocks at the all-time highs and so I made a spreadsheet to look at the history of all VIX levels for every all-time high achieved since 1990. I went to make a chart and clicked on the wrong button and discovered a weird format that is kind of cool. It’s a bit gross to look at, but you simply read counterclockwise starting at the top and as you go around, time passes from 1990 until you get back to the top (12 o’clock) and then you are at 2025. The little sticks show VIX on days when the S&P 500 hit an all-time high. You can see that VIX below 15 was mostly an artifact of secular stagnation, a time when economic and financial market volatility was absurdly low. Pre-2010 and post-2020, a normal VIX for all-time highs is 15-22ish
I promise never to use this chart format again.
VIX Radar for days when SPX hit ATH (1990 to 2025)

The AI creates an image from song lyrics.
Can you name the song?
Answer tomorrow.
