The “hot US consumer” narrative might itself be too hot
1 divided by 998001 returns all the numbers from 000 to 999, in order.
Except 998.
1/998001 = 0.000001002003… …994995996997999…

The “hot US consumer” narrative might itself be too hot

1 divided by 998001 returns all the numbers from 000 to 999, in order.
Except 998.
1/998001 = 0.000001002003… …994995996997999…
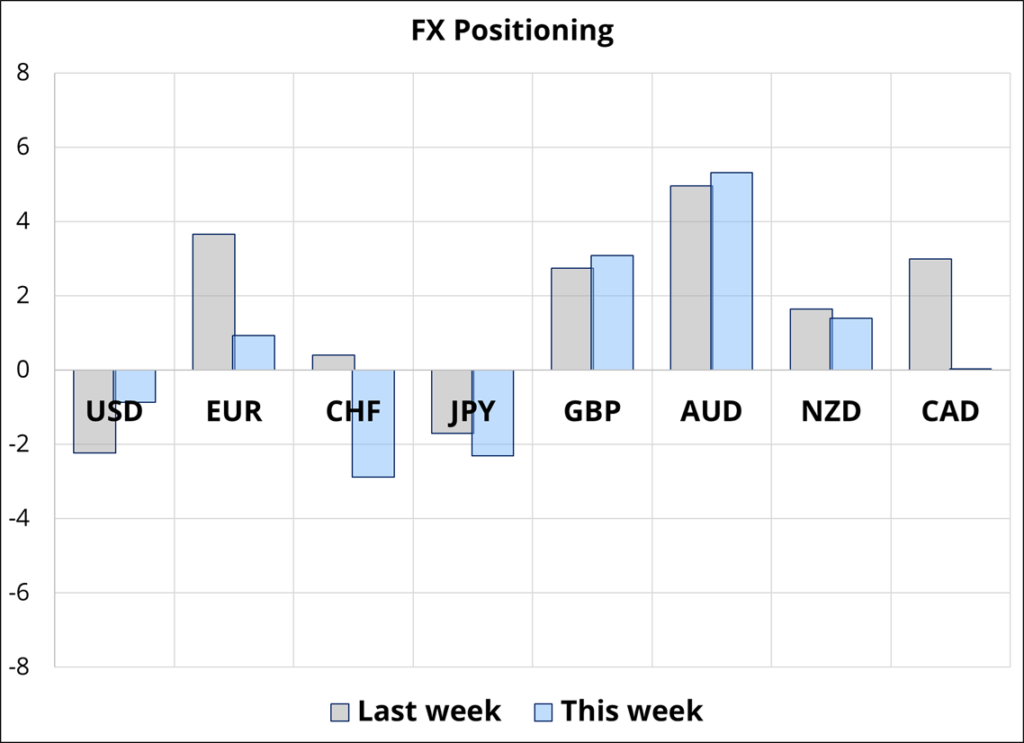
Flat (see text re medium term views)
Three interesting and related items came into my world late last week. The first was an analysis by Ben Hunt’s team over at Perscient. Here’s Ben:
In my long (30+ years now!) working experience with what we colloquially call ‘narratives’, I’ve consistently found the most value – whether that’s investment value, career value, or what have you – in identifying the stories that everyone believes are true but a) can be revealed as not true by a scheduled event like an election or an earnings release and b) will be supported as not true by a powerful missionary like a political party or a central bank. There’s asymmetric risk/reward in those conditions, as the breaking of the story will be priced more cheaply (because we all believe it’s true) than the joint probability of the story breaking in fact (condition a) and the story breaking in narrative (condition b) would otherwise imply. These situations are rare, but I think we have one today going into 2026. I would never have found it except for our Perscient Pro storyboards, and I’d like to show it to you now.
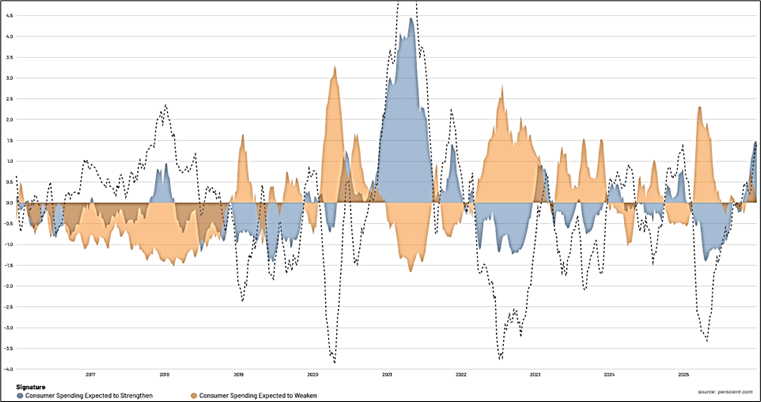
This is a 10-year chart of consumer spending expectations (as expressed in narrative space, what we call semantic signatures) as found in our Core Macro storyboard. The y-axis is +/- Z-scores, which is a measure of how unusual it is that the density of either narrative is either as ‘loud’ (+ Z-scores) or ‘quiet’ (- Z-scores) from its long-term average.
So today the story that “consumer spending is expected to strengthen” is about +1.5 Z-score above normal (think of this as 1.5 standard deviations above normal) and the story “consumer spending is expected to weaken” is about flat with its long-term average. The dotted line is the sum of the two scores, but with the sign flipped for the ‘bad’ narrative (ie, weakening) so that you’re seeing a composite narrative in the same semantic direction.
This is an investable signal to me for two reasons. First, this is the highest reading for the “consumer spending is expected to strengthen” narrative since 2021 when we were coming out of Covid, and the trough to current peak move here since April 2025 is pretty similar in scale to the trough to peak move in 2021. This is a big move, and stories about strengthening consumer spending (because of tax refunds or reduced withholding or whatever) are everywhere today. Moreover – and this the second reason I think this is an investable signal – this is all happening even as the other side of the argument, “consumer spending is expected to weaken”, is still pretty darn strong. Look at this chart and see how rare it is for both ‘strengthen’ and ‘weaken’ narratives to persist in positive form simultaneously, particularly at the beginning of a strengthening narrative cycle. These are narratives that are almost always mirror images of each other. There is rarely an argument in narrative-space about which way the consumer is going.
What the high score for “consumer spending is expected to strengthen” tells me is that consumer discretionary securities (stocks, bonds, whatever) are well bid and that the price for betting that this story breaks in Q1 is cheap. My belief is that a large portion of the US consumer spending base is highly stressed, and that there is a decent chance that this weakness will show up in one of the scheduled macro data releases in Q1 (condition a). What the persistent score for “consumer spending is expected to weaken” tells me is that there are both market participants but more importantly political participants (ie, the Democratic party) who want nothing more than to shout from the rooftops in an election year that the US consumer has fallen and can’t get up (condition b).
I may be wrong. Consumer spending may absolutely rock in Q1 on the back of tax refunds and tariff checks or whatever. But I’m getting a good price to go the other way on that trade, and I’ve got scheduled events as catalysts and a highly motivated missionary to support the breaking of the story. This is what a narrative-based trade looks like.
All the best,
Ben
The second related item: The Economist Magazine published a cover on affordability that features a sad-face emoji. As you probably know, that particular magazine has an astonishing track record of marking turning points in major narratives. This was true when Greg Marks and I first backtested all covers 1997 to 2016, and it was true when I ran the study again in 2021 and found it had worked well, out of sample, for five years. And it has worked well out of sample 2022 to 2025, too. Full write up / explanation is here.
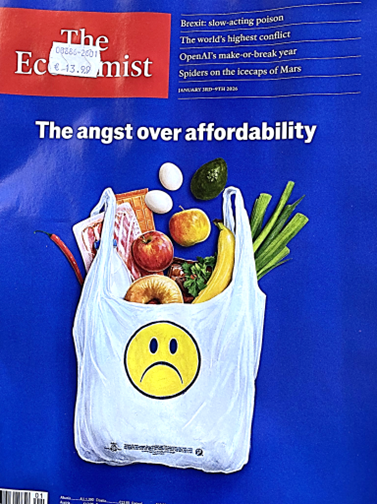
Nothing says “affordability angst” like a magazine that costs $16.34[1]!
Here are the trades generated by The Economist in real-time over the past twelve months:
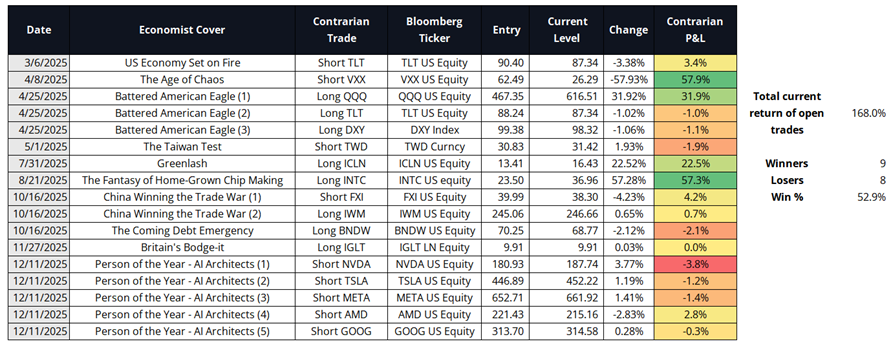
Note that trades with multiple legs are not double- or triple-counted. For example each leg of the 12/11/2025 trade contributes 20% to the total P&L that feeds to the overall total.
If I were to imagine the opposite of an affordability crisis, that would involve lower inflation and higher bond prices.
Third, Bob Elliott posted the following chart. It makes me wonder if maybe we are overestimating the stimulatory benefits of the OBBB as health care payments are about to blow higher, SNAP is forcing young adult applicants to navigate more red tape and benefit cuts, and wage garnishment for student loans restarts in January 2026. I am always biased to believe the steady state base case in the US, but I agree with Ben’s assessment that the market is not intellectually ready for a consumer slowdown right now. Much consumer spending positivity is priced in for H12026. The pushback against this chart could be that the low-end doesn’t matter because they don’t spend very much.
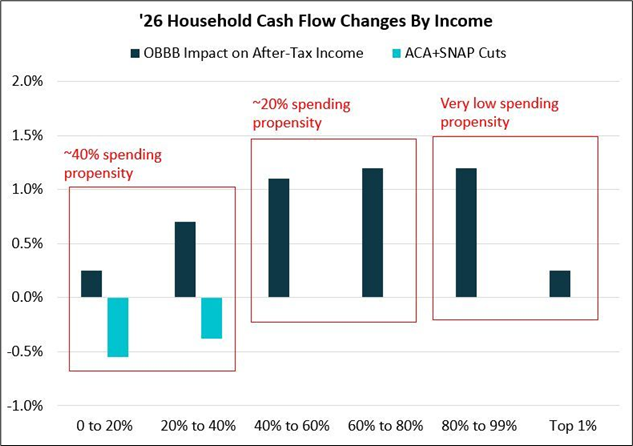
Yes, they are more likely to spend marginal income, but they don’t have very much income to spend. The bottom 40% accounts for about 22% of total spending in the U.S. That’s not nothing and I suppose if it’s weak enough it could matter?
Finally, maybe inflation is heading lower. Private real-time inflation data offers some encouragement as well. Here’s the latest from PriceStats:
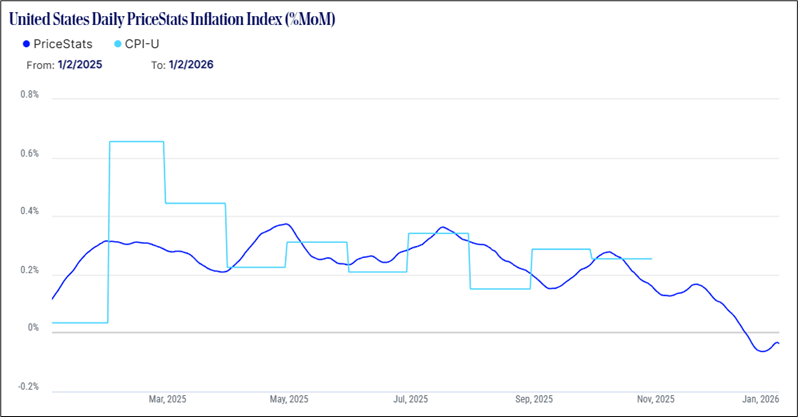
In conclusion, you have four reasonable inputs to a bond-bullish trade idea:
New feature in am/FX: In order to accommodate longer-term trade ideas without jamming up the “Current Trades” section, I am going to create a new category of medium-term trades and mark them to market in am/FX on ~ the 5th of each month for your tracking pleasure. The first medium-term trade will be to buy TLT here ($87.25) with a stop loss at $79.71. The stop is quite far away as it’s a 6-month trade. Risking 7.50 to make 12 kind of thing and you get paid if it goes nowhere. I prefer the linear expression, but if you want leverage, you can buy a 17JUL26 (6.5 months), 15-delta TLT call ($95 strike off current $87.25).
While optimizing theoretical sizing considerations is not really my main objective in am/FX, I still need to pick a $ at risk for the medium-term trades. For simplicity, I will use $100k (2.5% of capital) for these long-term trades (same as the short-term trades). This is arbitrary because I have no idea how many bigger picture trades I’ll end up doing in here. If I do 50 of them in one year, this would obviously introduce many issues around risk (it’s a lot of risk) and correlation (I have no idea what my correlations are). If I do three of these all year, they won’t move the needle compared to 40 or 50 short-term trades annually. The main point is to track these bigger picture trades and see if they work. To do that, I need to lay down all the rules ahead of time so as to maintain some semblance of honesty and rigor. I will try to be mindful if I notice that I am stacking a ton of regime-sensitive and highly correlated trades in the medium-term book.
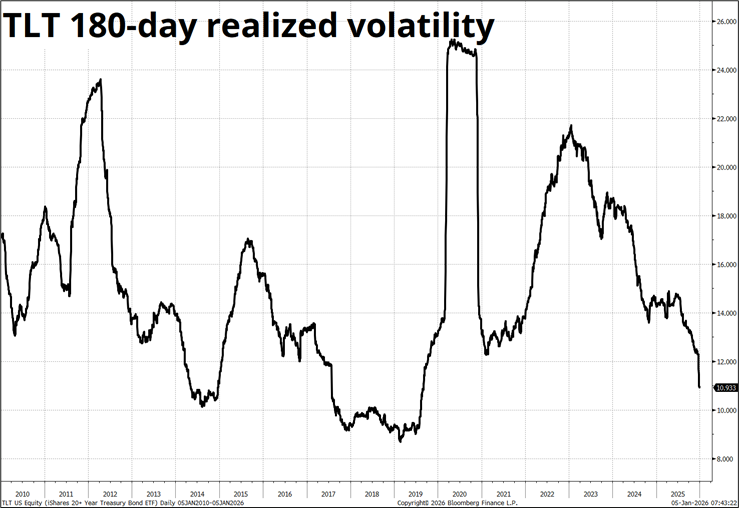
Finally: TLT is trading at $87.30. My guess would have been that the 15-delta call would be closer to 99/100, not 95. Bond vol is cheap! It’s cheap for a reason, though.
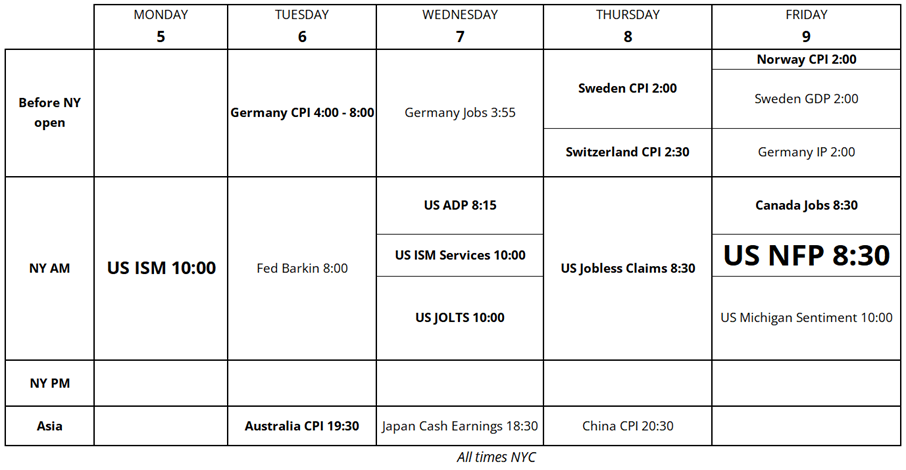
Global CPI and North American jobs on the docket.
Inflation, while sticky in most countries, is rangebound and unscary.
Here is the calendar for this week:
https://www.gurwinder.blog/p/26-useful-concepts-for-2026
Have a beautifully mathematical day.
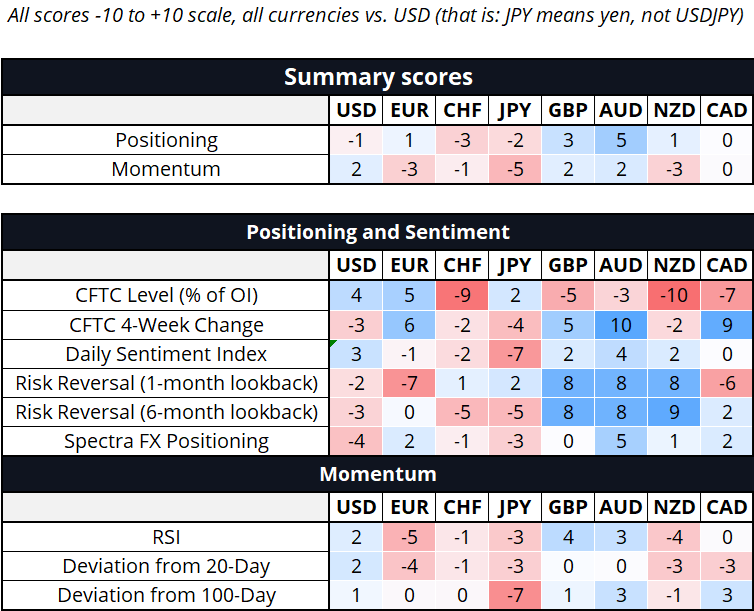
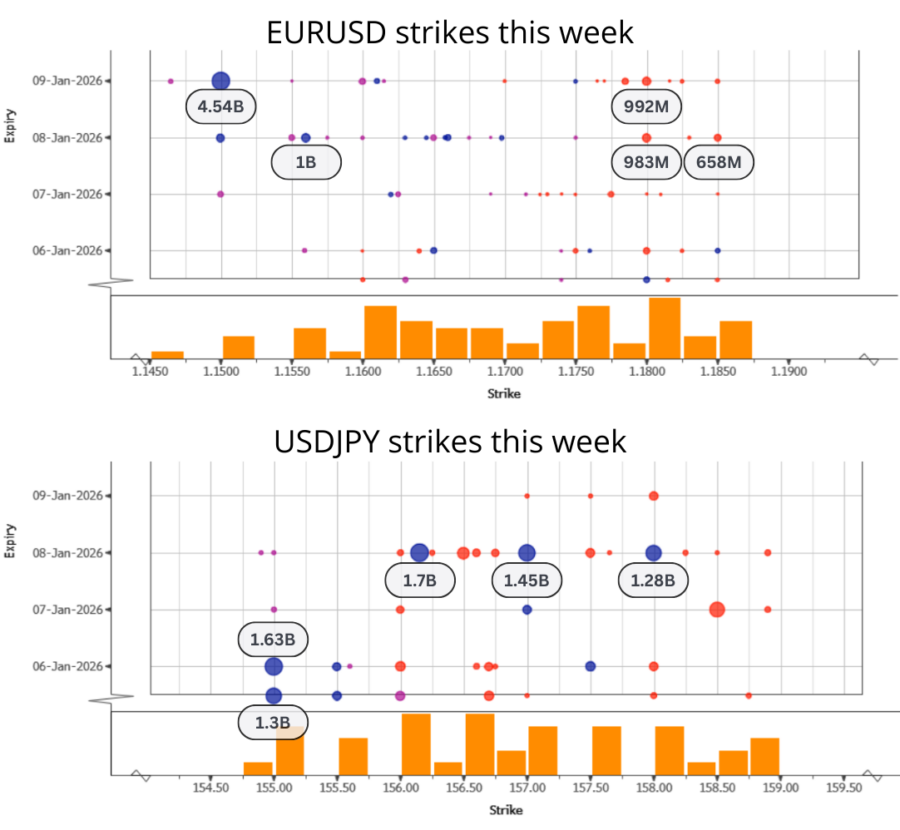
Hi. Welcome to this week’s report. The CFTC data has almost caught up (currently as of 23DEC25) and while our report shows the market tiny short USD, it’s worth mentioning that multiple bank positioning reports show much larger USD shorts than we do. I would guess that our report understates the USD short a bit because the big short CHF position is skewing things a bit and the USDJPY long is offsetting larger USD shorts in EUR and AUD. Big USDJPY strikes pre-NFP.
If you divide 1 by 998001, the result is the numbers from 000 to 999, in order. Except 998.
1/998001 = 0.000001002003… 994995996997999…
This happens because 998001is 9992
A similar answer emerges from 1/92 and 1/992
1/81 = 0.0123456790123
Underyling structure comes from:
Explanatory video featuring super happy math guy here
—
[1] EURUSD spot reference: 1.1678
