Tomorrow’s CPI so let’s think about tomorrow’s CPI

Not sure I would buy one of these for $1,000, but you have to admit these guys are pretty good at ruffling people’s feathers lol.

Tomorrow’s CPI so let’s think about tomorrow’s CPI

Not sure I would buy one of these for $1,000, but you have to admit these guys are pretty good at ruffling people’s feathers lol.
Long EURGBP @ 0.8674
Stop loss 0.8589
Long 26AUG 1.8050 EURAUD call
Cost ~36bps Spot ref. 1.7790
Long 26AUG 0.8760 EURGBP call
Cost ~33bps Spot ref. 0.8680
Tomorrow, tomorrow, we get CPI and we are now entering the period where the US data might actually mean something. Tariff revenue has been coming in since May, but most of the goods sold in April and May would have been untariffed goods that were hurriedly brought in as frontloading dominated. Over the next few months, the tariffed goods will be purchased, and we will see who pays what portion of the tax.
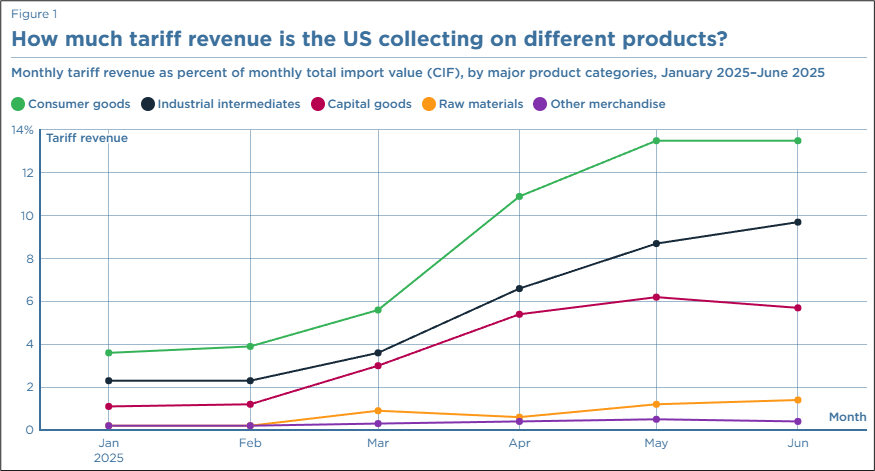
If there is no evidence of a meaningful change in inflation dynamics in July (that is, in the data released tomorrow), the people on the inflationary side of the debate are going to need to start adjusting their priors. And of course, the same holds true in the other direction. There is obviously a lot more going on with inflation data than just consumer goods, and airfares, used cars, health care, and shelter are often dominant. But the goods side will be the most interesting.
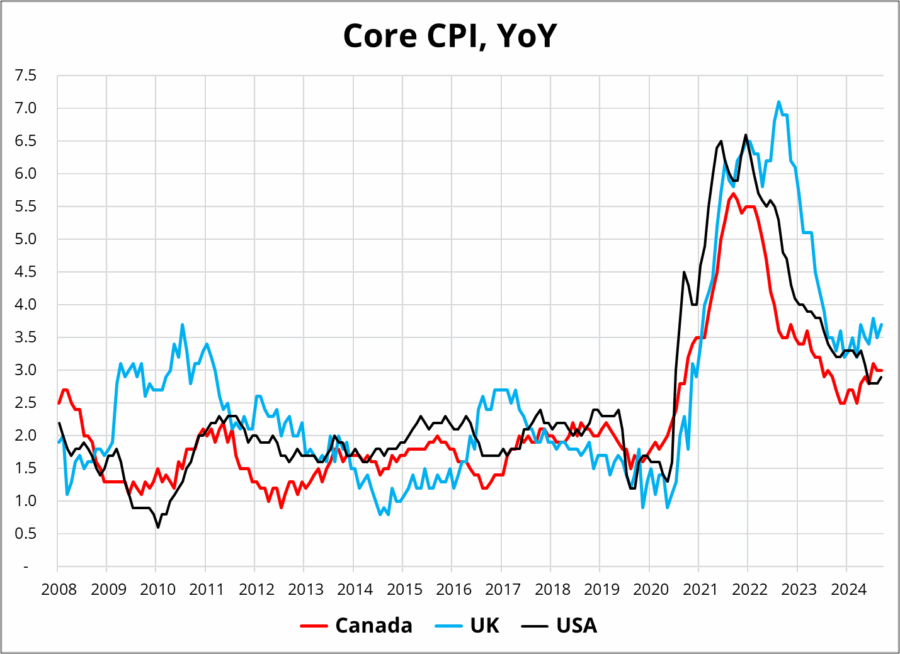
The USA faces the same issue faced by Canada and the UK: Inflation is sticky and way above target, but the employment situation looks rickety. While the US Unemployment Rate has not risen like it has in Canada and the UK, labor demand’s underbelly is soft. The difference in the US is that the supply of labor is contracting at about the same rate as the demand for labor and thus the UR hasn’t budged.
Here are the Unemployment and Core Inflation rates in the three countries:

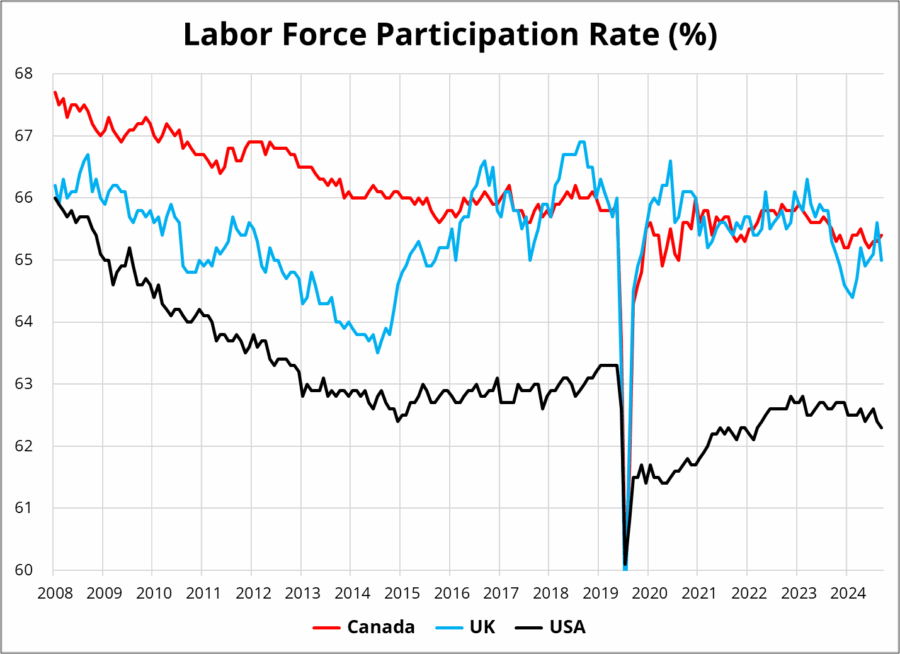
And then dispersion in the unemployment rate is pretty much all explained by differences in the evolution of Labor Force Participation in the three nations. Take falling LFPR and add an immigration crackdown (Canada and USA) and you get a labor market that has less slack than normal, even as demand for labor falls.
Three weakening economies with very little slack is mildly stagflationary. We are likely to see persistent strength in wages (as we have seen in recent data) and tricky setups for central banks. With the Fed fully priced for September, 2.3 cuts now priced for 2025 after Bowman floated a three-cut view, and equities and crypto in full Krakatoa mode, I would think a strong CPI figure catches the market offside much more than a weak one.
It’s also notable to me that USDJPY continues to levitate on a 147 handle despite the big drop in US yields. There’s some kind of permabid in USDJPY that is hard to explain, but impossible to ignore.
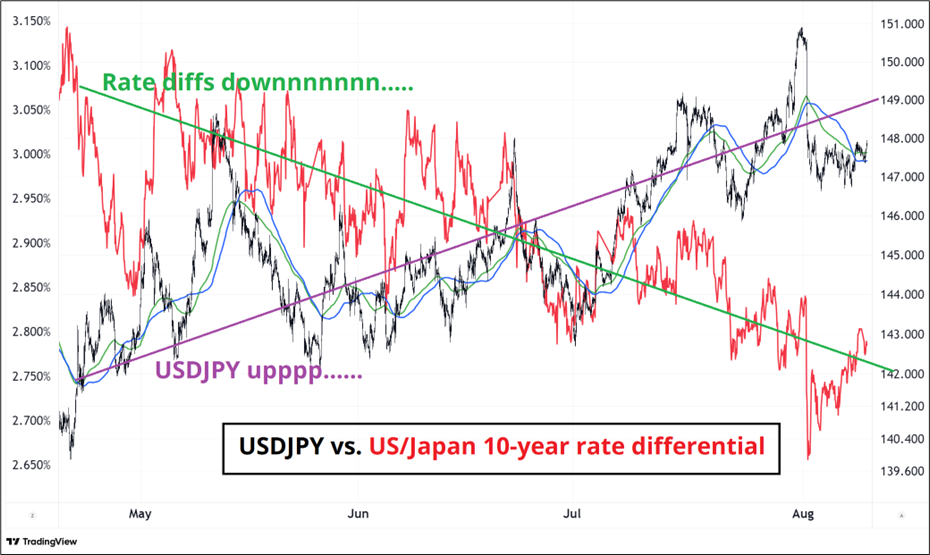
This chart is an excellent example of why looking at correlation of changes can sometimes lead to spurious conclusions. If you look at data from May 1 to now, you will see that the correlation of changes between USDJPY and rate differentials is +0.43. That’s the magic of correlation. If the response function of the currency pair is that it goes down a bit when yields go down a lot and it goes up a lot when yields go up a bit, the correlation can be strongly positive, even as one thing goes up and the other goes down. The more you learn about r-squared and correlation, the less useful you realize it is in real life.
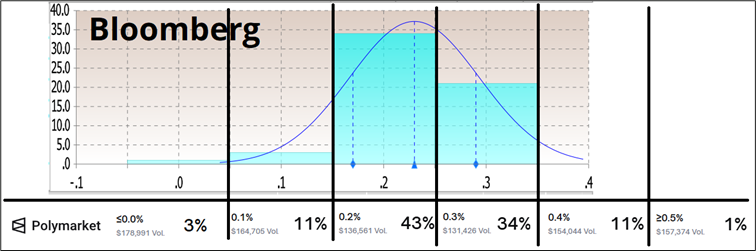
Going back to the topic at hand: CPI. Here is the distribution of expectations. The top shows the Bloomberg consensus and below that I have used my world-class MS Paint® skills to show you the distribution of expectations on Polymarket. You can see that (as usual) the Bloomberg consensus is more tightly wound around consensus, while Polymarket shows less herding and a more realistic distribution. The odds of 0.3% have been rising a bit over the last week. Note that volumes are high for this contract on Polymarket, so the data looks reliable to me. The bid/offer is two cents wide.
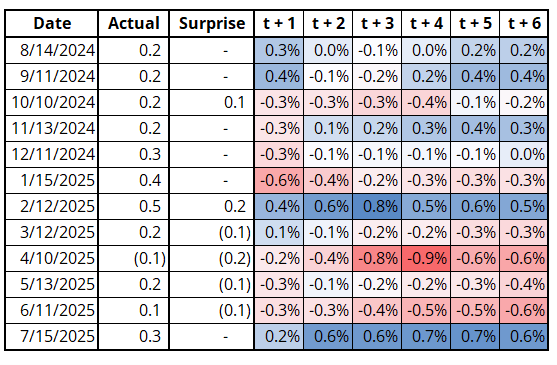
A couple of things to note if you plan to trade CPI. First of all, last month’s data came in as expected, but the guts were mildly supportive of the idea of rising goods inflation due to tariffs, so the USD rallied. This table shows the last one year’s worth of Core CPI releases and the USDJPY reaction in the six hours after the release.
The second thing worth noting is that while I keep declaring each of these economic data points to be an exciting window into the future of the US economy, the reality is that USDJPY and yields are making their extremes on CPI and NFP and then mean reverting after, not following through.
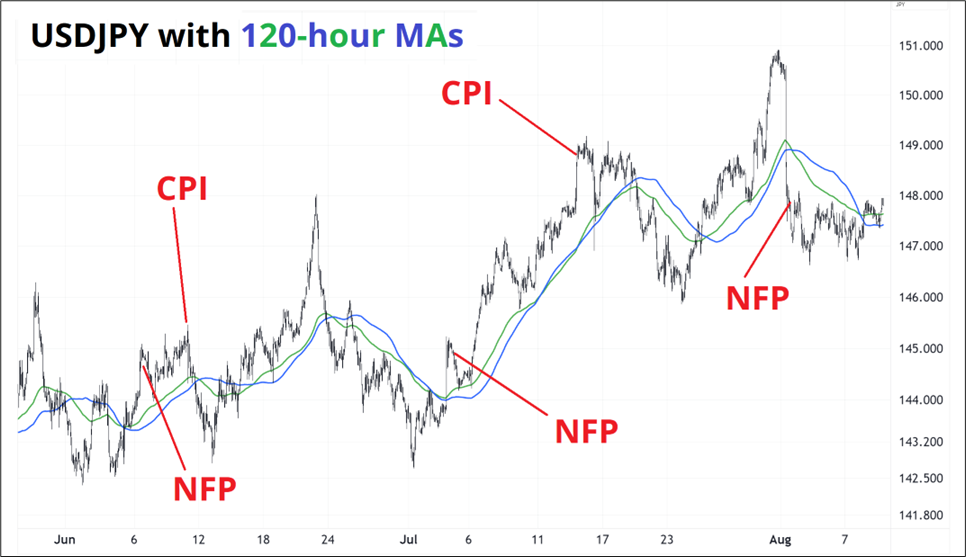
I suppose you could say, from this tiny sample, that NFP has followed through a bit more than CPI. Finally, note that USDJPY is above the two moving averages and those MAs have been a pretty OK measure of the primary hourly trend since June.
Net net, my bias is to be small or medium long USD and short stocks into CPI, not because I see any edge on the outcome (it looks 50/50 to me) but I think the reaction will be asymmetric due to market pricing. We are back to max complacency so a strong CPI would shake the market’s tree a bit.
i. Milwaukee Brewers
ii. Toronto Blue Jays
Have a simultaneously luxurious and low brow week.
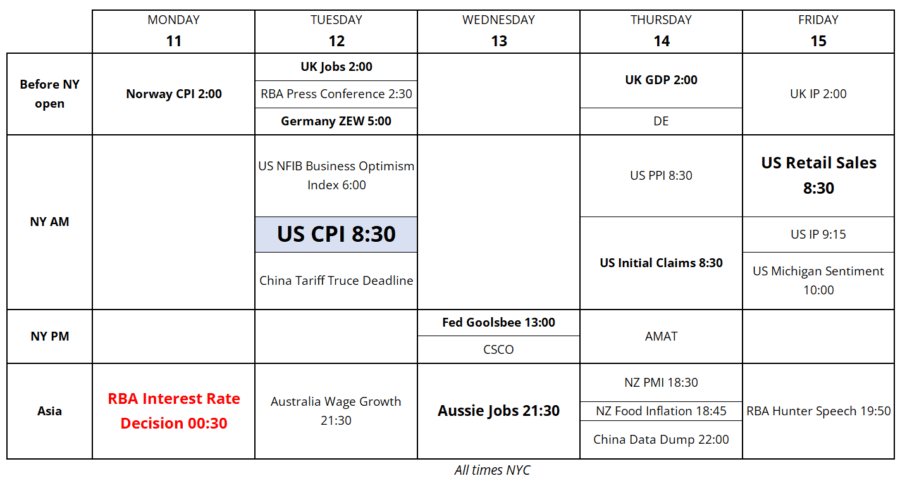
Trading Calendar for the Week of August 11, 2025
Need a new shopping bag?
This one is reasonably priced just $1,000 or so.

HT CHUCK
