The interest rate differential vs. USDJPY correlation is gone for now.

Moonbow over Maui
Rainbows are just one type of bow (optical refraction phenomenon).
There are also moonbows, dewbows, and fogbows.

Dewbow on a spider web

The interest rate differential vs. USDJPY correlation is gone for now.

Moonbow over Maui
Rainbows are just one type of bow (optical refraction phenomenon).
There are also moonbows, dewbows, and fogbows.
Dewbow on a spider web
Flat
Before we get started, many readers asked for the spreadsheet I used for the chart showing relative strength of currencies discussed on Friday in am/FX: Fed, Japan, and Learnings. If you would like to have a look, the spreadsheet is available on our website by clicking here. I acknowledge that it’s hard to use someone else’s xls, but hopefully this is self-explanatory enough. It requires Bloomberg connection to Excel.
https://www.spectramarkets.com/relative-strength-spreadsheet/
We make custom studies like this for Spectra FX clients all the time, so if you would like FX spot and options coverage (and you work at a hedge fund that uses a prime broker), please reach out to me directly on Bloomberg.
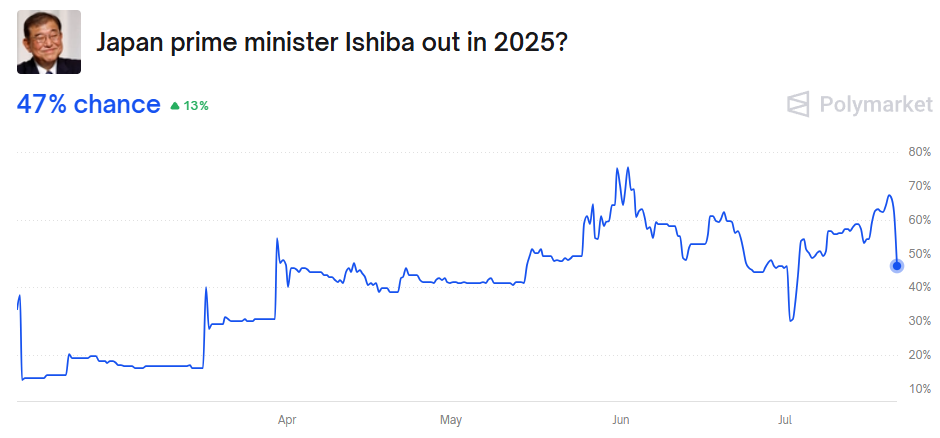
The Japanese election was as close to a nothingburger as we could get as the LDP take down just enough seats to keep Ishiba in power, but not enough seats to retain control of the upper chamber. This is the worst outcome for anyone that owns any JPY options and my view that we would see a big move was wrong.
Going forward, I don’t see a major trade here as it’s still a coin toss as to whether or not Ishiba will survive.
As discussed Friday, I’m not sure what to make of USDJPY in here as seasonality is super bearish into the end of July and US yields are dropping on one hand but on the other hand, there is no JPY-positive narrative, no Japanese rotation into JGBs so far, and no strong USD down trade going on. It feels like a crosswinds situation.
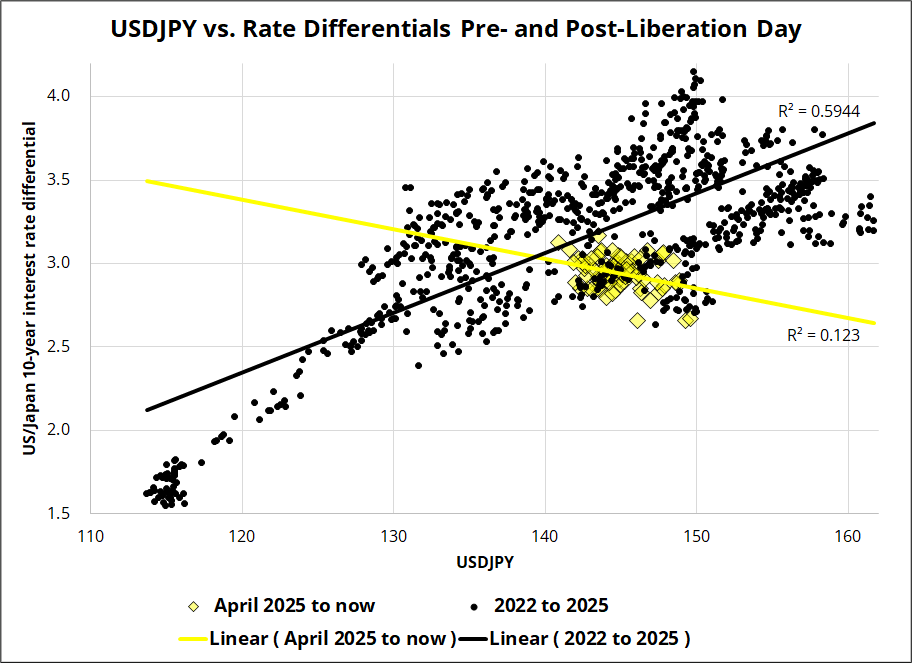
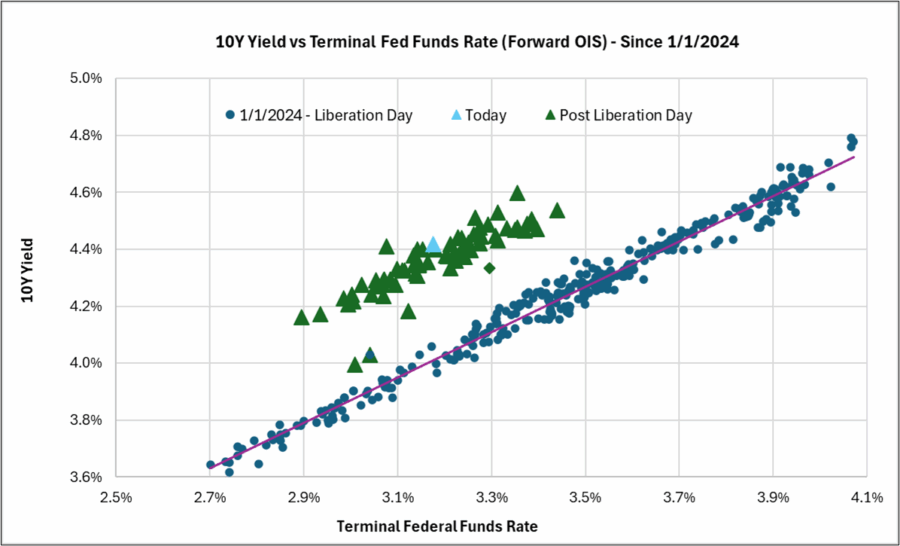
Speaking of interest rate differentials… Are they driving USDJPY at all right now? Obviously, we had an insane correlation break on Liberation Day as yields went up and USDJPY went down, but often these phase shifts are then followed by a resumption of the old correlation, at new levels. Let’s see.
The simplest way to look at the yields vs. USDJPY correlation is to examine pre- and post-Liberation Day. You get a scatter that looks like this:
If we chop it up more finely by regime, we get this:
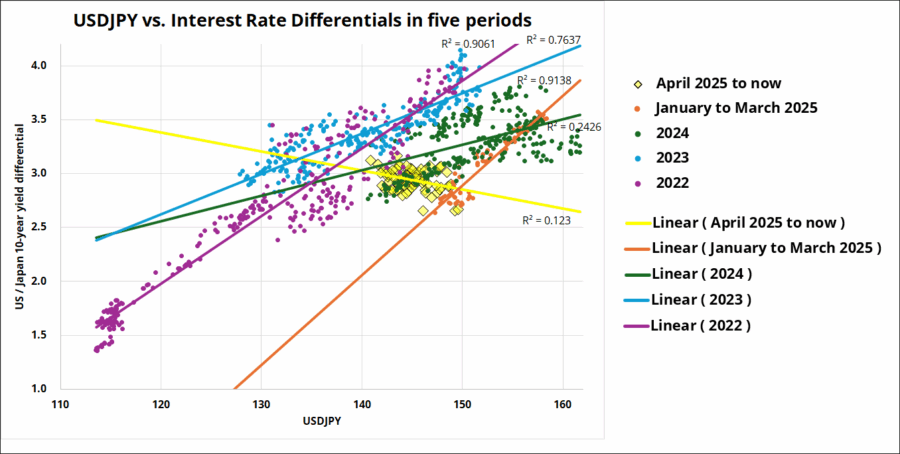
You can clearly see in those charts that the positive relationship between rate differentials and USDJPY broke down in April 2025 and flipped to a weak negative correlation. This is all because of price action in April 2025. If you look at this year only, month by month, it looks like this:
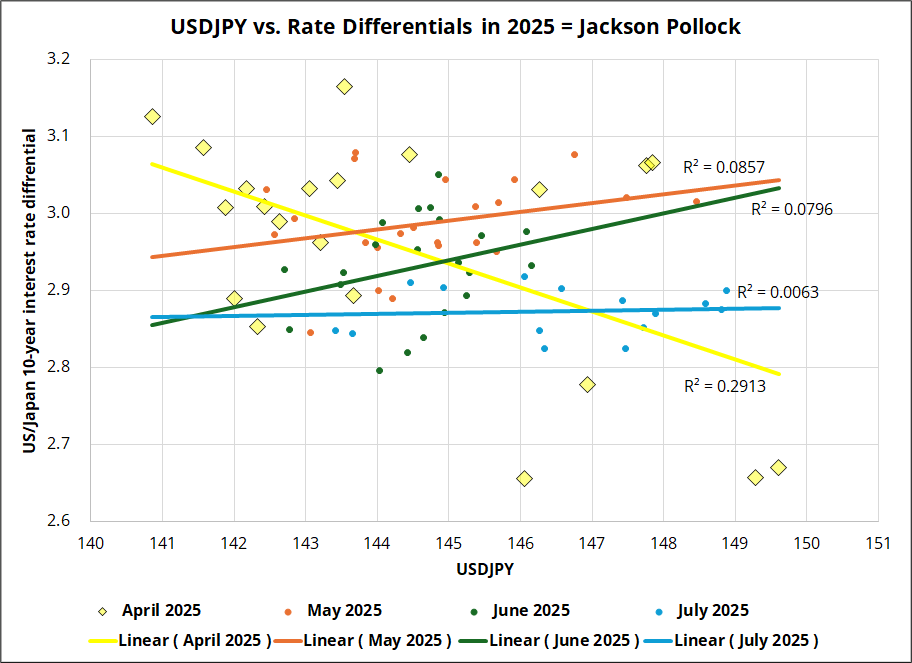
The takeaway is that interest rate differentials, which drove USJDPY from 2022 to 2024, reversed their correlation after Liberation Day, then went to something close to zero correlation once the dust settled. This is in contrast to the way the correlation between terminal Fed Funds and the 30-year yield broke and then resumed after Liberation Day. You can see that in this chart provided by Chris.
The crypto treasury fad is the 2025 equivalent of the ICO craze and CryptoKitties in 2017, the SPAC bubble in 2021, or the NFT mania in 2022. People were paying $2 for $1 worth of crypto this year, but that seems to have hit a wall now as the supply of these things will remain infinite until the joke becomes unfunny. That seems to be happening now. The chart here shows the kind of reception companies received when they announced they were buying crypto earlier in 2025.
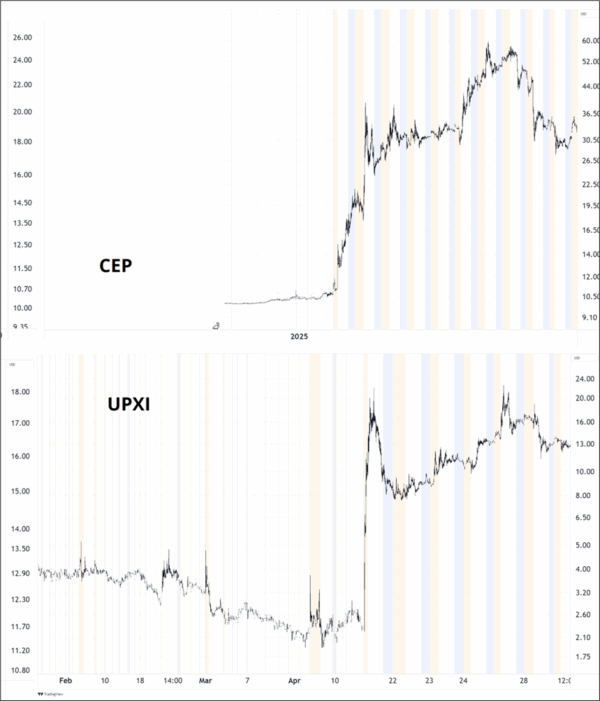
And below are the last two announced in the past few days. CEPO is a big bitcoin treasury play, while DYNX is ETH.
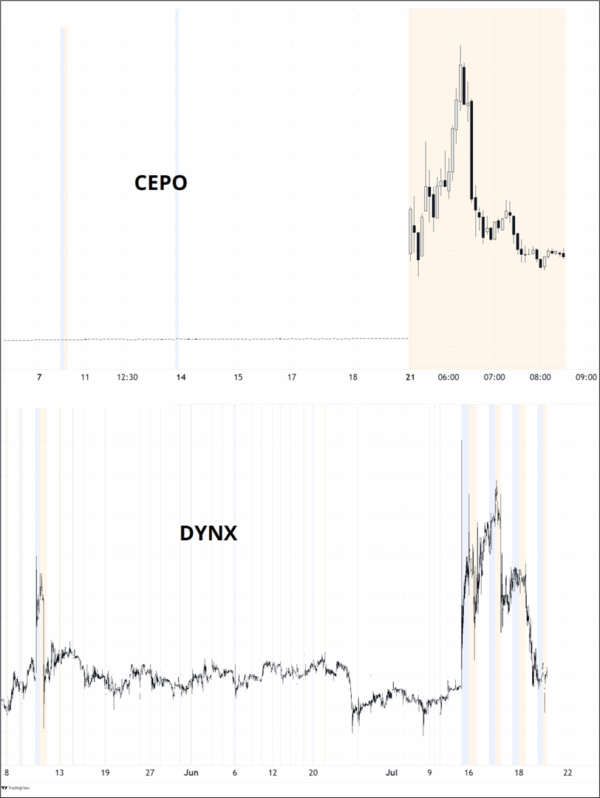
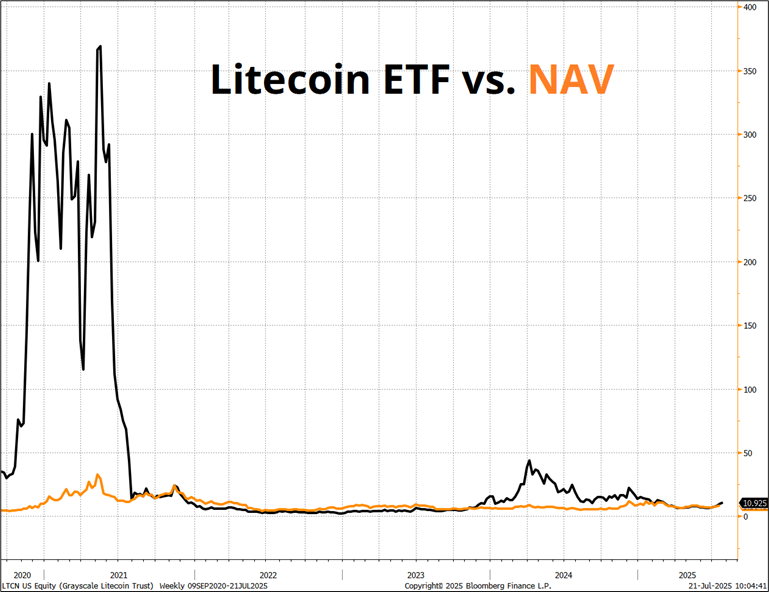
Much as there was a limit to how long people would pay $50,000 for GBTC when its NAV was $10,000, and people paid $350 for the Litecoin ETF when its NAV was $20, there is a limit to how many MSTR copycats people will chase at >2X NAV. There is no reason these companies cannot trade below NAV at some point. The premium is procyclical and in the next crypto downdraft, I would expect many of these stocks to trade below NAV. Saylor is doing cool stuff; these guys are just looking for fish kind enough to provide exit liquidity. Markets are stupid, but they are not stupid forever.
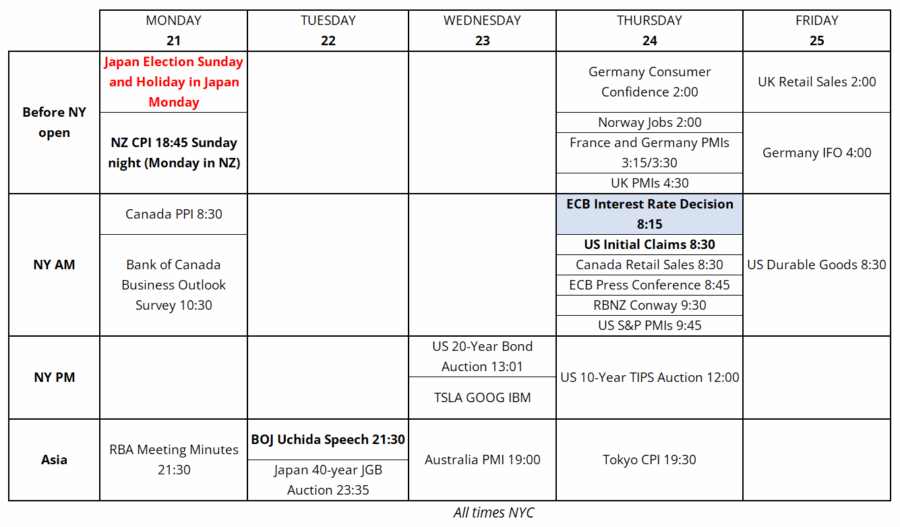
Trading Calendar for the Week of July 21, 2025

A 360-degree fogbow
Rainbows are just one type of bow (optical refraction phenomenon).
There are also moonbows, dewbows, and fogbows.

A waterborne dewbow
