JPY might get tricky here for a bit
Qube tip

JPY might get tricky here for a bit

Qube tip
Long 12MAY 168/163 put spread in CHFJPY
~31bps off 175.25
We are approaching a critical level in USDJPY here. The top panel shows the massive horizontal line that defines the neckline of a giant Head and Shoulders pattern at 139.80/140.30 while the bottom panel shows all the USDJPY strikes over the next month. The biggest confluence of strikes is at 140.00 as we have about 10 billion USD of 140s coming off between now and May 16.
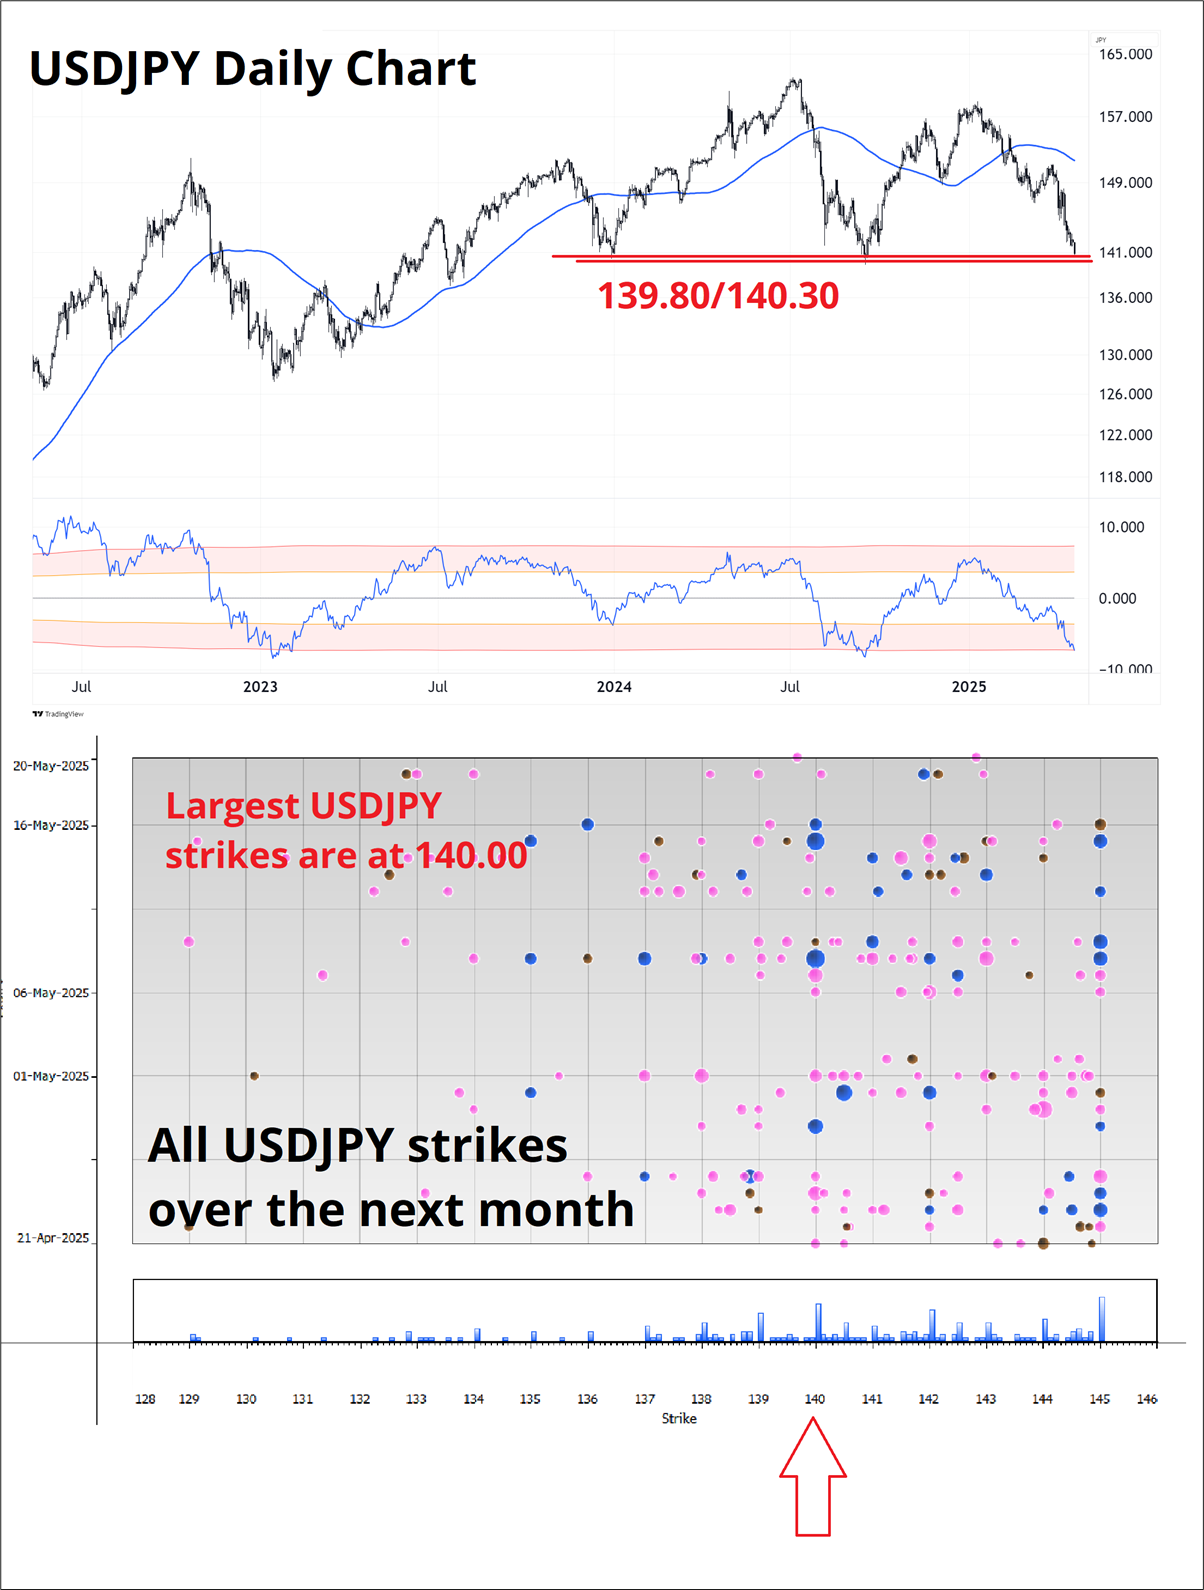
If you are short USDJPY, you need to either reduce or have a strong view that upcoming Bessent / Kato talks will yield something JPY positive. My CHFJPY put spread idea is working fairly well (in slow motion) despite the fact that Sight Deposits out of Switzerland showed no change last night. I would have thought that would be negative for EURCHF, and yet here we are. The pair has held the epic 0.9210/40 zone while EURJPY tops out a bit and USDJPY tickles the 2024 double bottom.
While Japan and the US are in general agreement that a stronger JPY could be helpful, it’s unclear what form any agreement might possibly take given options such as coordinated intervention, currency clauses, and demands for further interest rate hikes from the Bank of Japan all feel somewhere between very and completely unrealistic and impractical. While Japan clearly does not want USDJPY ramping to new highs and causing more inflation, it’s already 22 big figures off the high and trending nicely. While the US would love USDJPY at 100, Japan almost certainly would not.
As such, I am not holding my breath for a watershed announcement, but at the same time, I don’t think a lack of a firm announcement will trigger that huge of a rally in USDJPY. The trend is strong and while positioning is meaningful, JPY positioning tends to correctly follow the trend most of the time and does not pose a massive threat.
Long JPY positioning out there is mostly via options, it’s more likely to create huge pockets of gamma at 140 and 135 than to trigger a massive short squeeze.
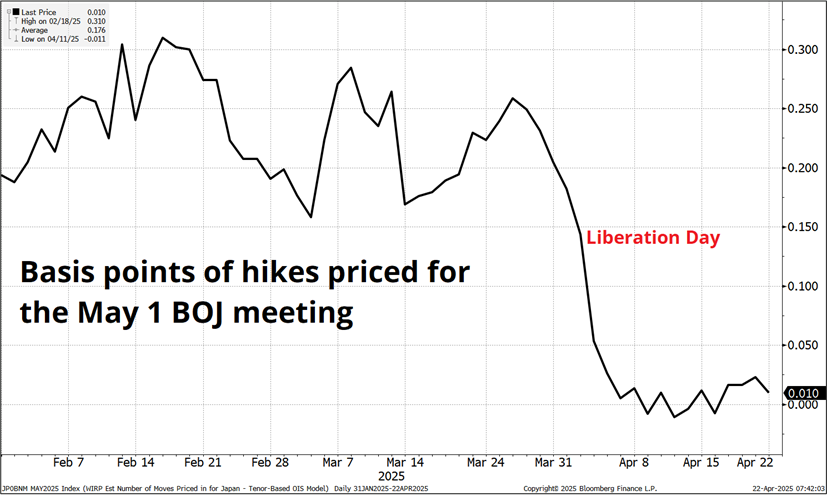
And you never know, sometimes big agreements do happen. There is nothing priced in for the May 1 BOJ meeting, so there is room for a JPY-positive surprise as the market has completely removed the odds of a hike due to the global trade war.
Furthermore, a complete breakdown in US-Japan talks is USDJPY negative as stocks will surely react negatively because if the US can’t get a deal with Japan, can it get a deal with anyone?
My longtime friend Sal told me a great story yesterday. A story I had never heard before. Here it is:
In 1998, my grandad gave me 100 USD and the next day as I was walking past some money changers saw that for $100 I could get 14,500 yen. I figured more yen means more money so let’s exchange them! Three days later I got yelled at by my grandad when I showed him the wad of yen bills, so I had to return to the money changers and buy the USD back.
Somehow, I got 120 USD back! I wasn’t sure what was happening – maybe the fella made a mistake? So I went to the shoe shop next door and bought myself pair of shoes for 20 bucks. Then I went home and showed the 100 USD to my grandad. It was only 10 years later when I started in FX that I realized I had traded through a 6-sigma event in USDJPY in 1998 with that $100 bill.
BRENT
11:19:44 Hahahahaha cmon is this true ??
SALEH
11:20:01 Swear on grandad, God rest his soul.
To be clear, I am always talking about gold as a trading vehicle here, not as an investment or an insurance scheme or anything long-term. I think you can make money long and short in up trends because massive up trends like gold, NVDA, WMT, or CSCO (for example) offer amazing countertrend moves as volatility is high and excitement levels are like it’s a 2025 Oasis concert. When the crowd is involved, the two-way action gets hot, and you can make money both ways. I have made money both long and short gold in recent months, despite the skyrocketing moonshot.
Anyhoo, just wanted to preface it that way because many view long gold as a deterministic long-term bet with a guaranteed payoff, or a religion. I just see it as a number on a screen. So right now, we are at levels of overbought that have generally signaled tops. Here’s the chart, which shows the price and its divergence from the 120-day moving average. You can see that prior extensions where gold went 20% above or below the MA were major turning points, every time. Sample size is only 9, but still. The chart is split into two periods, 2000 to 2011 and then 2011 to now simply because TradingView won’t let me put 25 years of daily data in one chart.
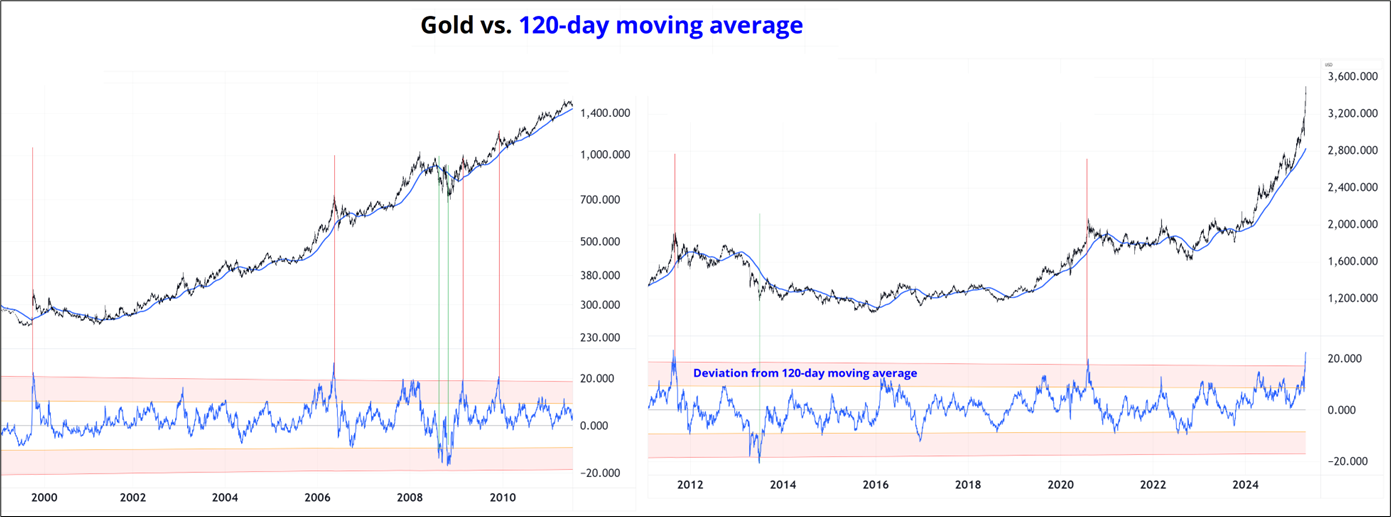
But if you’re bullish, I have good news for you. Guess the one time that gold went 20% above the MA and then kept on keeping on? Yep, 1980.
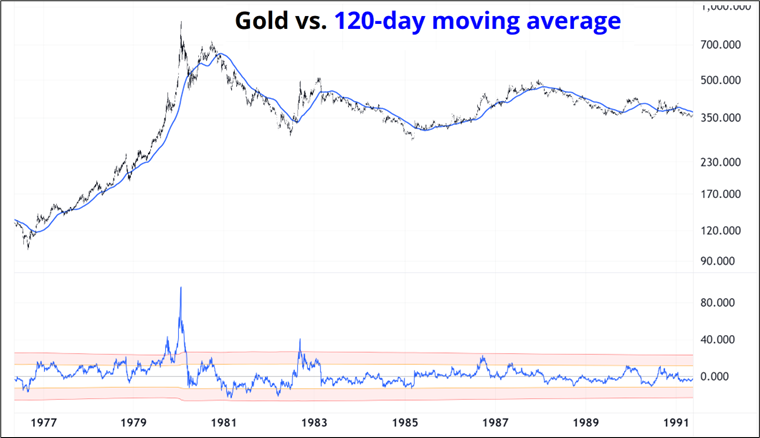
So if you believe we are in a similar monetary reset to 1980, you could argue that another doubling of gold is imminent just like gold doubled after going 20% above the MA in 1980. That was one heck of a mania, and anyone that bought gold in 1980 was underwater for the next 28 years (plus they lost the opportunity to lock in 10% yields, so it was doubly disastrous). Short with a stop above the highs might work. These are the sorts of trades you can try three times and if it works the third time, you net make a lot of money.
As a trader, I would not be long gold here, despite the persistent Asian demand and the compelling narrative. 20% above the MA was enough in the GFC, the Eurozone Crisis, and COVID. It’s probably just about enough now too. Chris Dover, who I find to have informative stuff quite often on X (but I don’t know him and cannot vouch for him), posted a similar thought process, but compared the overbought nature and positioning in gold to the oversold price of oil and the positioning setup there. From this he likes the RV trade. The tweet is here.
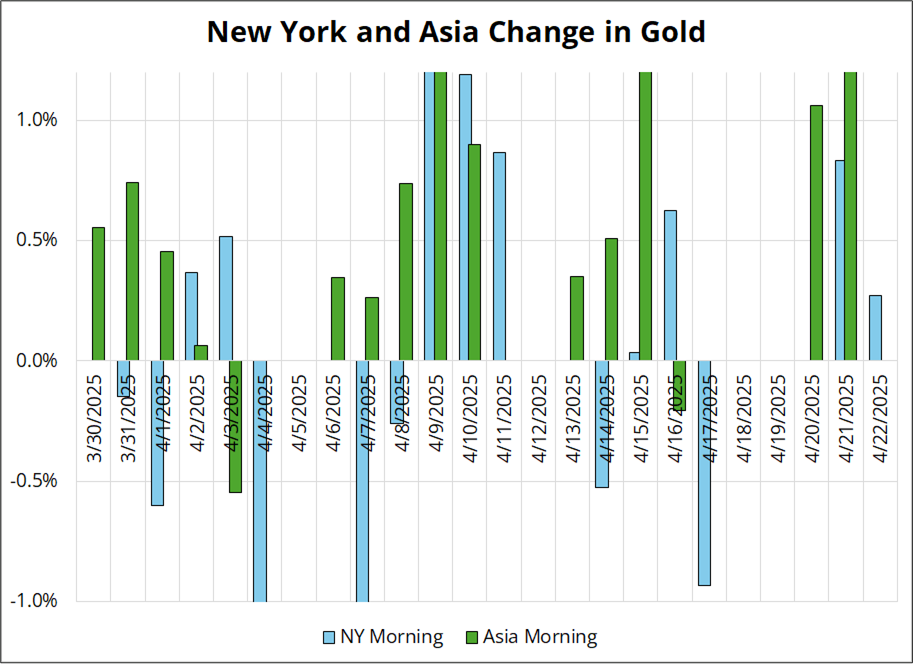
If you are reluctant to short gold, there’s always silver. It’s way less scary. Asia continues to Pac-Man all the gold. It’s up 14 of the last 16 trading sessions in China. See chart (green bars). Madness.
Have a sculpted day.
Still short AUD, oddly
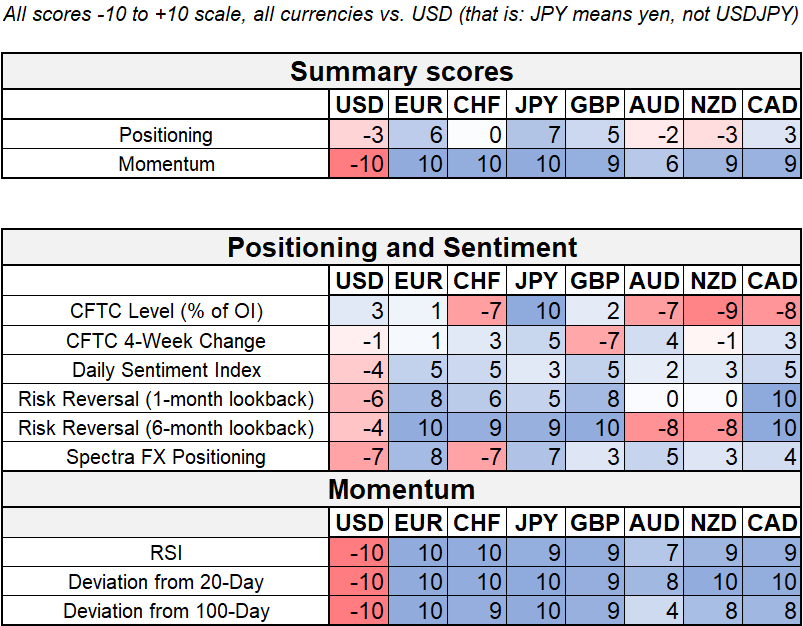
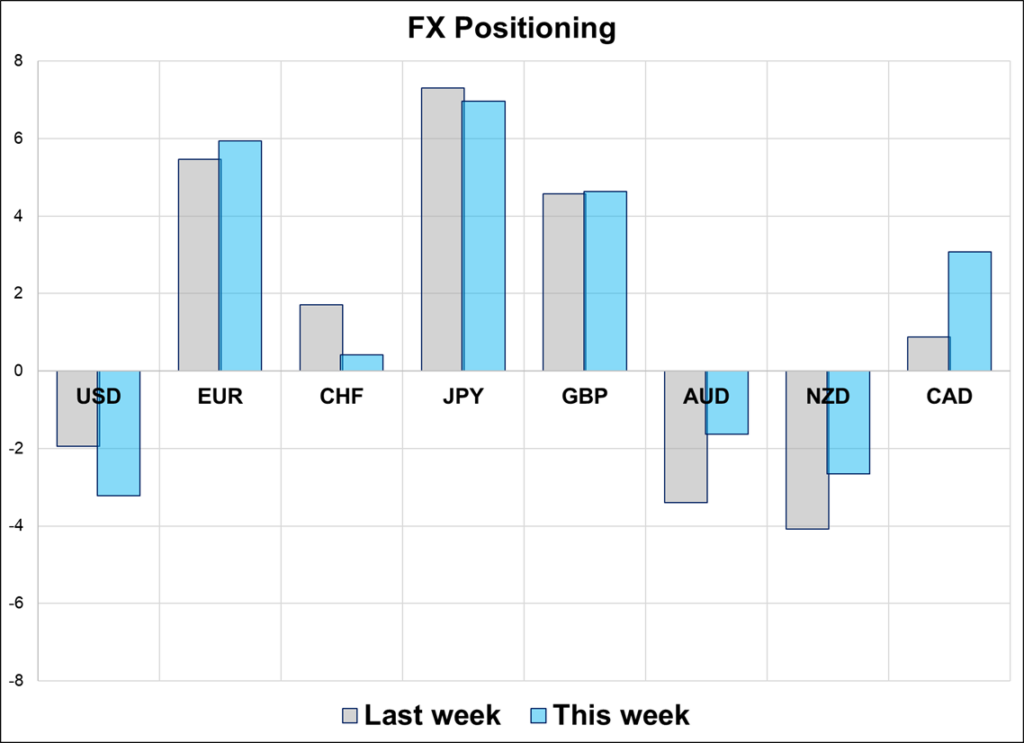
Hi. Welcome to this week’s report. The market continues to sit long a ton of EUR and JPY while AUD, NZD, and CAD show mixed results because specs are long but the CFTC remains short. USD down momentum looks to have peaked yesterday and now we await new information that will either ratify the USD down move or arrest it. My timeline on Twitter yesterday included only tweets containing the words: END OF AMERICA. Let’s see.