
Corrs, Revolving Doors, and “Stable” Coins

Reminder: MTC goes paid, effective June 1
To sign up click here, and choose “Crypto – Yearly”
Super short market update
I’m still cautiously bullish crypto as I think bitcoin will stabilize even as US equities may see more pain. I am sizing appropriately in preparation for more downside pain in equities that will drag crypto lower (but not too much lower).
I like buying BTC from here all the way down to 20k and I’m long SOL. My stop in SOL is $39—that one was supposed to be more of a tactical trade. The BTC, on the other hand, is more of a swing trade which I hope will be a multi-monther. See MTC #11: Sober for the logic on the BTC scaling in process and the SOL tactical long.
Corrs
Crypto markets have been eerily calm since bitcoin’s 25390 LUNA-driven blowoff bottom, even as the NASDAQ continues to dive and soar wildly, like a Howard Hughes XF-11. Here are the daily moves (in standard deviations) of the NASDAQ, BTC, and ETH in the days after the May 9th LUNA/UST debacle.
NASDAQ, BTC and ETC MOVES (in STDDEV, weekdays since May 10)
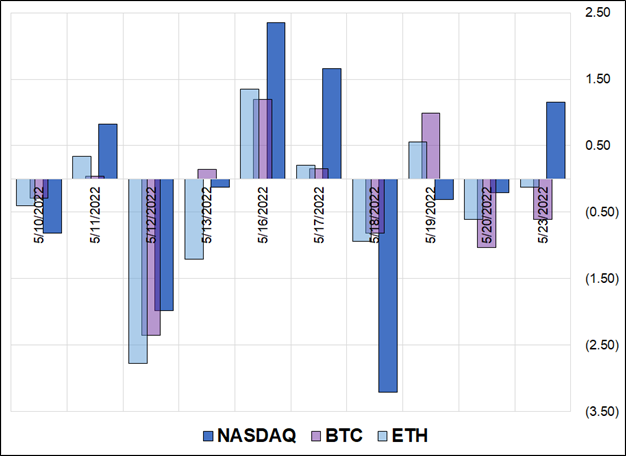
The dark blue bars represent the NASDAQ, and you can see that starting May 16th, crypto hasn’t done much on the big NASDAQ moves. That’s weird. Normally you would expect the bars to look more like May 12, where everything moves roughly the same amount, most of the time. Instead, relative NASDAQ volatility has been much higher than BTC or ETH, post-LUNA. That’s hard to explain.
I will continue to obsess over the relationship between NASDAQ and BTC because I do not necessarily think it’s permanent and if they decouple, I think that will have implications for both NASDAQ and BTC. And maybe even for markets in general.
As a rule, super high correlation (aka, corr) between assets is a feature of high-volatility, fear-driven markets. When things are calm, correlations are lower and individual assets can express idiosyncratic directional moves. This is a general truth but not an ironclad law of global markets. The reason corr tends to go up during periods of fear is that every asset is made up of a systemic risk/liquidity component and an idiosyncratic component. As systemic risk rises, the idiosyncratic factor is crowded out and the systemic/fear component dominates. In a risk aversion regime, fear (and relief from fear) crowds out the idiosyncratic drivers of each asset class and pushes cross-asset corr towards 1.
Nobody cares about bitcoin adoption and network growth, or Solana transaction speeds, or the promise of GameFi when the Fed is ripping financial conditions tighter.
Imagine a music festival with four separate stages, the song being played on each stage will lead to idiosyncratic styles and speeds of dancing. People watching Kendrick Lamar will dance and walk around in styles and patterns that are totally independent from the movements of people watching the trance DJ, or the pop singer, or the deep house DJ on the side stages (that is: the movement of people watching each stage is idiosyncratic and uncorrelated).
If there’s light rain, you will see some people from each stage area head for cover (some correlation, but still low correlation of people movement as some portion of spectators at each stage heads for the tent).
But if there’s a massive lightning storm (i.e., risk event), all the people at all four stages will run for cover, regardless of the style of music being performed on each stage (high correlation of people movement, most of the crowd rushing for cover).
During periods of calm and optimism, asset classes dance independently. During periods of fear, all asset classes move as one. That is: fear drives cross-market correlation higher. There are various names for this such as “risk on/risk off (aka RORO)”, “The Blob” and so on.
Looking specifically at the recent NASDAQ vs. bitcoin comovement, the mechanisms driving it are as follows:
1. Higher US rates make long duration, low cashflow assets less attractive. Bitcoin and NASDAQ are both long-duration, low cashflow assets. So, rates up = sell both. Rates stable or down = cover shorts.
2. Fear and risk management make people cut their positions. When a hedge fund PM is losing money in equities, he sells his bitcoin to staunch the bleeding. When a retail trader is getting smoked in her crypto account, she sells her QQQ to reduce the pain. Since the Venn intersection of QQQ and BTC holders is significant in both the retail and institutional worlds, the behavior of one asset can trigger flows in the other.
3. Algorithms trade the correlation. As corr rises, there is reflexivity because algos detect correlation and trade it, thereby exacerbating the correlation. Until a new regime emerges, this feedback loop will push corr higher and higher.
For more on crypto vs. macro correlation, please see MTC #17: Who’s driving the bus? And if you really want to understand the philosophical underpinning of why bitcoin has become another Wall Street flow product, you need to read Ben Hunt’s classic: In Praise of Bitcoin. That essay is one of the best pieces of financial writing of all time. Great prose and a prescient view.
For now, no new call to action here. Correlation remains high between crypto and NASDAQ, while crypto beta has been low. Just something to monitor.
Revolving doors
As the twin systemic risks posed by Fed tightening and the collapse of LUNA dominate the recent discourse, the altcoin revolving door keeps on spinning. In “MTC #7: These Charts All Look Like Mountains,” I showed how bitcoin has always been the dominant cryptocurrency, while various alt- stable- and shit-coins rotate in and out depending on the hype cycle. The piece was written around six months ago and with the disappearance of LUNA, I thought this is a good time to provide an update. Here are the Top 15 cryptocurrencies, by market cap, back to 2013. The chart reads chronologically, right to left. LUNA and UST go poof while DOGE and BUSD gain the most in the rankings.
Top 15 cryptocurrencies, by market cap (2013 to now)
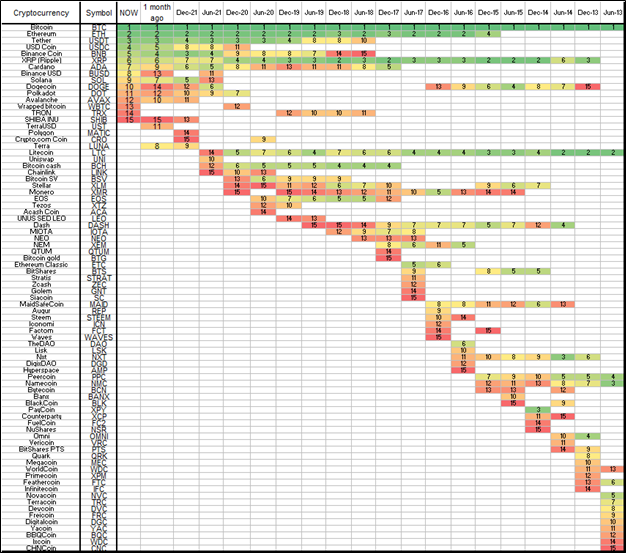
Tracy Alloway featured this chart in a recent story on altcoins and LUNA which you can read here. The takeaway on altcoins continues to be this: Every altcoin, regardless of its true promise, has an amazing hype, narrative, and origin story when it’s running higher. Every coin has a marketing department, religious adherents, and a cool story. But very few remain relevant once the primary hype cycle wanes.
Bitcoin, Ripple, Doge, and Litecoin are the only cryptocurrencies that were in the top 15 by market cap in both 2015 and now. Coins cycle in and out. That’s why all the altcoin charts look like mountains. Altcoins are lotto tickets that only pay off if you take profit before they collapse.
Fablecoins
While stablecoins are mostly relatively stable, it feels more and more disingenuous to call them stablecoins as that is a clearly a deceptive term that may or may not be true and certainly does not apply across the board. Fablecoins is equally inaccurate, in the opposite direction, but slightly funnier-sounding. An accurate term would be something like Wannapegs. Or Probablystablecoins. Perhaps the best term is just “stable”coins. It acknowledges their possible instability without creating too much confusion as to what we’re talking about.
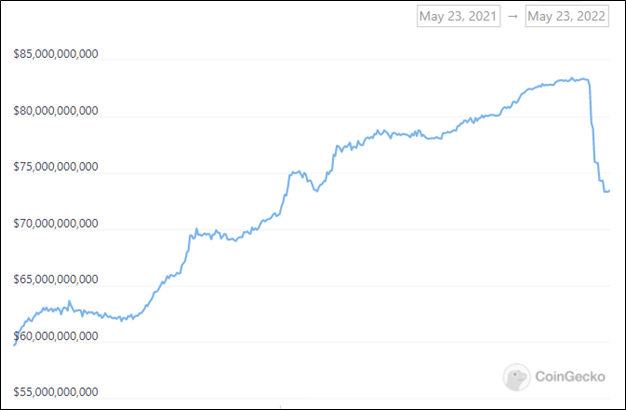
Fiat US dollars are leaving Tether (USDT) and heading for USDC as ongoing questions over Tether’s backing move to the forefront again after LUNA’s implosion. The comparison between an algorithmic stablecoin (UST w/ LUNA) is not really all that relevant to an asset-backed “stable”coin like USDT, but LUNA has just been a handy reminder that the world “stable”coin is a misnomer and deceptive marketing trick that overstates the stability of these coins.
Tether market cap
In my opinion, there is close to zero probability that Tether is fully backed 1:1 with liquid assets. Then again, they could be 92% backed. Or 61% backed. It’s impossible to say. There is almost certainly some odiferous commercial paper from Chinese and possibly US crypto exchanges on Tether’s balance sheet and that paper trades well below its $100 face value. If you heard the George Noble questioning of Tether’s CTO last week and you are familiar with the questioning of Enron’s Jeff Skilling in April 2001 (where he called the analyst an asshole on the conference call, lol)… It’s hard not to see the similarities.
The funny thing with Tether, though, is that if they have $65B of assets backing $80B of liabilities… And they get $10B of redemptions… They can satisfy those redemptions and then say: “See you guys are losers and truthers.” FUD FUD FUD.
Despite Tether’s attestations, nobody knows the real asset: liability ratio because Tether won’t reveal specifics of their holdings. And even if they did, their history of lying would preclude many from believing those specifics anyway. So Tether will remain a known unknown forever unless one day, redemptions break the threshold of liquid assets on hand. Even then, exposed exchanges might come in and bail it out so we might never know just how naked Tether is swimming. They might be wearing a Speedo and Crocs. Or they might just be wearing socks.
We will probably never know because as long as they can keep redemptions from forcing them to liquidate their worst assets, they’ll be fine. Still, I don’t get why anyone would hold USDT at this point given the myriad of better options.
If you’re buying a thing that can’t go up, you don’t want a lot of risk that it might go down!
My readings about Tether took me deep into the stablecoin rabbit hole. I was going to write a full piece about it, but decided it would be too boring. So instead, here are the most interesting takeaways:
· USDC looks like a much safer stablecoin alternative to Tether. It’s got some professional accounting and transparency and appears to hold mostly liquid assets. I can’t see any reason why any rational human being would hold a single USDT, ever. Here is Circle’s S-4, if you’re really bored.
· Tether’s par value should be more like 0.999, not 1.00 because of transaction fees. If you want to convert your USDT to USD, you pay a 0.1% fee plus some KYC aggro.
· DAI, the algorithmic stablecoin backed by ETH and USDC looks reasonable (not investment advice) with the exception of the fact that a catastrophic meltdown in ETH would probably lead to a peg break. If you are long DAI, you are short a very far out-of-the-money ETH put. The triggering of that put would depend on the speed and size of an ETH crash because the automatic liquidation features of DeFi will work in most environments but not necessarily in ALL environments. I asked a few people I would consider experts on this and not everyone agrees on how an ETH collapse would impact DAI. The fact that it’s not clear is pretty much all I need to know. An algorithmic peg relies on arbitrage via unlimited convertibility, and I can’t see the arbitrage here being unlimited in an ETH flash crash event. It’s possible I am wrong.
· In general, the high yields on stablecoins and in DeFi make more and more sense to me, the more I learn about DeFi. Whatever stablecoin you hold, there is some credit risk, hack risk, regulatory risk, peg break risk, flash crash in crypto leads to cascading series of liquidations risk, and so on. There is no clear read on how much leverage exists in the crypto ecosystem. There are many reassurances of overcollateralization, but my guess is that the overcollateralization is almost perfectly offset by collateral liquidation / flash crash risk and by rehypothecation. We don’t know how the leveraged DeFi system will behave in a crash. March 2020 doesn’t count because DeFi TVL didn’t explode higher until 2021.
· When you stake stablecoins to earn yield, you are lending capital to help the crypto ecosystem so it can add leverage. You are sending your ball into an extremely well-designed Rube Goldberg machine and you will probably get your ball back at the end. But you might not! The risks are hard to measure, and you are being rewarded for those hard-to-measure risks. This is probably good in a bull market, and probably less good in a bear market.
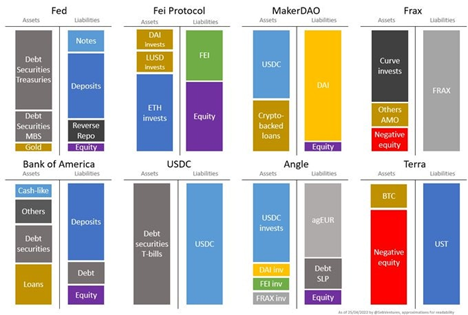
This chart from Twitter is cool. I cannot vouch 100% for its accuracy but it looks pretty good from what I do know.
Balance sheet comparison
One last comment on DeFi
Most MTC readers are under 40 years old and are thus unlikely to be too familiar with the causes of the stock market Crash of 1987. According to many inquiries and reports, one important cause of that one-day 25% stock market crash, was portfolio insurance.
Portfolio insurance was a hedging strategy introduced in the 1980s. It was developed to limit an investor’s losses from declining stocks without the investor having to sell the stocks themselves. Portfolio insurance used automated computer programs to sell futures to offset losses in stock portfolios as the market dropped.
Algorithms that send market orders in the same direction as a rapid market move tend to create the occasional waterfall/cascade event.
The flash crash in GBPUSD in 2016 was also driven, to a certain extent, by stop loss algorithms that were set to liquidate at market prices regardless of how much markets had already moved. I met a few times with the Bank of England after the GBPUSD flash crash and one of the big takeaways was that algorithms and manual button pushing that did not first check for “how much has the market moved?” created panic and crashy price action. It’s kind of an obvious point, really, but it’s not always obvious what the fix is. If you need to liquidate, you need to liquidate, so any sort of speedbump you put into your algorithm might just leave you holding the bag while others liquidate.
In FX, the fix was that banks and hedge funds mostly changed the programming of their stop loss algorithms to avoid “sell at market no matter what” types of instructions. This gave them principal risk, but was better for the market overall and thus better for individual participants in the long run (even if it sometimes forced participants to warehouse more unwanted risk). A centralized solution was agreed by all the major market makers and there have been no flash crashes since.
My understanding of many of the automated liquidation features of various DeFi products is that when the loan amount exceeds collateral, the collateral is automatically liquidated. Most of the collateral is ETH. Given there is no centralization, it’s every algorithm for itself. He who liquidates fastest, liquidates best. As such, a crazy waterfall liquidation in DeFi that takes ETH down at a speed that would thus far be unimaginable should at least be on your bingo card when evaluating risk of ruin.
TL;DR: Flash crash risk in ETH is not zero.
Update on a bunch of crypto assets
Everyone knows bitcoin is 58% off the highs and total crypto market cap is 61% off the highs. But we don’t hear as much about the other stuff. Let’s mark a few crypto products to market, just out of curiosity.
Drawdown from peak of some crypto assets and securities
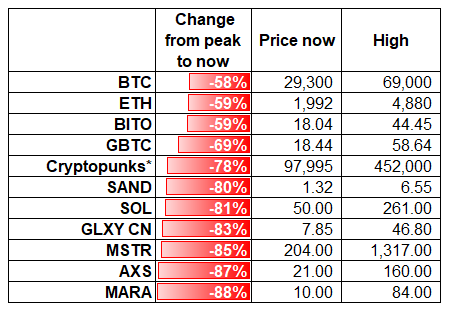
*floor price
Every bitcoin proxy performed worse than the real thing. Mostly this is because most of the products in that table are more volatile than bitcoin. Number go up faster and number go down faster. But you can’t make that excuse with BITO or GBTC. They’re just worse-performing products since the highs. And the performance data ignores the yield you could have earned on the BTC, which you cannot earn on BITO and GBTC. At least with GBTC you have that lotto ticket chance of spot convergence, I guess.
Crypto equities are highly-levered bitcoin proxies with potential negative asymmetries and negative convexity that is hard to quantify.
Conclusions
1. Crypto has been quiet relative to NASDAQ.
2. It makes no sense to hold Tether when there are safer alternatives.
3. DeFi yields come with a variety of risks that are hard to quantify and probably worth it in bull markets but less obviously worth it in bear markets.
4. Bitcoin proxies are more volatile than bitcoin and that hurts you in a bear market. It may or may not help you in the next bull market.
That’s it for today. Thanks for reading! If you enjoyed this episode of MTC, please forward to a friend. It will make both of us happy (especially me).
Reminder: MTC goes paid, effective June 1
To sign up click here, and choose “Crypto – Yearly”
And if you want to grab am/FX, my daily macro note, please click here.