
One of the most amazing features of bitcoin’s rise has been its resilience to broken narratives. The first bitcoin narrative came from the first line of the abstract of the original Satoshi Nakomoto whitepaper:
A purely peer-to-peer version of electronic cash would allow online payments to be sent directly from one party to another without going through a financial institution.
Instead, bitcoin has emerged as not something to spend, but something to HODL. Not something that avoids financial institutions, but instead a massive new source of flow and revenue that mostly will end up going through them. Just like the corporate world co-opted punk rock, skateboarding and EDM[1]… Corporate America is now all about the Bitcoins!™.
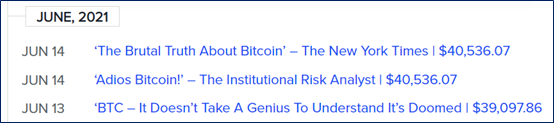
Crypto has triggered a near-complete intellectual capitulation from the TradFi world with only a few bitter melons and rogue academics still clinging to the belief that “bitcoin is a ponzi/tulip/zero.” Hundreds of loud public bitcoin obituaries later, BTC soldiers on, stronger than ever. Here are 3 of the 389 bitcoin obits preserved for posterity by www.99bitcoins.com.
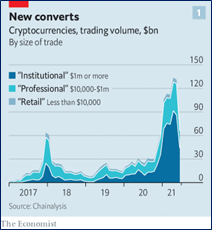
The 2021 intellectual capitulation triggered by the Fed’s March 2020 GigantiQE is captured nicely by The Economist (see chart at right). Thing is, the chart massively understates the amount of money institutional pros are allocating to crypto. There are so many projects in production right now, awaiting mandate, funding, custody, legal, docs, and admin. For every dollar already involved, there are five dollars on the sidelines champing at the bit to get going[2].
As bitcoin transitions from a decentralized retail product to an institutional asset class traded mostly on centralized exchanges, I would think the microstructure would change. My guess would be you end up with better liquidity, fewer crashes, less volatility, fewer arbitrages, and generally less weirdness and more efficiency. While we are less than 12 months into the Great Wall Street “Into Crypto and Out of Gold” Rush, we have enough data to at least poke around. I hope you learn a few things from this investigation. I know I did!
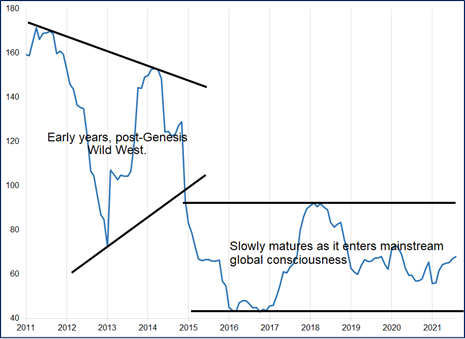
For this piece, I use bitcoin OHLC data back to 2015. Before 2015, bitcoin was the Wild West, volatility was much higher, liquidity was much worse and in general I would say microstructure was substantially different than the post-2015 period. You can see the regime shift in this chart:
Bitcoin 360-day rolling volatility, 2011 to now
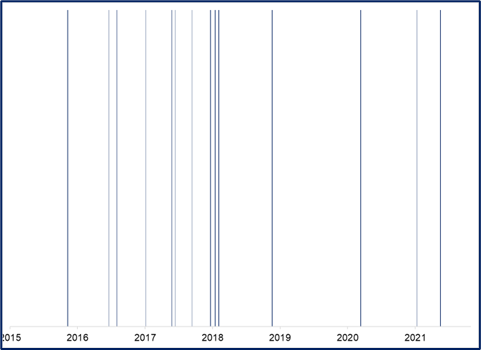
The first question I would like to answer: Is bitcoin experiencing less downside volatility than normal in 2021, given the permabid from Wall Street, corporate treasuries, and other high net worth players? To answer this, I first did a simple scan of the data to see how often bitcoin crashes. I defined crash as “down 25% or more in one day” or “down 50% or more in three days”.
This simple chart shows all bitcoin price crashes since 2015:
Bitcoin price crashes 2015 to now (vertical line = crash)
This would make a cool tattoo
Here is a table showing the same BTC data, plus ETH.
Number of crashes, by year

While bitcoin is less crash-prone than it was before the Crypto Winter, my feeling is that this is probably the result of a more mature market, and better market making and stop loss algorithms… And less a specific result of more institutional buyers lining up to play. ETH is less liquid, more volatile and more crash-prone as you might suspect.
Badly-designed stop loss algorithms aggress any price in the market, and can produce flash crashes. This is not just the case in crypto. We have seen it in GBPUSD and stocks too. These algorithms lose a ton of money, attract regulator and exchange attention, infuriate and alienate customers, and generally get selected out of existence. Much as you don’t see as many flash crashes in FX because the bad algos have been weeded out, you are going to see fewer crashes in developed crypto markets like bitcoin because the stop loss and execution algorithms adapt and get smarter over time. Or the firms that run them shut down.
Frequency of crashes
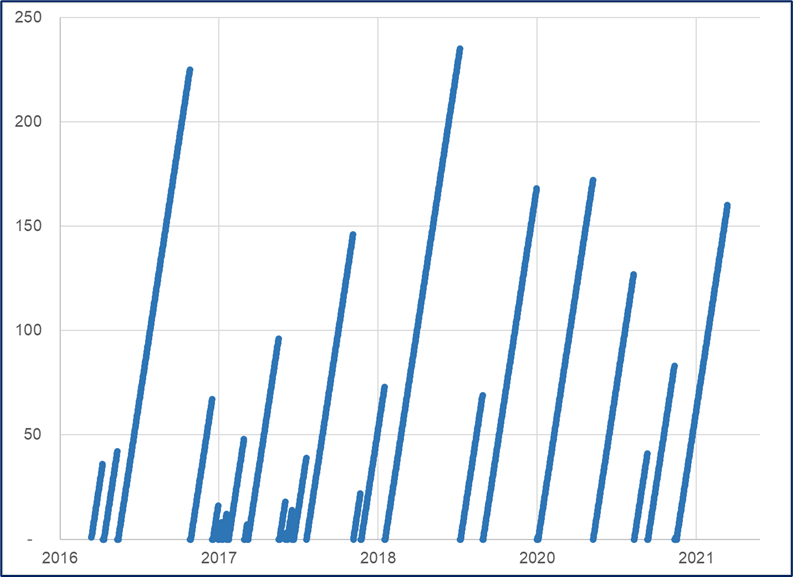
Another way to slice and dice that same data is to ask: “How long has it been since the last crash?” if that window is getting wider and wider, that means liquidity is probably improving and the buy-the-dippers are creating a stronger ecosystem and less fragile microstructure.
How many days has it been since the last bitcoin price crash?
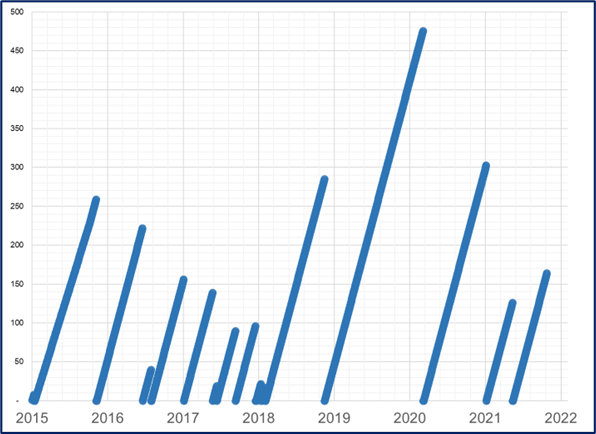
Which reminds of those construction and work site signs.

Anyway…
1. Bitcoin was more and more crash prone until the first wave bubble climax and 85% drawdown in 2018. There were frequent crashes throughout 2016 and 2017, culminating with the ultimate collapse of bitcoin and the Crypto Winter. This relieved the crashing frequency problem somewhat. There have been four bitcoin price crashes since then:
a. November 2018 after Powell’s “long way from neutral” comment crushed global liquidity.
b. March 2020 COVID.
c. January 2021 (no reason).
d. Weekend dump on random Elon Musk tweets post-SNL.
2. Two crashes in 2021 is circumstantial evidence that institutional liquidity has not hardened bitcoin’s underlying microstructure. There were zero crashes in 2019 and just one in a much more volatile 2020.
Another way to look at this is to build a histogram of bitcoin returns for 2021 and compare that to prior years. Like this.
Histogram of BTC daily returns for 2021 and 2015 to 2020
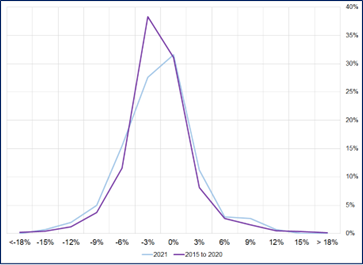
The 2021 histogram is a bit flatter than the other one, which shows volatile days were more common in 2021, and quiet days less so. But no major evidence of a substantial change either way. Another way to look at volatility is to just plot it straight up like this:
3-day moves in bitcoin, 2015 to now
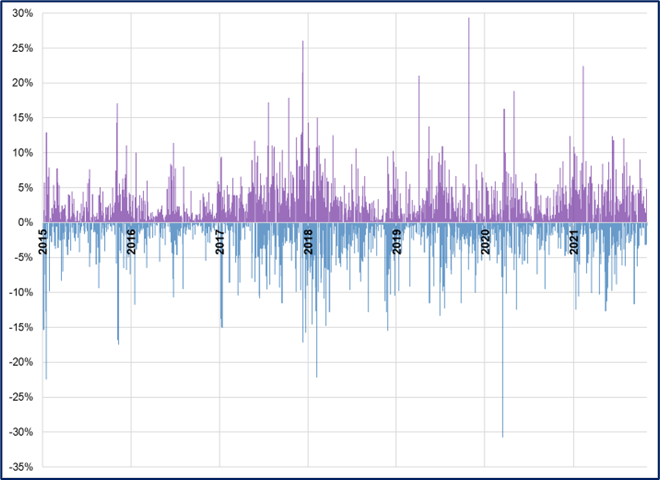
That chart is visually appealing but doesn’t reveal much other than the (known) idea that volatility appears in clusters. Most asset price movement is characterized by shocks, followed by aftershocks, followed by calm and temporary quasi-equilibrium. And then another shock.
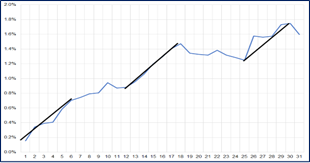
As I stared at that last chart above, I noticed it seemed like a lot of the action was clustered right around the turn of the year. But I thought that might be my imagination, so I took a look. This chart shows the seasonality of bitcoin since 2015.
Seasonality (average path) of bitcoin, 2015 to 2021
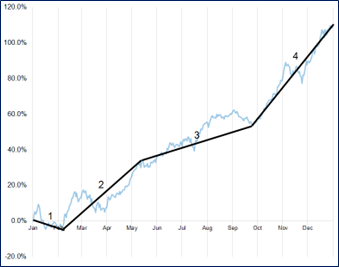
We see four main phases of the year.
1. Uncertain January
2. Rally until May
3. Grind sideways or small higher until October
4. Uptober and strong close to the year.
Much like the stock market, bitcoin followed the standard seasonality pretty closely in 2021, in terms of both direction and magnitude. It’s interesting and informative that bitcoin follows roughly the same seasonal pattern as the stock market. Why would that be?
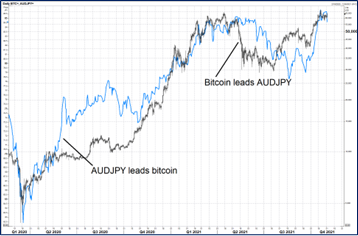
Bitcoin often trades like a risky asset responding to ebbs and flows in global liquidity and confidence. The way it tracks so tightly with a risky currency pair like AUDJPY is evidence of bitcoin as a global liquidity proxy. Here is the overlay:
Bitcoin vs. AUDJPY (daily since the Fed announced GigantiQE, March 2020)
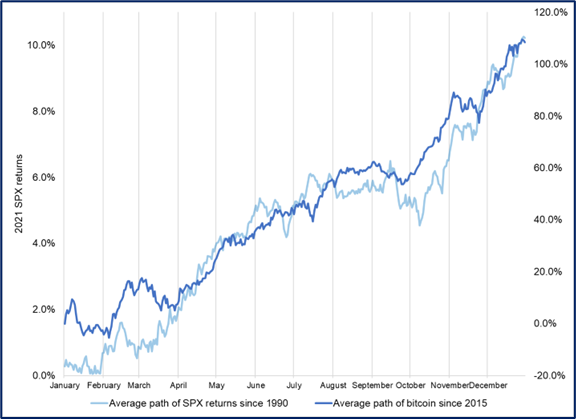
Here’s the bitcoin seasonal pattern I showed above, with S&P 500 seasonality on top.
Bitcoin and stocks follow the same seasonal pattern
Another way to compare bitcoin and S&P seasonality is to slice average returns into monthly chunks. You can see how most good months for stonks are good months for bitcoin. And vice versa. This probably adds weight to two ideas I believe are probably true:
1. Calendar seasonality in stocks is not random. It is more likely a function of human moods and behavior, liquidity patterns, and perhaps some other unseen forces. It has mostly worked out of sample for 40 years and can be spotted in 300 years of data.
2. Bitcoin is a risky asset driven by many of the same sentiment and liquidity forces as stocks.
Average monthly return for BTC and SPX
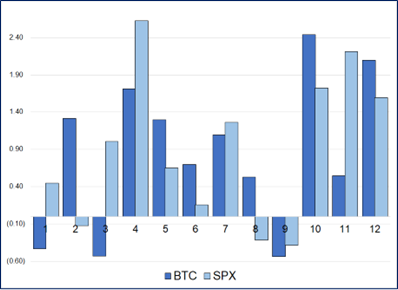
BTC uses data 2015 to now. SPX uses 1990 to now
Even if you drill down one fractal further, you see that bitcoin and stocks both have the same intra-month seasonality pattern too.
BTC: avg. cumulative return by day of month
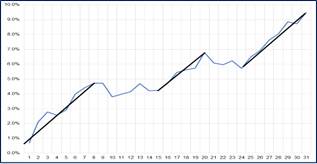
SPX: same deal
This pattern most likely relates to the way cashflows enter the system. Most US workers get paid on the 1st and 15th of the month and then take a few days to deploy leftover cash into risky assets. Automatic retirement savings contributions also enter the system in the first week of the month and contribute to stock market outperformance. I am not really sure why the last week of the month is also strong, if you have an explanation for that please let me know.
There is no immediate trade idea or call to action here. I hope this piece was useful in helping you understand bitcoin microstructure and price behaviors. Understanding microstructure, correlation and seasonality can help your timing and your tactics, and should also help you better understand why prices are on the move.
Here are the final takeaways:
Conclusions
1. Bitcoin was much more crash-prone before the Crypto Winter. The arrival of the fully vested Wall Street crew has not led to a major reduction in downside volatility.
2. ETH remains more crash prone than BTC because it’s more volatile.
3. Bitcoin trades very much in line with calendar effects we see in the stock market. It trades worst in Q1 and Q3, and best in Q2 and Q4. It rallies around the times Americans get paid, and flatlines in between.
4. Bitcoin is a risky asset with many unique properties. But it’s still a risky asset. Not a safe haven.
5. The latter part of the last Fed rate hike cycle coincided with the Crypto Winter, and poor returns for stocks. Keep that in mind if and when the Fed ever moves to restrictive monetary policy. If you see the spread between 3-month T-bills and US 10-year bond yields heading towards zero as it did in 2018, that is a sign that the Fed is finally really tightening policy. Watch out. Until then, party on.

Fully vested
APPENDIX: ETHEREUM
ETH is more crash-prone than bitcoin. This makes sense because ETH is more volatile.
Number of crashes, by year

Crash = down 25% in one day or 50% in three days
How many days has it been since the last ethereum price crash?
Brent Donnelly
[1] And most recently: The Metaverse!
[2] Links for grammar police: https://www.npr.org/sections/memmos/2016/06/09/605796769/chew-on-this-is-it-chomping-or-champing + https://kris-spisak.com/writing-tip-chomping-at-the-bit-or-champing-at-the-bit/