
MacroTactical Crypto #20
World Computer vs. Digital Gold

Choose your fighter
You can listen to this episode on the web, on Spotify or on Apple podcasts.
Today’s note is 2,500 words (10-minute read)
The World Computer vs. Digital Gold
Lately, I have been writing about my preference for BTC over ETH. Here is the reasoning in a nutshell:
· The BTC use case is increasingly clear. It is a liquid hedge against fiat debasement. This use case obviously works in both directions and as the Fed tightens, you would expect BTC to fall. My view is that it will outperform other risky assets from here as underlying demand for what is still a fairly new asset class will be strong and if you wait until the next Fed easing cycle to buy BTC, you’re going to be paying $50,000. Better to scale in on the way down than to chase it back up, in other words.
· The ETH use case is somewhat clear (World Computer), but it has many competitors. The promises of DeFi, Web3, and GameFi are going to be much harder to keep given the complexity of the use cases and the massive level of fraud and grift attached to all these projects. Not to mention the distorted incentive structures (monetize first, build later).
· Crash risk in ETH due to auto-liquidation during times of downside crypto stress is not zero. A majority of DeFi collateral is ETH and the SBF Magic Box theory looks a bit more on point every day. MTC #19 has a full write-up on why I think ETH has more crash risk than BTC.
· As crypto users age and absorb the lessons of the serial crypto bubbles and bubblettes, they will become less risk-seeking. They are learning that absurd payouts are accompanied by grotesque levels of risk. They will buy fewer lottery tickets, farm less yield, and buy more insurance. ETH is levered to DeFi and altcoins. BTC is not.
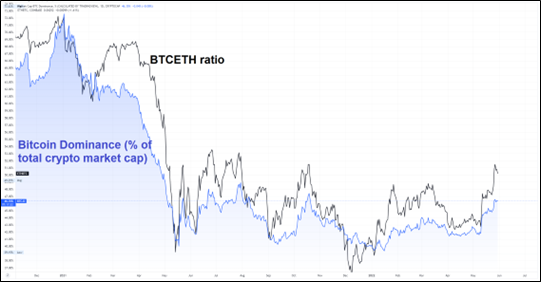
There are ways to trade bitcoin dominance on some exchanges via the Bitcoin Dominance Index, but BTC and ETH are such a large part of the crypto ecosystem, it’s not really necessary. Together BTC and ETH represent around 65% of crypto (ex-“stable”coins), while coin #3 in the rankings (BNB) is less than 1/10 of BTC’s market cap. So, bitcoin dominance is really just a function of the relationship between ETH and BTC. Here’s BTCETH vs. bitcoin dominance:
BTCETH vs. Bitcoin dominance (BTC’s % of total crypto market cap)
I like short ETHBTC looking for a move back to the 0.33 area. I think this view could work in one of two ways. One, via a crash in ETH, or two, via a much stronger rebound in BTC.
I don’t think ETHBTC is as dependent on overall crypto direction as many people seem to think it is. Let me elaborate a bit. ETH is generally more volatile than BTC. For example, 3-month implied at-the-money (ATM) volatility on Deribit right now shows ETH around 78% and BTC around 65%. And if you look at the spread between ETH and BTC realized vol over the last few years, you can see anything close to zero is pretty much the floor. Here’s a chart:
ETH 90-day vol minus BTC 90-day vol
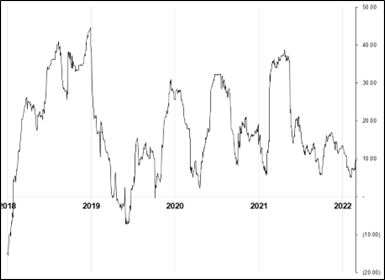
Positive number means ETH vol > BTC vol
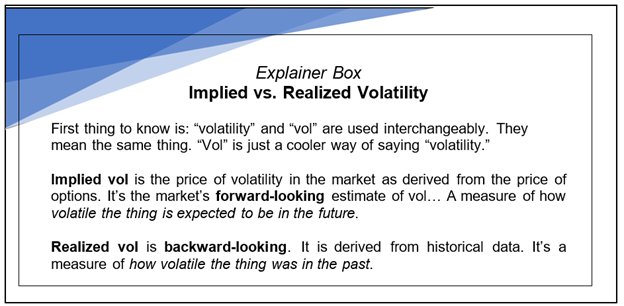
Sidenote: My goal with MacroTactical Crypto… and in life… is to keep iterating and slowly make things better and better via continuous improvement. In that spirit, and because some readers of this newsletter have >25 years of trading experience while others have <2… Today, I have added a feature called “Explainer Box” to MTC. This will be a box that explains a term or concept for people that are not expert in that thing. If you already know the concept, just skip the Explainer Box. Also, if you have ideas for other MTC features or improvements, please let me know!
Here is an Explainer Box that describes the difference between implied and realized volatility.
Sometimes when people talk about BTC dominance or ETHBTC, the assumption is that because ETH is more volatile than BTC, that means ETH outperforms in bull markets and underperforms in bear markets. Or that ETHBTC is an altcoin season kinda thing (alts happy = ETHBTC up). That’s logical, but it’s not really true all the time.
Here is a chart of ETHBTC and BTCUSD back to 2019.
ETHBTC vs. BTC since 2019
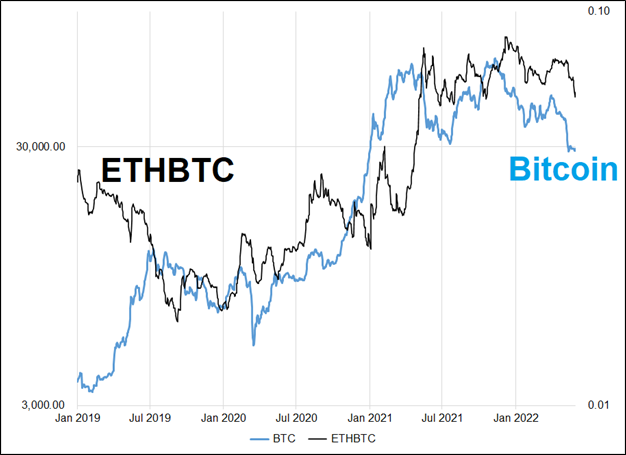
If ETH was just turbo bitcoin, then ETHBTC would go up when bitcoin goes up. But the relationship is not anywhere close to that dependable. You can see there are periods where bitcoin goes up and ETHBTC goes down, particularly the first half of 2019.
My point here is that I think it’s perfectly consistent to be bullish BTC and bearish ETHBTC at the same time. In January 2021, bitcoin was around 29000, and ETH was 800. ETH has been a massive outperformer for the past two years and I think that outperformance is done. And set to reverse.
I’ll keep you up to date on this trade. The parameters are: Short ETHBTC at 0.061 with a stop at 0.077 and a take profit at 0.033.
My trades tend to start with narrative, behavioral finance, and global macro thoughts, then use technicals and vol estimates further downstream in the process to narrow in on tactics. The chart of ETHBTC features a huge topside triangle break followed by a rejection and a downside triangle break. I put the stop loss above the broken triangle because if we go back up there, my idea is toast. Here’s the chart.
A messy ETHBTC chart breaks both sides of the triangle
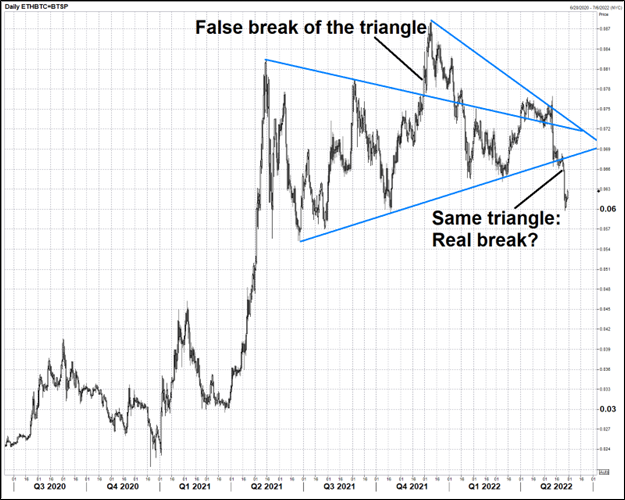
When the top of a triangle breaks like this, it often sucks in the last of the FOMO traders to the topside and forces the last of the shorts to stop out. If the break is subsequently rejected (i.e., price heads lower, back through the bottom of the triangle), the market is caught leaning hard the wrong way and progress to the downside is easier. This is similar to the concept of a Slingshot Reversal, which I explain here in my educational Substack.
I will always track the trade ideas mentioned in here and let you know when I’ve stopped out or taken profit. None of this is investment advice; my goal is to give you ideas and viewpoints that you can incorporate into your process. Don’t copy my ideas. Build your own framework and include the parts of my work that you think make sense… Throw out the parts that don’t resonate with you.
Now, let’s talk MSTR.
Topside convexity? What do you mean topside convexity?
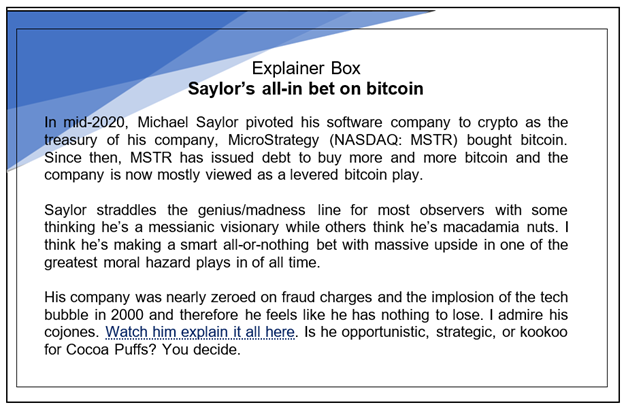
When MSTR falls, bears and Elmer FUDs get riled up about the Saylor Line, or margin calls at $21,000 or the idea of a Microstrategy board revolt that will force the treasury to sell grillions of bitcoin into a collapsing market. There are some nuggets of truth in the FUD pile but there is a weird and interesting reality that is kind of the opposite story.
Convexity of MSTR to bitcoin is greater when bitcoin rallies than when it dumps. In other words, if bitcoin has a huge move up, the MSTR rally is larger than the MSTR sell off when bitcoin has a huge move down.
Here’s a table:
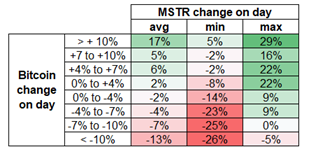
1-day changes in bitcoin (bucketed) vs. same day average change in MSTR
And here’s a chart:
1-day change in bitcoin (bucketed) vs. avg. 1-day change in MSTR on those days
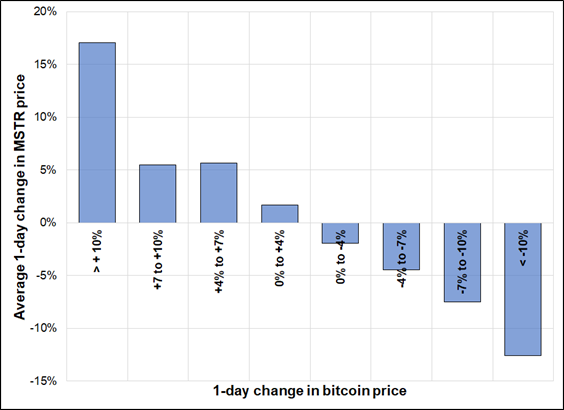
The main takeaway here is that a bitcoin rally of 10% or more sees MSTR up 17% on average while a bitcoin drop of 10% or more leads to a drop of 13% in MSTR, on average. I think that’s kind of interesting since it goes against the dominant narrative of downside convexity in MSTR. There are two possible reasons that I can think of for this topside skew:
1. MSTR short interest is 37% of the float. The squeezes are not fun for shorts.
2. The sample size of large bitcoin moves (10% or more in one day) is only 14. Therefore, this result could just be a sample size issue. If you look at bitcoin moves +/-7% (a much larger sample), the convexity disappears and the MSTR reaction is symmetrical.
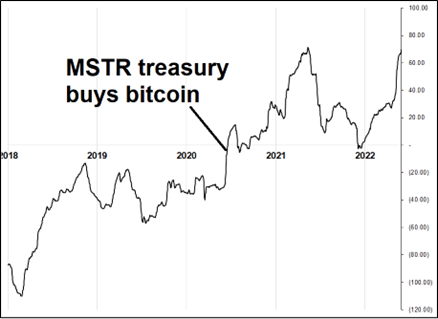
Either way, MSTR remains a pretty good high-vol bitcoin proxy. If you look at MSTR volatility vs. bitcoin, it’s pretty easy to see the day when Saylor started buying bitcoin. MSTR was lower vol than BTC before that and has always been higher vol since. Again, similar to ETH vs. BTC… Zigs toward the zero bound quickly become zags back up.
MSTR 90-day realized vol minus bitcoin 90-day realized vol
FWIW, there is no skew for puts in the MSTR options market
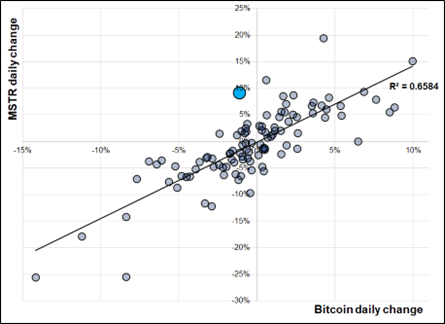
And here’s MSTR daily returns vs. BTC in 2022. I marked last Thursday’s {BTC down 1% vs. MSTR up 9%} day in blue, just because it’s weird.
MSTR daily change vs. bitcoin daily change (August 2020 to now)
The next chart shows the same thing, but BTC vs. NASDAQ. The red dot is Friday’s big decouple. Again, weird.
NASDAQ daily change vs. bitcoin daily change (for 2022)
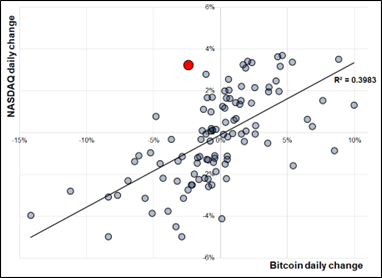
I put linear trendlines on these, but the relationship is not totally linear
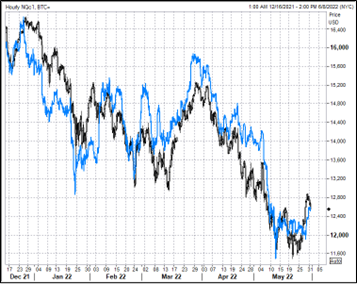
People are freaking about that price action last week, but I don’t place a ton of weight on a brief decouple between two highly-correlated assets. Very often, there’s simply a flow in one market and not in the other on that particular day and the underlying relationship hasn’t really changed.
Some dude comes in and buys a shedload of NASDAQ futures as part of a giant rebalancing while some other person across the street is unwinding her crypto fund because of LUNA losses and you get that kind of day. It happens all the time and it doesn’t have any forecasting value. Here’s the overlay:
NASDAQ vs. bitcoin hourly (late 2021 to now)
It is important to monitor this going forward of course, because the crypto chameleon keeps changing its story and if you want to trade it successfully, you need to know the color of the current narrative. It wasn’t always NASDAQ pushing BTC around. And it won’t always be NASDAQ pushing BTC around, either.
Final thoughts
The crypto haters are having a field day right now, just as the zealots had many field days in 2021. Mindless, pointless posting of the current level of spot bitcoin on Twitter continues as price travels in both directions.
I still believe (as I often do with many things) that the truth is somewhere in the middle. There is so much grift, fraud, rent-seeking, and generally horrible stuff going on in crypto that it’s easy for detractors to pile on, especially when prices are falling.
Thanks for reading. If you liked this note, I would like to ask a small favor. Please click this tweet and retweet it. You will receive positive karma. Thanks!
Brent Donnelly
Market and Trade Ideas Update
If the market and trade ideas update is interesting, I will put it at the start of MTC and if it’s kind of boring (like today)… I’ll put it at the end.
Not much to report in the past week of price action. My ETHBTC short (see MTC20) is small in the money as BTC hugs the 30k line and ETH grinds modestly lower. My bullish BTC view is tiny in the money (30300 entry) but I’m not white-knuckling that since it’s more of a swing trade / investment time frame. I want to scale into medium-term BTC longs from 30k down to 20k. This is outlined in MTC #11.
Don’t follow the crowd. Think for yourself. Stay Bayesian.
This is the last free edition of MacroTactical Crypto. Subscribe right here, today.
Subscribe to MTC and am/FX right here
Markets and Trading Commentary Disclaimer
This material has been provided by Spectra Markets, LLC (“Spectra Markets”). This material is confidential and therefore intended for your sole use. You may not reproduce, distribute, or transmit this material or any portion thereof to anyone without prior written permission from Spectra Markets.
This material is solely for informational and discussion purposes only. Spectra Markets is not a registered investment advisor or commodity trading advisor. This material should not be viewed as a current or past recommendation or an offer to sell or the solicitation to enter into a particular position or adopt a particular investment strategy. Spectra Markets does not provide, and has not provided, any investment advice or personal recommendation to you in relation to any transaction described in this material. Accordingly, Spectra Markets is under no obligation to, and shall not, determine the suitability for you of any transaction described in this material.
To be clear: Your individual circumstances have not been assessed. You must determine, on your own behalf or through independent professional advice, the merits, terms, conditions, risks, and consequences of any transactions described in this material. Securities described in this material may not be eligible for sale in all jurisdictions or to certain categories of investors. This material may also contain information regarding derivatives and other complex financial products. Do not invest in such products unless you fully understand and are willing to assume the risks associated with such products. Neither Spectra Markets nor any of its directors, officers, employees, representatives, or agents, accept any liability whatsoever for any direct, indirect, or consequential losses (in contract, tort or otherwise) arising from the use of this material or reliance on information contained herein, to the fullest extent allowed by law.
The opinions expressed in this material represent the current, good faith views of the author at the time of publication. Any information contained in this material is not and should not be regarded as investment research or derivatives research as determined by the U.S. Securities and Exchange Commission (“SEC”), the U.S. Commodity Futures Trading Commission (“CFTC”), the Financial Industry Regulatory Authority (“FINRA”), the National Futures Association (“NFA”) or any other relevant regulatory body. The author is currently employed at a trading desk. The opinions may not be objective or independent of the interests of the author. Additionally, the author may have consulted with various trading desks while preparing this material and a trading desk may have accumulated positions in the financial instruments or related derivatives products that are the subject of this material.
Spectra Markets does not guarantee the accuracy, adequacy or completeness of the information presented in this material. Past performance and simulation data do not necessarily indicate future performance. Predictions, opinions, and other information contained in this material are subject to change continually and without notice of any kind and may no longer be true after the date indicated. Any forward-looking statements speak only as of the date they are made, and Spectra Markets assumes no duty to and does not undertake to update forward-looking statements. Forward-looking statements are subject to numerous assumptions, risks, and uncertainties, which change over time. Actual results could differ materially from those anticipated in forward-looking statements. The value of any investment may also fluctuate as a result of market changes.
Spectra Markets is affiliated with Spectra FX Solutions LLC, an introducing broker that is registered with the NFA; Spectra FX Solutions LLP, which is a registered entity with the U.K.’s Financial Conduct Authority; and SpectrAxe, LLC, a swap execution facility that is currently in the process of registering with the CFTC. The disclosures for Spectra FX Solutions LLC and Spectra FX Solutions LLP related to the separate businesses of Spectra FX can be found at http://www.spectrafx.com/.