


ADHD Rabbit, Extra Chaos Edition
Current Views
Flat
EM
I have been thinking more about carry this week as that seems to be the only real theme for now as we await the probably-meaningless result of the China/US talks and perhaps the more-interesting CPI and US bond auctions. One of the most amazing aspects of FX carry in the past 15 years is that it’s returned just about exactly zero percent.
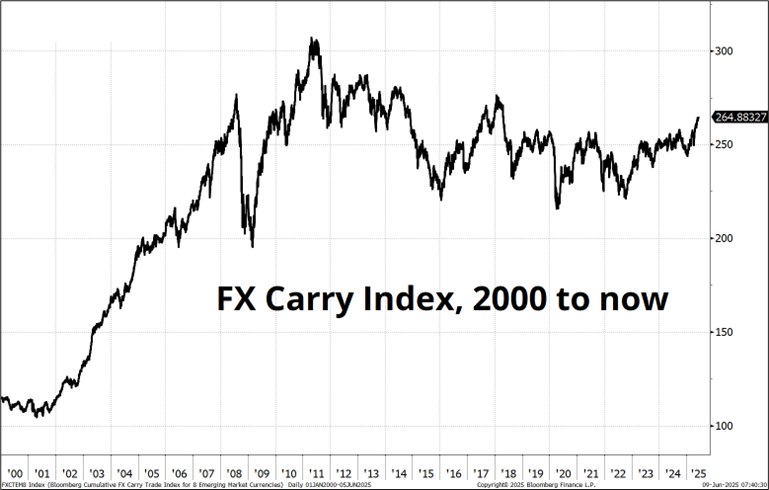
If you went long FX carry in 2010 and held until now, you’re flat. It seems weird that you have not been compensated for taking so much policy and emerging market political risk and so on, but anything that was not USA-centric was a pretty bad bet since the GFC as US megatech oligopolies gobbled up all the money throughout the 2010s. Post-COVID, US exceptionalism switched into an even higher gear due to AI; FX carry is also flat 2020 to now. FX carry is a bet on the BBDXY, and that index is up 30% since 2010 and thus the carry has pretty much perfectly offset USD appreciation. The much-touted Deutsche Bank FX Carry ETF that launched at $24 in late 2006 was demised at $25.41 in 2023. Craziness.
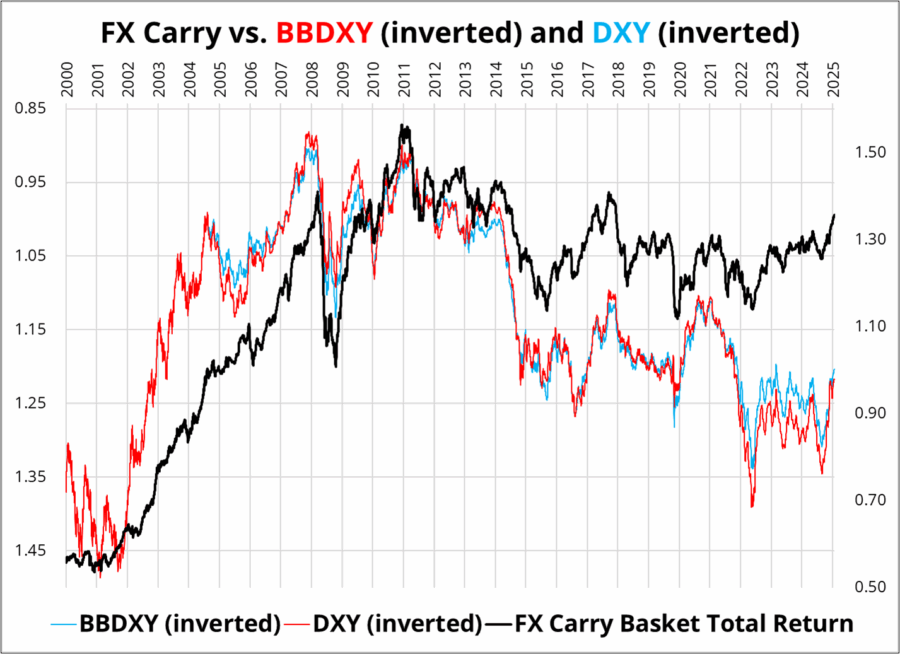
As you can see in the next chart, long FX carry is a bet on structural USD weakness. That is why it makes sense right now. You can see that all the money in carry was made 2000 to 2011 in the midst of a massive cyclical move lower in the USD, the entry of China into the WTO, the commodity supercycle, and so on.
Current 100-day returns in the carry index are +7.1% and I looked back to see if the returns are autocorrelated, or if you’re better off fading the moves after such a big rally. The post-2010 result was completely useless because returns have been flat for so long. Obviously, going long carry, even when it was already working well, was a great strategy 2000 to 2007, because carry was trending. Since then, it hasn’t mattered whether carry was doing well or poorly, buying it mostly yielded a zero return.
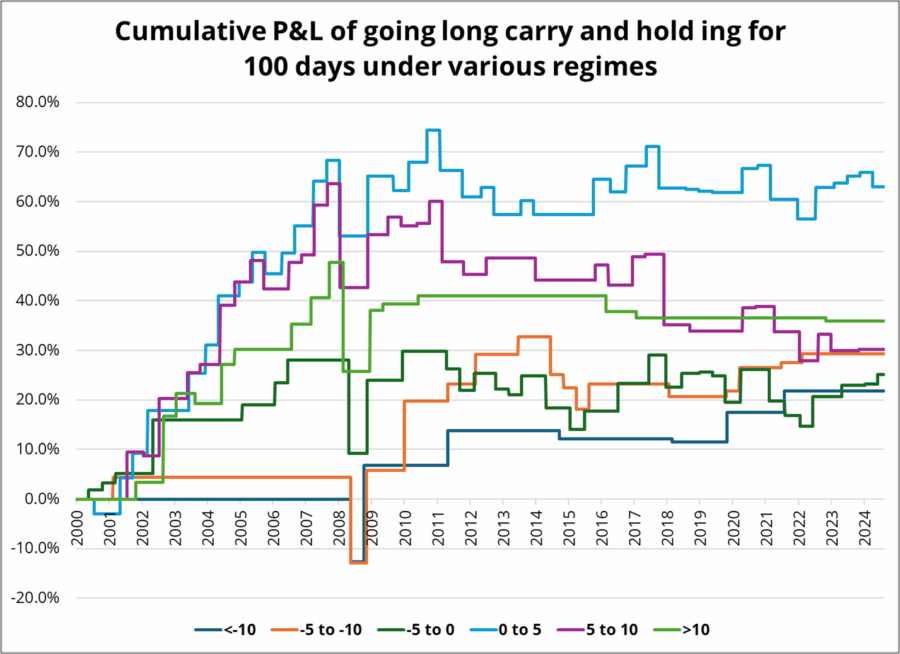
This chart shows the 100-day return of going long carry filtered for how carry has done in the past 100 days. In other words, look at current 100-day return, and then look at the next 100 days to see if the past 100 days and next 100 days are autocorrelated or inversely correlated or what. Here’s the (super ugly) chart.
The only takeaway here is that if we are in structural USD down move, you don’t need to worry too much about carry getting crowded. It stayed crowded for seven years the last time we had a structural USD decline.
Stocks
The major US indices are getting close to the all-time highs. Does this give the administration room to hit back hard at China again? This is the concept of the Trump Strangle… Where policy adjusts in real time based on the level of risky assets and the US 10-year yield. While this might not be an explicit strategy, the underlying psychology of chickening out when asset prices are in freefall and then regaining your mojo when they recover seems sound. Even if it’s subconscious, it makes sense. Let’s see.
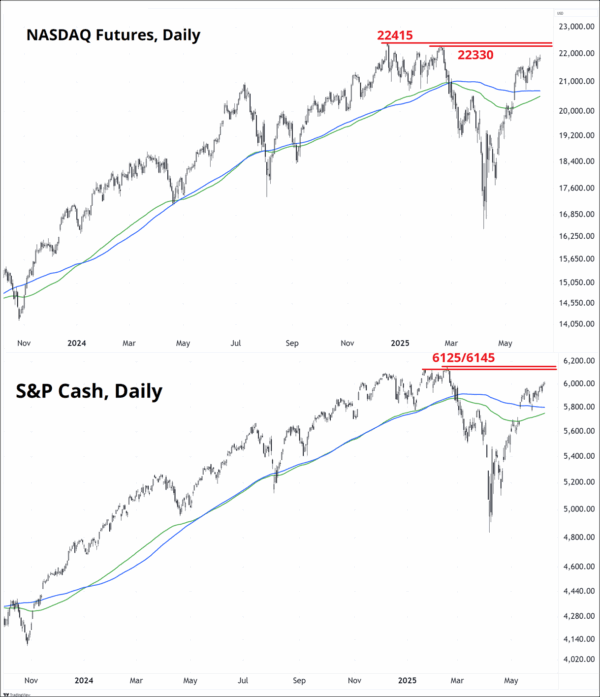
Some have made the point that even after the subprime story was well-known and stocks cratered in August 2007, they went on to eke out a new all-time high before the eventual 56% collapse. It’s a lot harder to make the economic apocalypse argument right now as the US data continues to hold in, but whatever happens, a marginal new ATH would definitely be soul-sucking for the bears. Ironically, it’s much harder to make a convincing bearish US stock market argument here at 6000 than it was 8 weeks ago at 4800.
I guess that’s always the way.
Final Thoughts
- https://www.reuters.com/business/media-telecom/openais-annualized-revenue-hits-10-billion-up-55-billion-december-2024-2025-06-09/
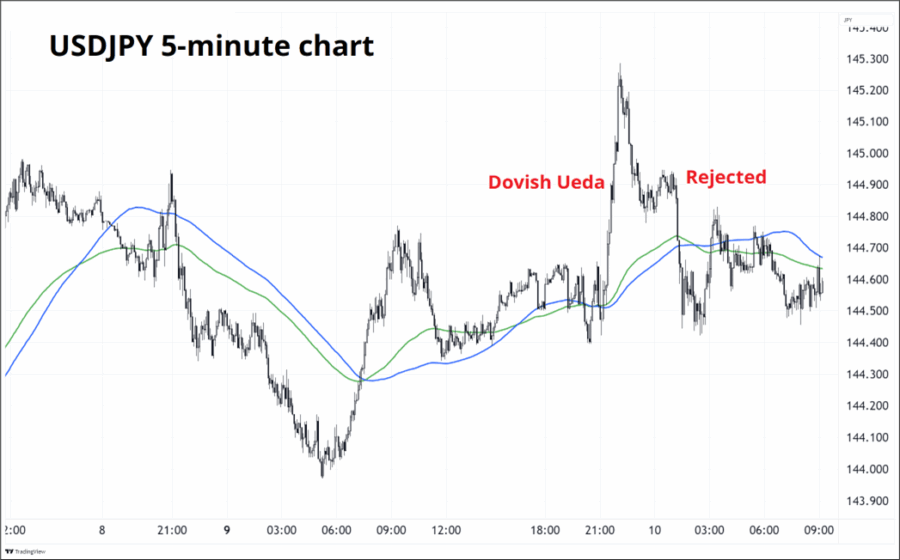
- Last night: BOJ’s Ueda Says Inflation Is Still Below Target but USDJPY rejects another move above 145.
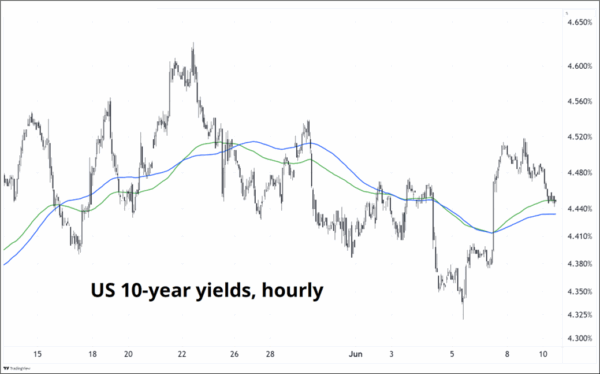
- As we scrabble around for a macro theme, some possible candidates include higher EURGBP after the weak UK jobs data today, higher US yields on triple auction and/or CPI, or lower US yields on triple auction and/or CPI.
US 10-year yields look like a random walk over the past month.
Have a historically profitable week.
The Spectra FX Positioning and Momentum Report
Still hesitating
Hi. Welcome to this week’s report. We have spent two months jiggling around 1.1300 in EURUSD and the market is logically hesitant to engage with structural USD shorts. The theta bills keep piling up. Today’s weak UK jobs data dents the GBP bulls, and the only theme we are seeing in our flows is interest in carry and a few dabblers in topside AUD, AUDJPY, GBPJPY, and GBPCHF (G10 carry). The UK has the highest yield and best carry/vol in G10 but the fundamentals there always hang on a knife’s edge as the economic and fiscal stories are perpetually one day away from potential bad news.
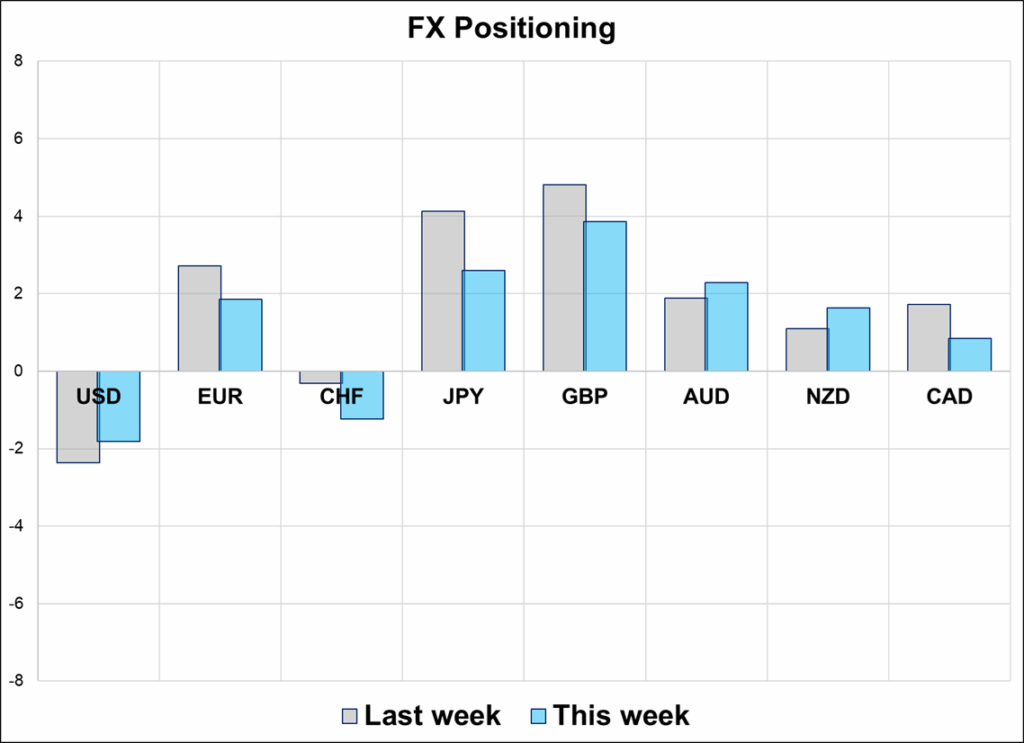
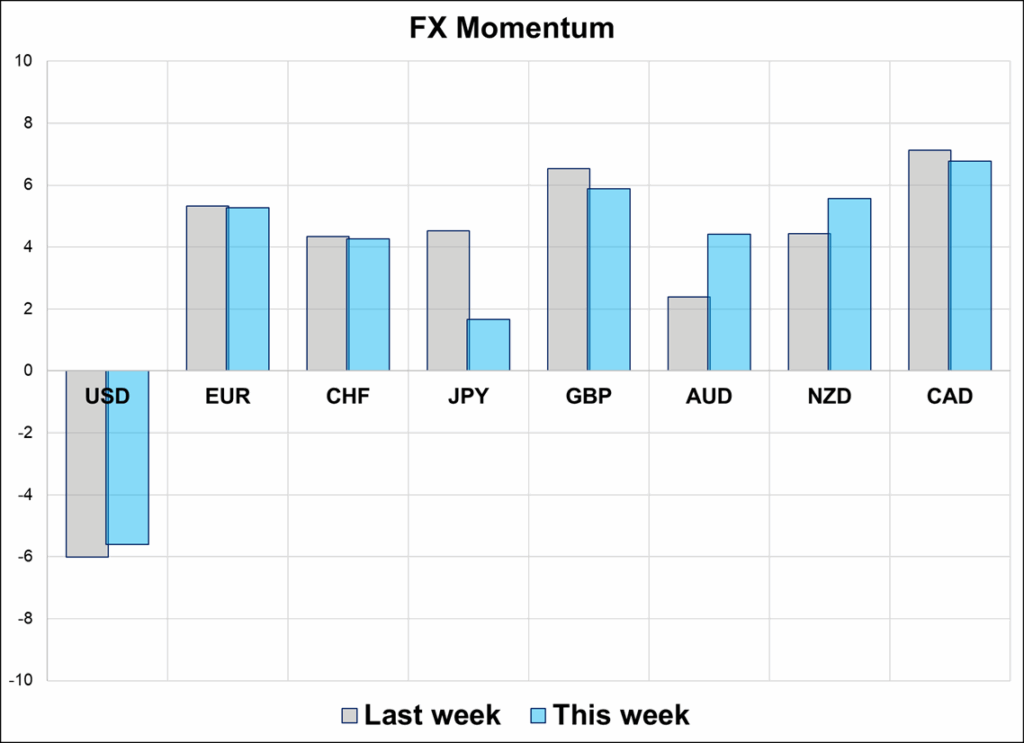
G10 FX Positioning and Momentum Scores

Plushie Dreadfuls ADHD Rabbit, Extra Chaos Edition
Definitely creative. Maybe in bad taste?
Or cute, harmless, comforting, and empathetic. I’m not sure.

Autism Spectrum Rabbit
HT GITTLES
