
ISM Employment, Claims, ADP, and everything else all say the same thing.


ISM Employment, Claims, ADP, and everything else all say the same thing.

Short CHFJPY 171.86
Stop loss 173.65
Take profit 163.56
As telegraphed by ISM Employment, ADP, and Claims… NFP delivers with near-recessionary data. 50bps is now very likely to be the size of the first cut, which will be delivered at the September FOMC meeting (or earlier? kekeke).
Meanwhile, the Harris Correction continues in stocks as the probability of another MMT-style fiscal bonanza in 2025 and 2026 drops along with Trump’s odds of victory. DJT odds on PredictIt are now below 50% (currently 49%) for the first time since May 13. There is some question about whether PredictIt is the best measure of Trump odds because liquidity there is poor. Most think Polymarket odds are more indicative, but it’s the direction of travel that matters, not the exact level. I am using PredictIt because the data is easily harvested from Bloomberg into Excel, but I acknowledge that the raw levels of PredictIt might understate Trump’s odds. Why people cannot simply arb PredictIt vs. Polymarket is above my pay grade.
The basis between the two has been constant at around 4% and therefore they are both sending the same message: The election was 72% or 68% in favor of Trump at the peak (Polymarket vs. PredictIt) and now it’s either 53% or 49%. In other words, the chart is going to look exactly the same, whichever odds you use. If you want Polymarket odds, just shift the Trump odds y-axis up by 4%.
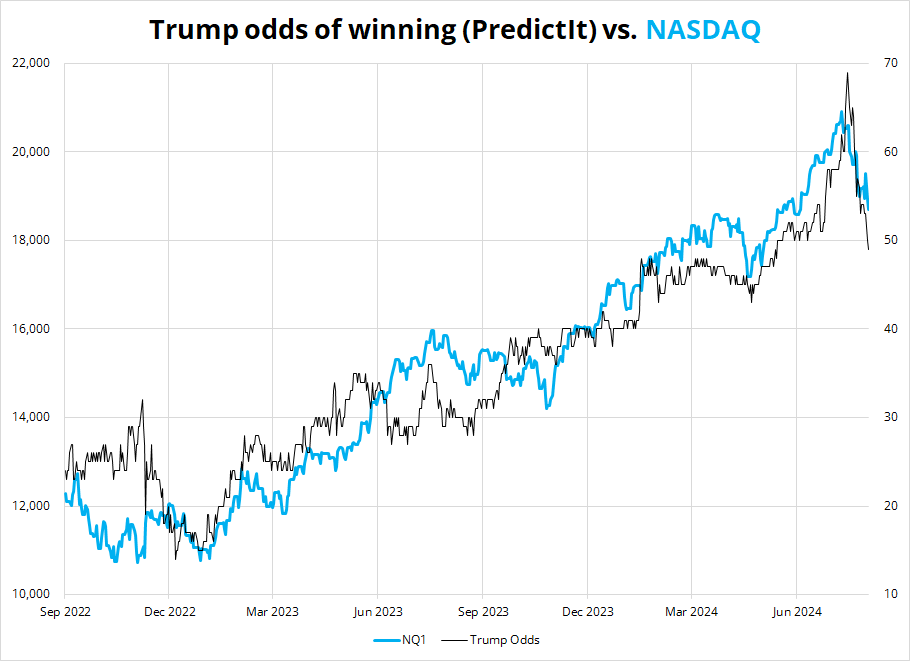
USDCNH and crypto are also suffering under the rising odds of a coin toss election following the blowoff mid-July top in Trump’s fortunes. GenZ are unironically sharing Kamala TikToks and Trump has failed to find an 8th grade level insult that perfectly fits Harris so far. Momentum comes and goes, though. Mr. Trump continues to test out various barbs and something will probably stick at some point and knock Harris off stride. For now, he is on the back foot and dodging debate questions. Note that USDCNH was already destroyed before payrolls.
Obviously, there is a lot more going on than just politics, as the AI narrative peaked in late June, the economic data in the US is curdling, and rabid dogs are tearing up every popular position and carry trade. It’s a bit of a perfect storm made worse by 99th percentile equity long positioning in late June, poor seasonals that started in mid-July, and a cloudier economic reality. Note that stocks can choose to go up or down on bad data and they are choosing to go down.
I have written extensively about the tendency of FX vol to rise starting in the third week of July, but it’s interesting to see that not just FX vol, but pretty much everything is following the textbook seasonal pattern. AUDUSD, NASDAQ, USDJPY, and GBPUSD all peaked within a day or two of their normal seasonal apices. Most of these moves tend to continue for another few weeks, with NASDAQ bottoming first, and AUD and GBP last. The ends of these moves tend to come as follows:
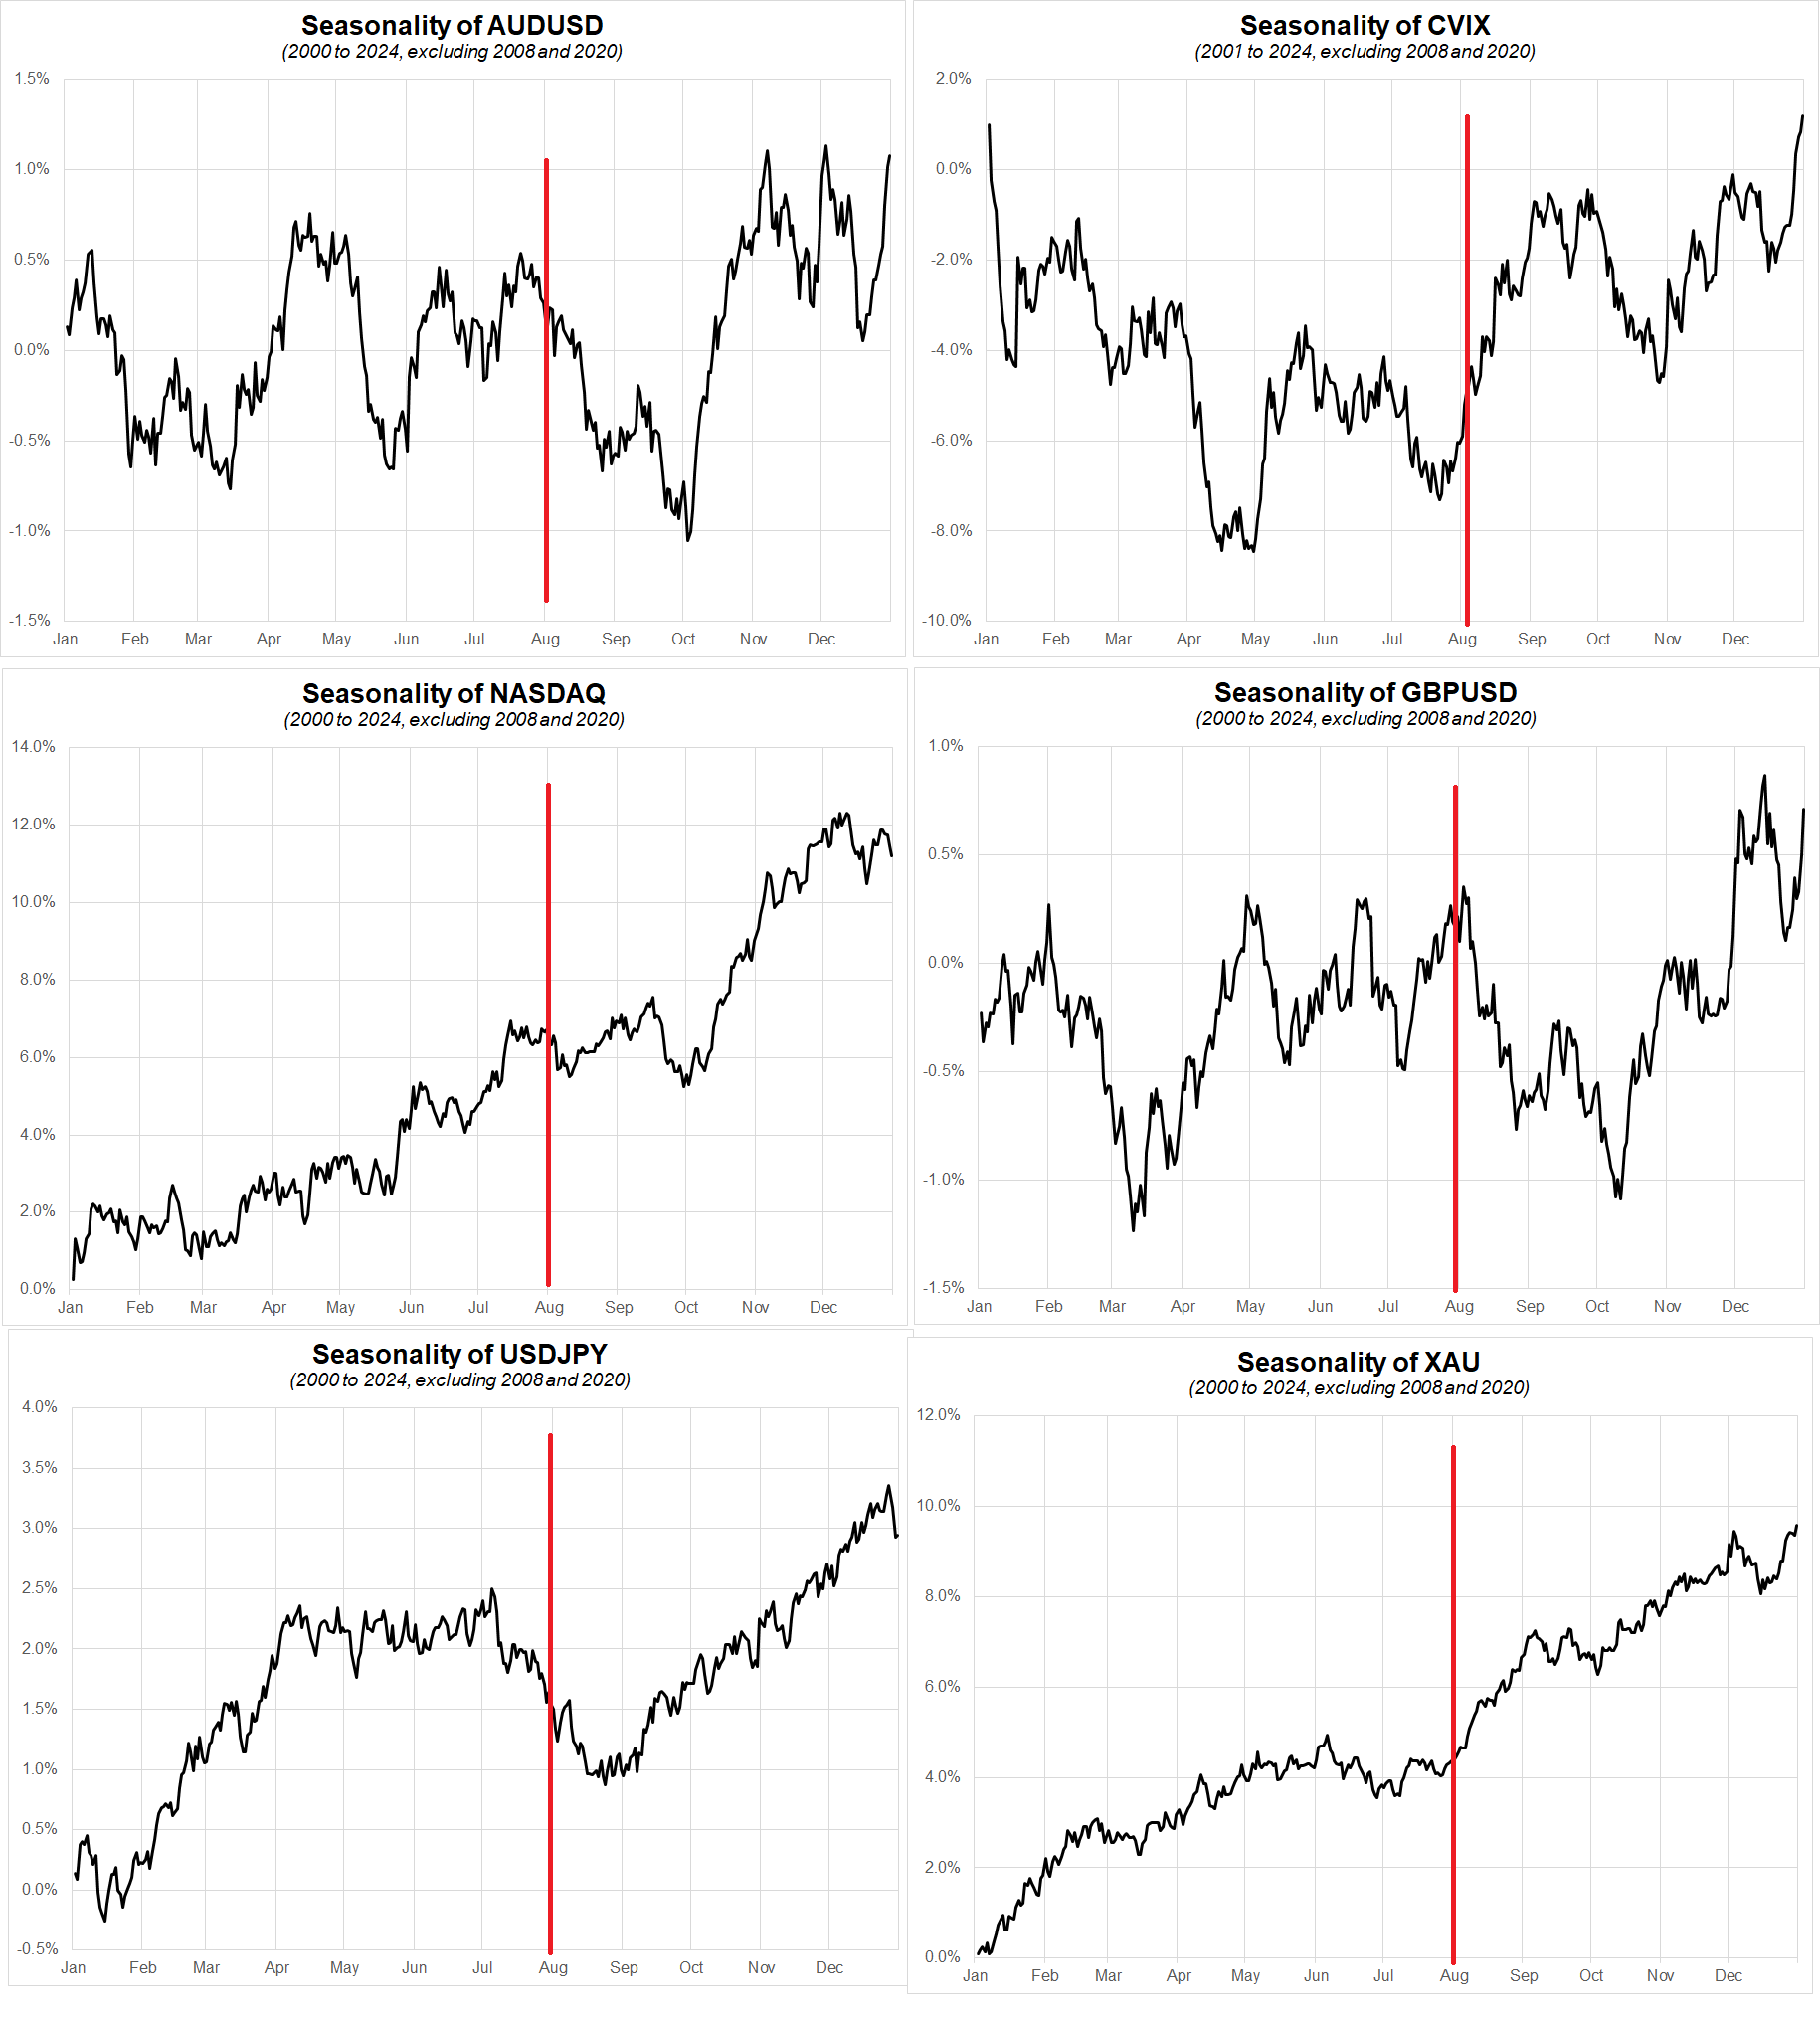
I will keep these dates in mind in the weeks to come.
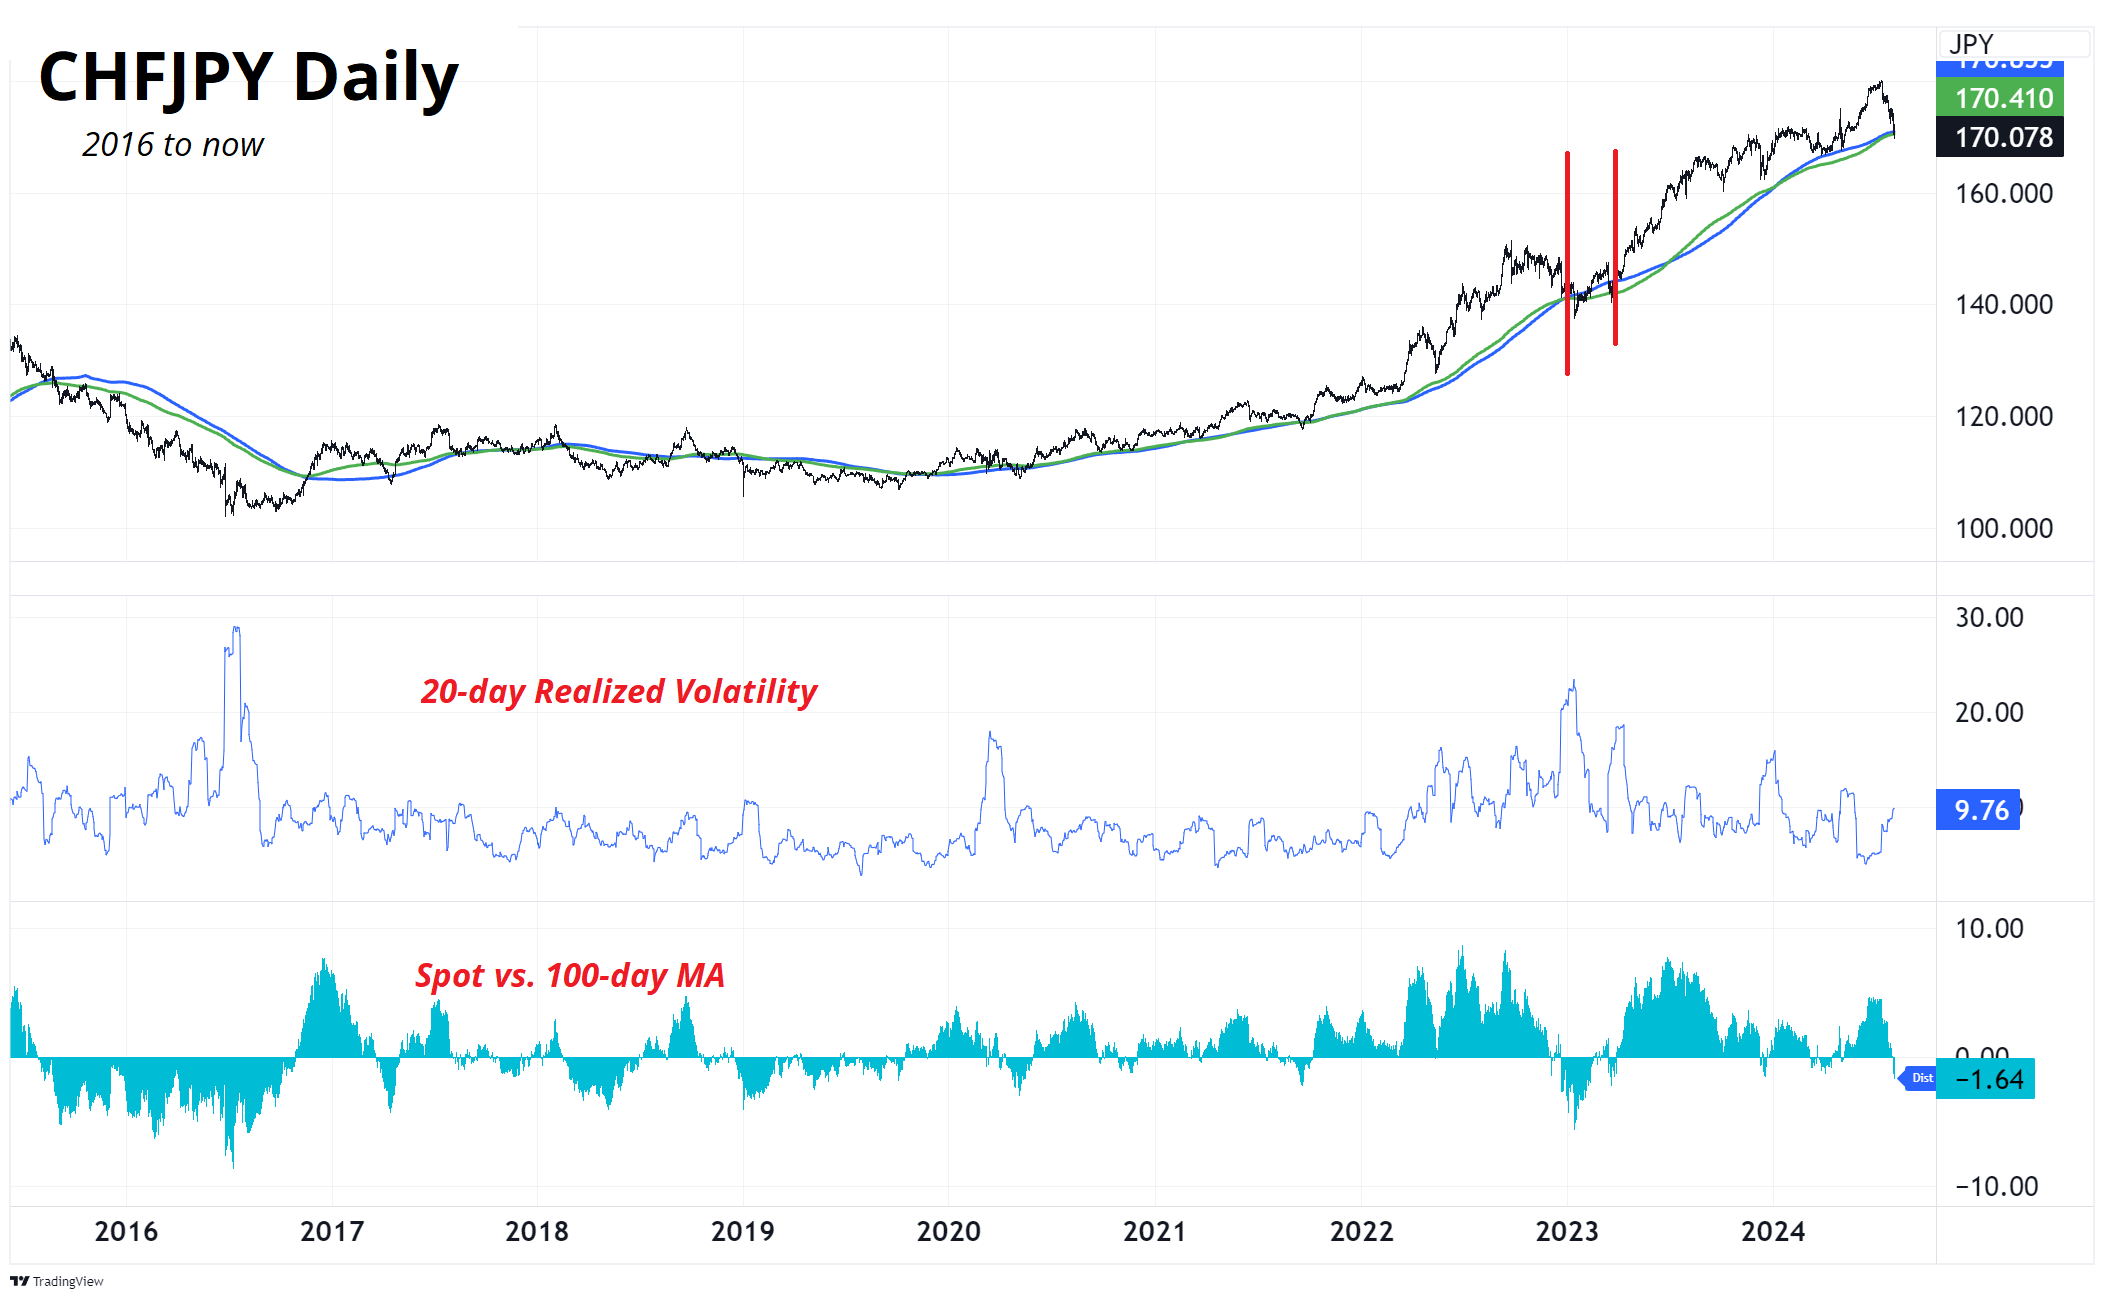
The CHFJPY trade is benefiting a bit (though not tons!) from collapsing global yields and there could be a huge move coming still. You can see in this chart that it has mostly been above the 200-day for four years. The chart shows CHFJPY on top with the 200-day MAs (simple and EMA) in the first panel, realized volatility in the second panel, and the deviation from the 100-day MA in the third panel. The 200-days are 170.86 and 170.41.
Takeaways:
My take profit on this short CHFJPY trade is ambitious. I put it as 163.56 for now, subject to modification over time. Swiss deflation numbers overnight support the case for possible SNB smoothing intervention in EURCHF, soon. If we fall further, I will consider moving my stop loss lower, of course. I am hoping to be a pig on this trade if it gets some momentum below the 200-day. So far, it’s a good entry point, but this is the first inning of a long game and it’s trading all over the place; so let’s see.
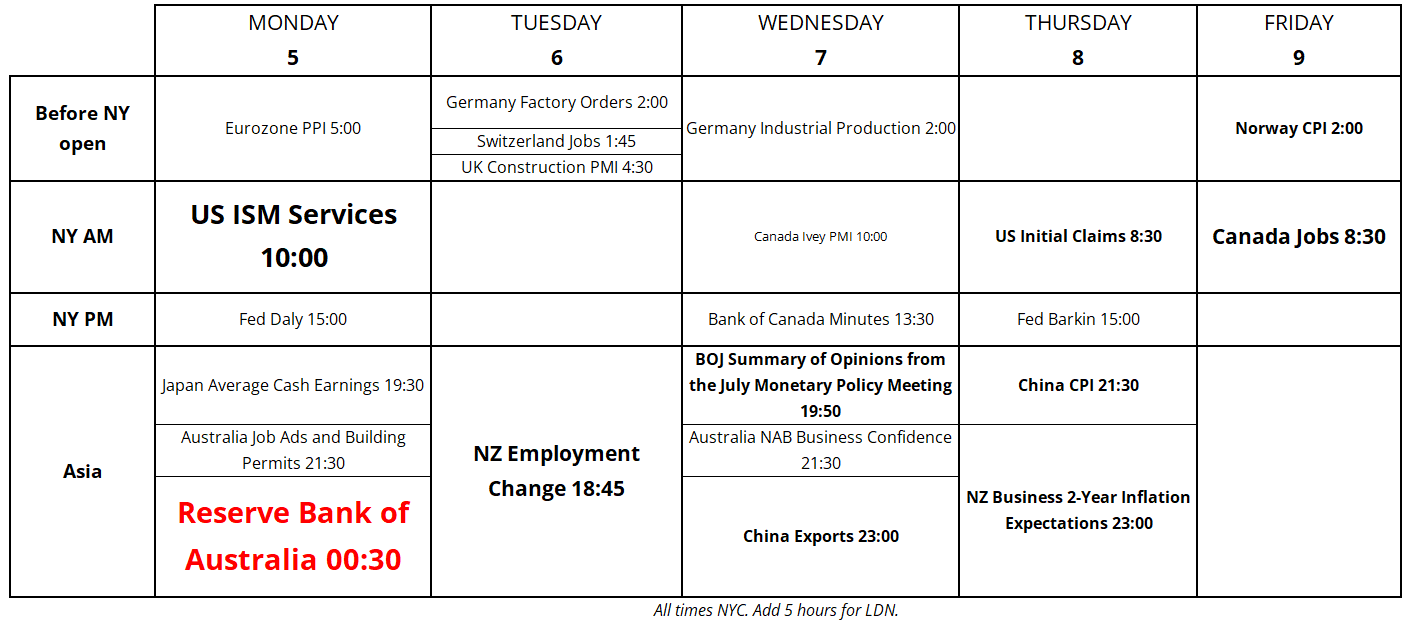
Next week is meek relative to this week’s ferocity.
My latest podcast with Alfonso Peccatiello is up and ready to be enjoyed by your ears. We talk about the current mayhem in markets, why yields could keep falling, and how to incorporate positioning into a good trading framework. Check it out right here.
May your weekend be free of false precision.
Somewhat logical explanation in the comments here.


This piece is mostly for people who are interested in backtesting

