Euro Drivers
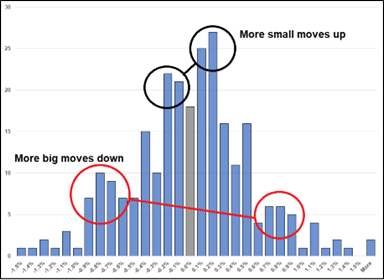
Over the past year, there have been 127 up days in EURUSD and 133 down days. And yet EURUSD has dropped from 1.18 to 1.02 because the distribution of moves looks like this:
EURUSD histogram of daily moves over the past 12 months
A frequent question I get from those outside the weeds of the FX ecosystem is “What could turn the USD around?” or “What could push the EUR higher?” It’s a hard question to answer! I tried in the August 11 am/FX and ended up going short euros by the end of the thought process.
The most obvious answer to the question, I suppose, would be peace or ceasefire in Ukraine and an end of Russian sanctions. But we will not hold our breath for that one. Some sort of endogenous move lower in European energy prices that leads to a calm winter would be better than expected news, but would it be enough to floor the euro here? I mean… Maybe? 1.00 is cheap by historical standards.
EURUSD spot since launch vs. average price since launch
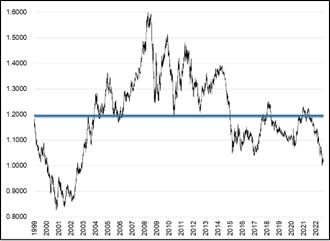
Amazingly, the euro first traded at 1.1795 on the open in 1999, and its average closing price has been 1.1960 in the 23 years since. I guess the underwriters did a good job of picking the IPO price. Anyway, I could come up with a variety of subjective scenarios that might put a floor under EURUSD or push it back towards the all-time mean, but instead of using my imagination, I wondered if there would be a more quantitative approach here.
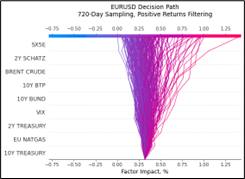
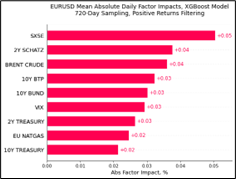
I asked Deepak Ramaswami, Spectra’s resident quantitative expert, to look at what factors were in play when EURUSD went up and down over the past two years, so that we could have an intuition into what might work in the future. That is, what conditions drove EURUSD higher of late? That is a good starting point for thinking about this question. He created two conditional distributions / decision tree diagrams—the way to interpret this is that more important factors are at the top; the horizontal scale tells you the impact of each factor; each line is one ‘decision’ of the model.
Looking at EURUSD over the past 2 years—conditional on positive returns, SX5E is the largest driver by a considerable margin. Front-end rates matter too, but not that much—there isn’t much diversity among important factors here.
Whereas to the downside—VIX matters the most, surprisingly. EURUSD acts as a proxy for global equity volatility, probably via the ensuing flight to US assets. But note that other factors are important as well—the US treasury curve, and European sovereigns as well. On the way up, EUR is a European equities trade. On the way down, it’s an amalgam of relative rates and risk proxies.
The decision trees and XGBoost Model for EURUSD when it goes down are on the next page. PS: if an automotive company released a car model called the XGBoost… I would buy it. Especially the BMW M5 XGBoost Model.


The two different charts are the same data, presented in two styles. The red chart is easier to interpret while the cyberpunk lightning tornado chart is more visually pleasing. The main difference between this and correlation or linear regression is that gradient boosting takes into account convex effects, linear approaches do not.
While some of the outputs here are obvious, some are not. These are my personal takeaways:
- If you’re cheering for higher EUR, make sure you’re not just expecting higher EU yields, but also bullish Euro Stoxx. If and when the ECB start hiking, “good rate hikes” benefit EURUSD more than hikes that make risk wobble. The BTP connection is also part of this. Good rate hikes don’t seem imminent!
- If you’re short EURUSD, you want a higher VIX and higher US 2-year yields. BTPs and NatGas are less important.
- EU NatGas is fun to watch but does not appear to be a top tier direct driver of EURUSD (though it probably has some derivative impact via its effect on Schatz, Stoxx etc.)
An important caveat here is that this analysis is backward looking, and the drivers are not static. That said, I think it’s reasonable to project these drivers forward because they are mostly things that have mattered over the years. In contrast, if NatGas was a bigger driver, I would be less confident in the forward-looking usefulness there because that is likely to be very specific to the current gas panic regime.
I hope you found this useful. It’s one way of slicing and dicing what matters for a currency.
Final thoughts
A few people asked me why the USDCAD and USDCNH bullish trades are not the sidebar. It’s simply that I don’t put longer term trades in there and those are both one-to-three-month views. I think USDCAD closes the year around 1.3500.
BBBY. What a mess.
Have a hip weekend.
good luck ⇅ be nimble

Then the dream ends, when the phone rings
“You doing all right?”
He said, “It’s out there most days and nights…
… But only a fool would complain.”