
A mix of topics today including: China reopening, AUDUSD, CNH, Canadian consumer debt, and time machine conversations using AI.

Can you name these six
famous traders?

A mix of topics today including: China reopening, AUDUSD, CNH, Canadian consumer debt, and time machine conversations using AI.
Can you name these six
famous traders?
Stop loss 111-15
November 30, 2022
First of all, I am cutting the AUDUSD short. The news out of China is all over the place, but overnight news from Guangzhou is a positive, USDCNH is collapsing, copper has broken out of its downtrend, and short AUD makes very little sense anymore. I also believe the risks around most US labor market data will be on the weak side for the next little while, with particular downside risk to Average Hourly Earnings in Friday’s payrolls data. I will write more about that tomorrow.
Here’s AUDUSD vs. copper and USDCNH.
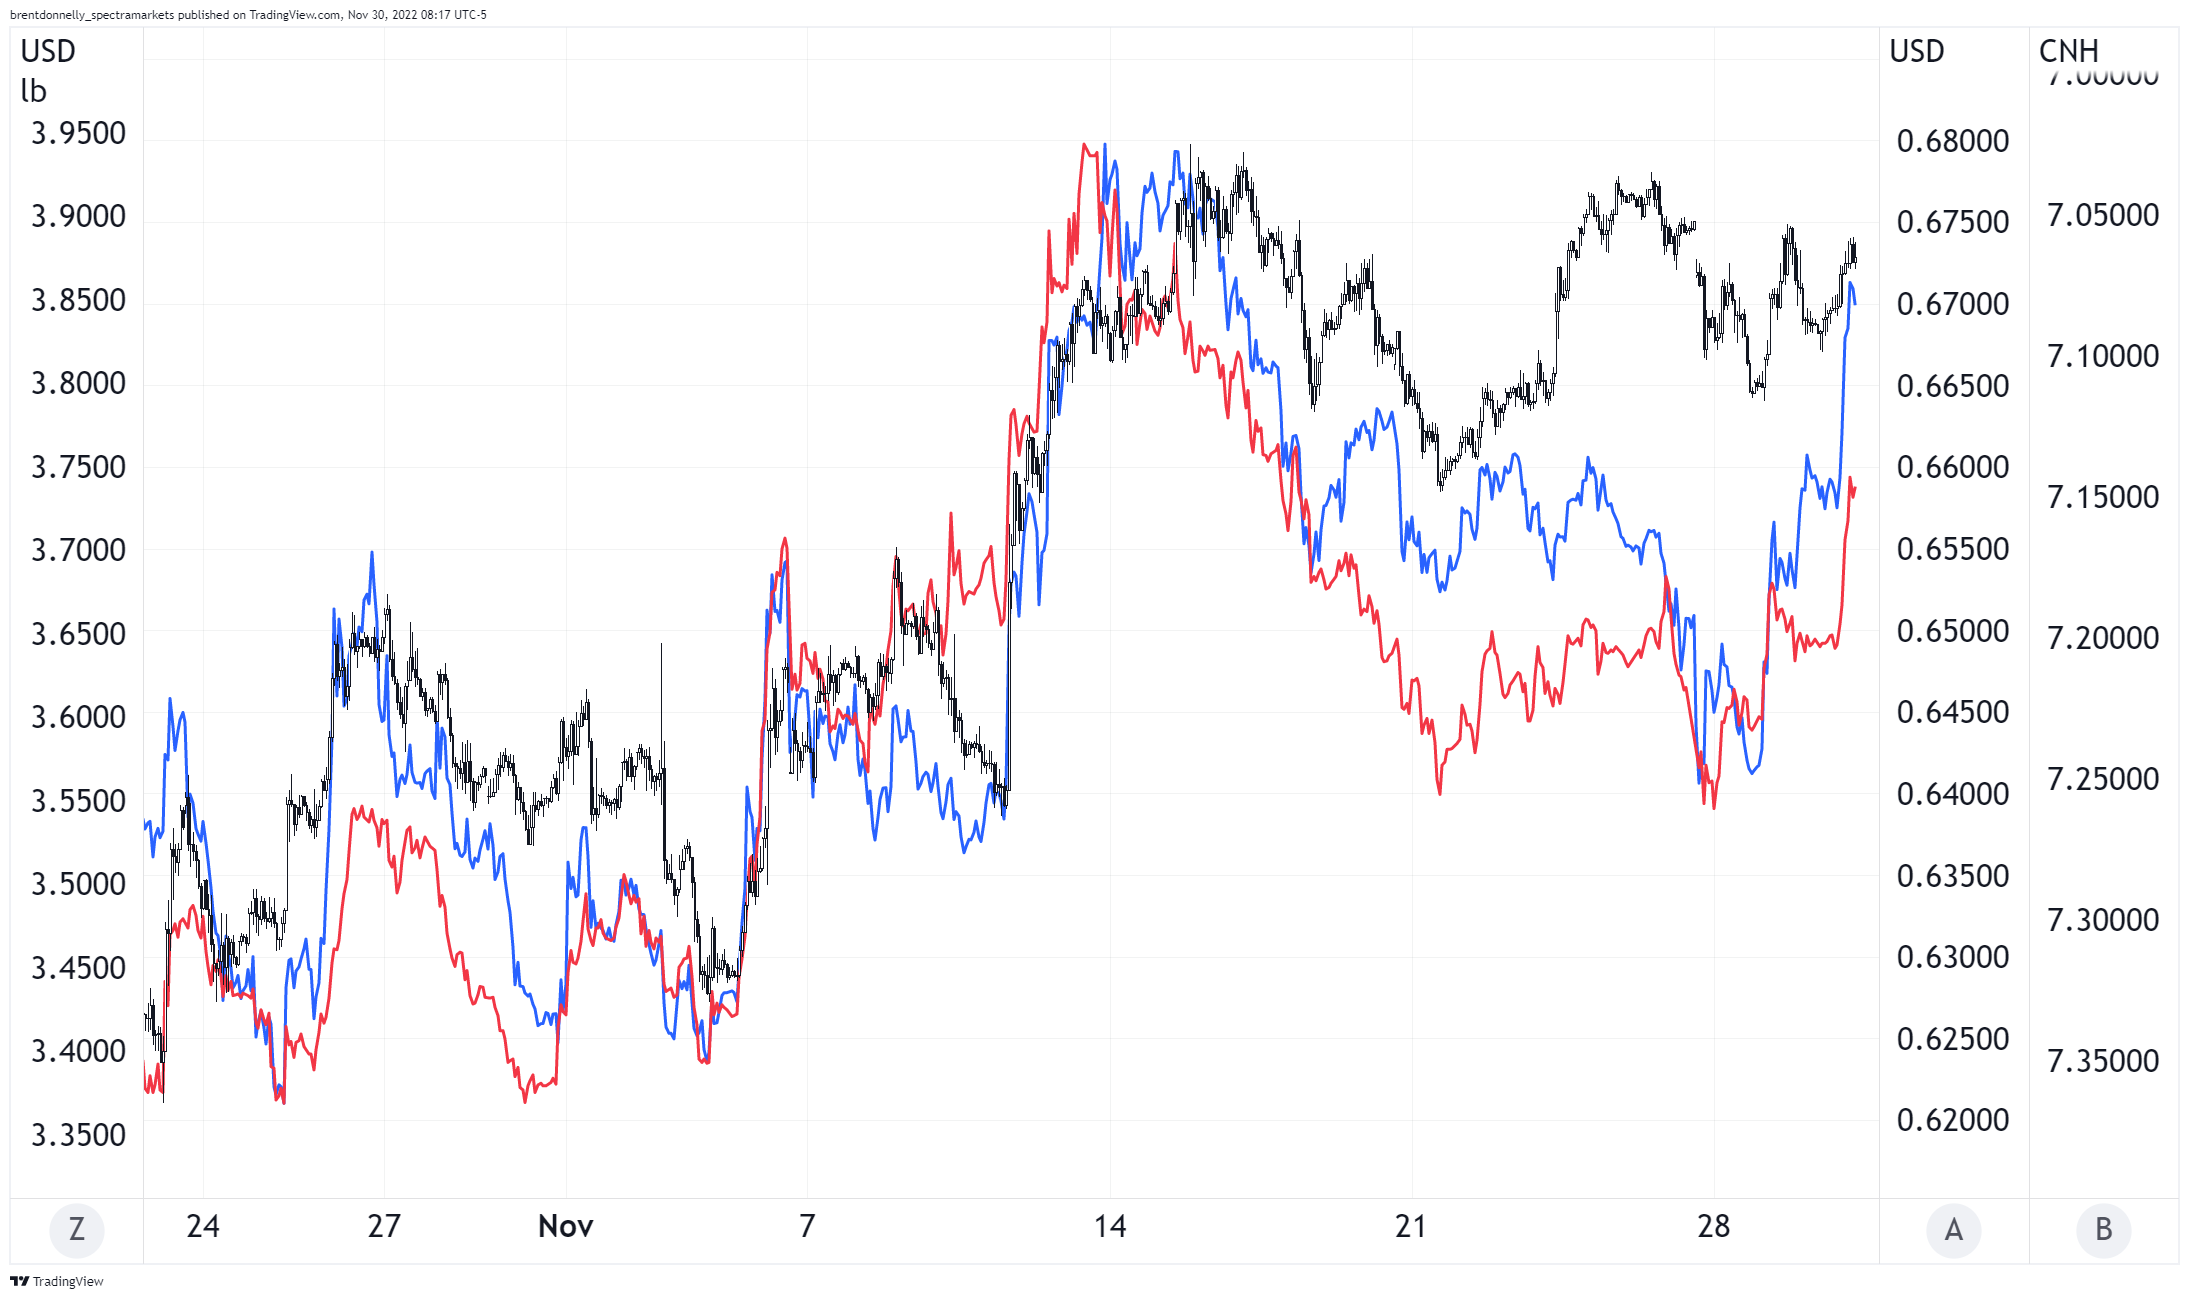
It’s not as if AUDUSD is necessarily a screaming buy here based on that chart, but the idea that AUD should go lower as commodities fizzle feels stale as oil has also stabilized for now. On top of all that, you’ve got a cartload of data, Powell, and an OPEC meeting over the next few days. I am also losing my religion on the bearish equity view for now.
Time to take the 10 pip L and move on. I am holding onto the bullish bonds view as I think it’s a safer bet through all this event risk.
If you were not aware, the generically named website “apartmentlist.com” is an excellent source of rental price information. They also have strong economics and analysis and visualizations. Below is the first chart from their 29NOV update.
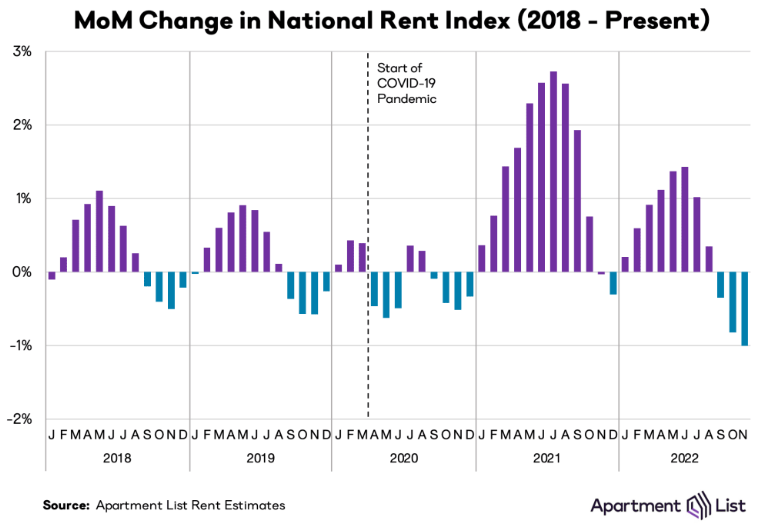
Those figures are MoM, so the past two months are annualizing around -10%.
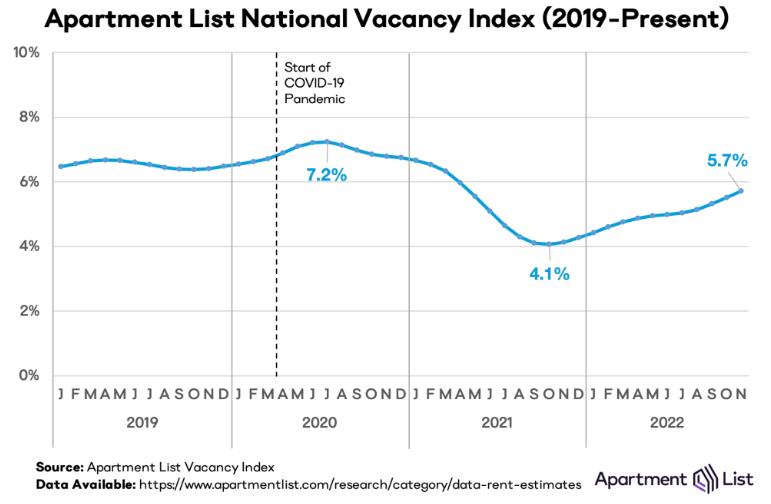
And vacancies are rising. Also, Chuck notes: “Every city in the Case-Shiller 20-city index saw a decline in home prices in August and September. The last time all 20 cities were down two months in a row was Dec 2008/Jan 2009. San Francisco is showing the largest decline in home prices thus far, -10.5% from its peak in May.”
Housing prices and rents are falling fast, just like autos, shipping, and pretty much all the stuff that stoked the inflationary zeitgeist in 2022.
USDCAD did this yesterday:
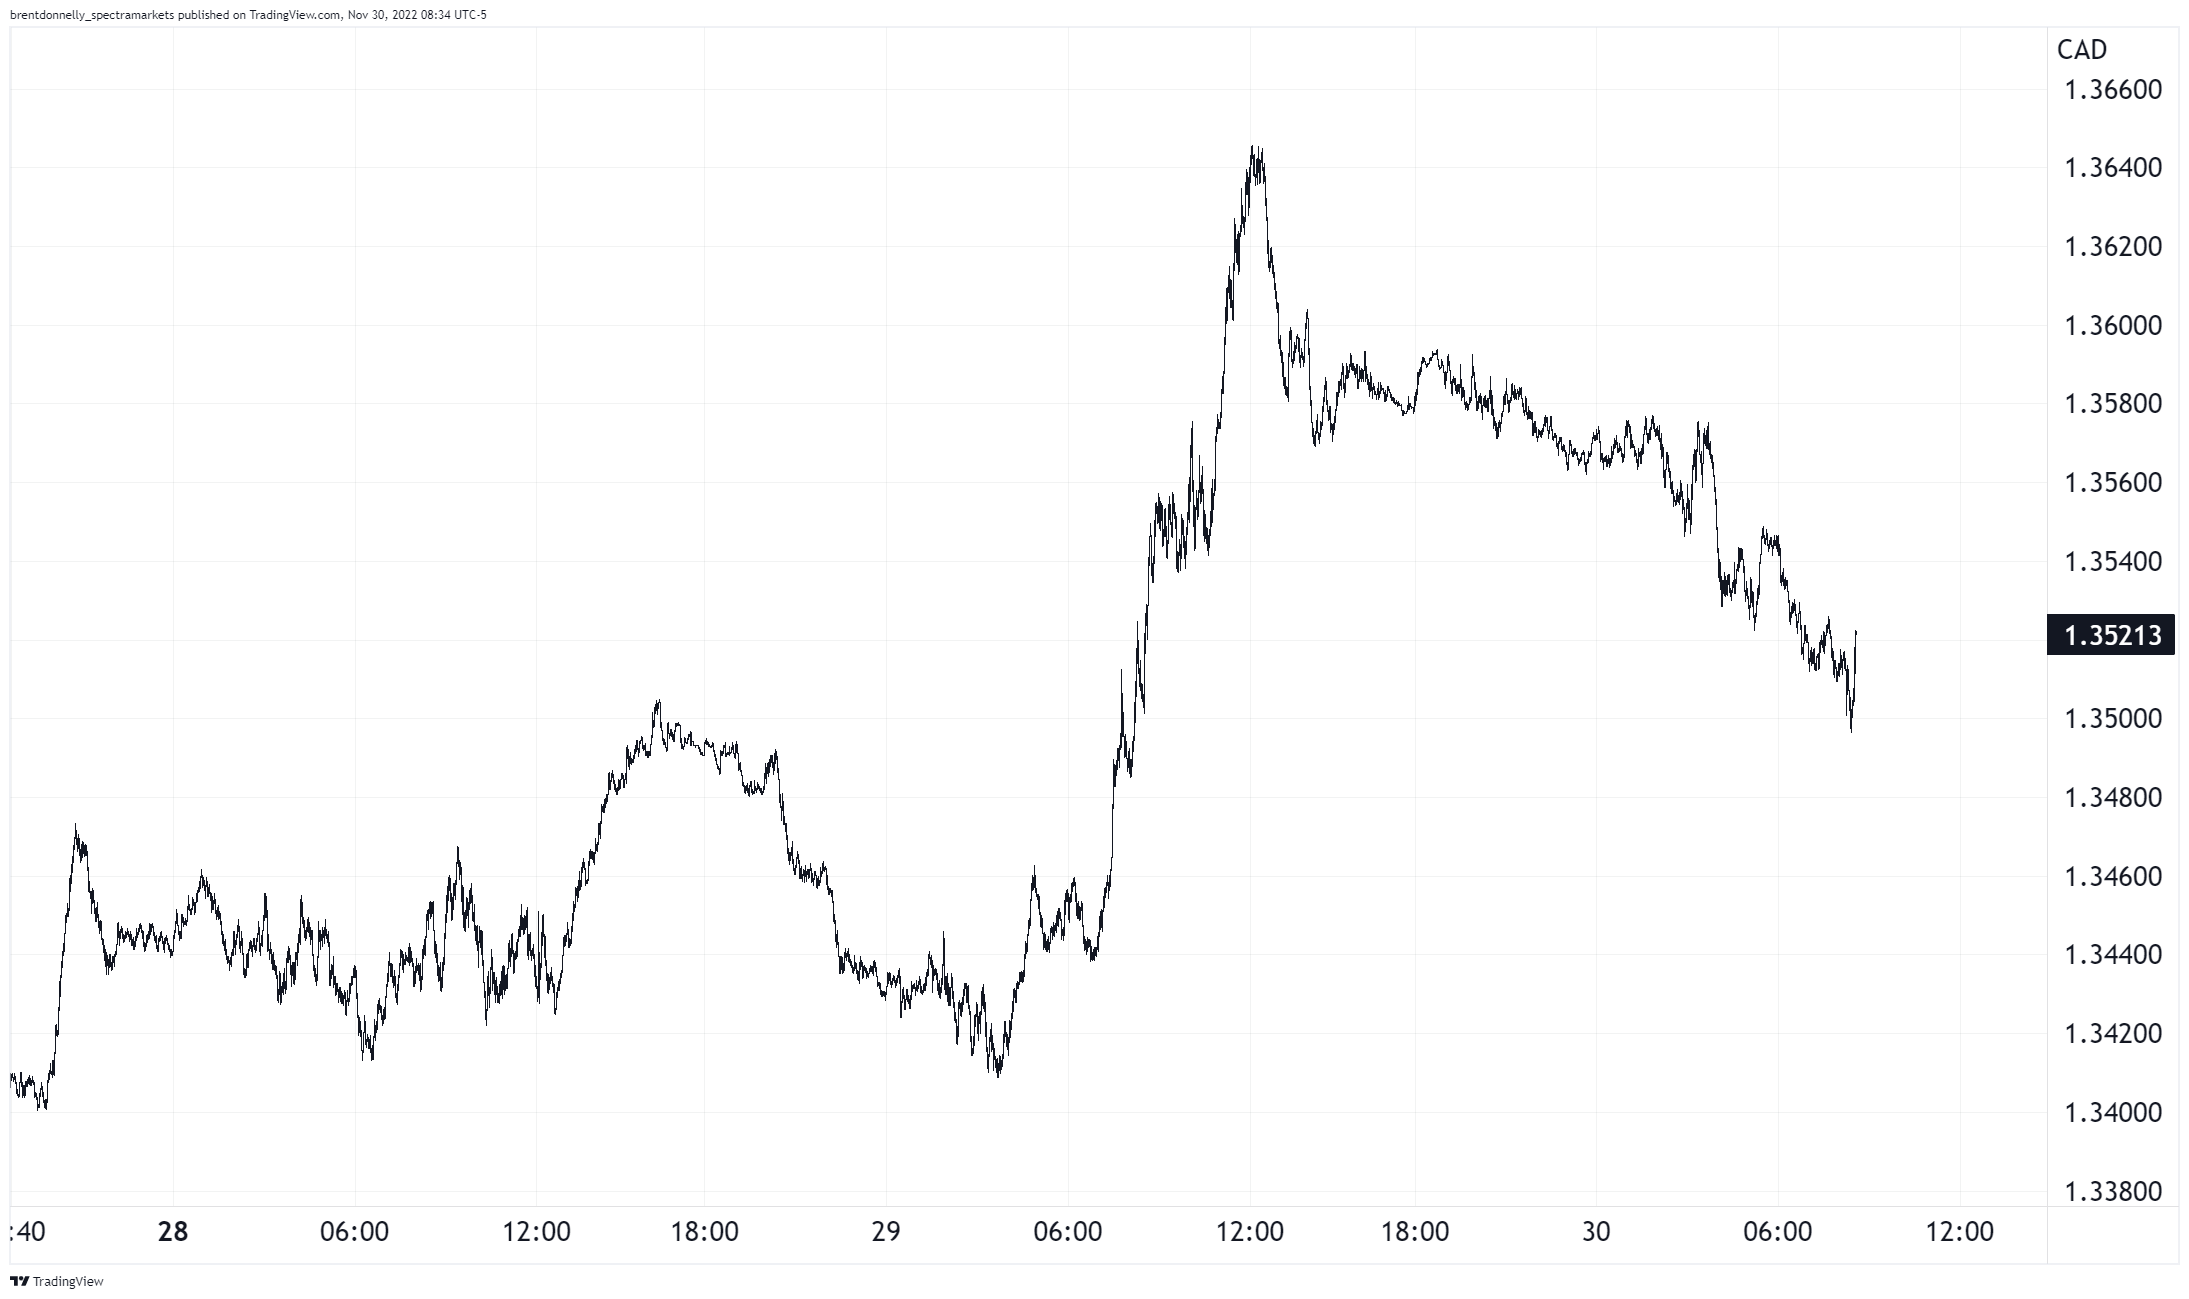
That rally from 1.3440 to 1.3645 took place from exactly 7 a.m. NY time to noon. The move is widely believed to be conversion of FX for the deal where RBC is buying HSBC Canada for $10B USD (13.5B CAD). I have no special insight into the flow, it’s just that the headline hit at 6:53 a.m. and USDCAD started ripping on 5X normal volume for the next five hours straight. So it’s a reasonable guess.
Flows like these very often start and end on round times because they either executed electronically, or include instructions something like: “Get it done before London close” or “Make sure we’re done by 3pm” etc.
Whenever a huge flow like this goes through, I always get questions about average daily volumes in the currency and how can we estimate the impact of the flow. Let’s say $5B USD went through yesterday, how does that compare to average daily volume? This question is hard because FX volume data is all over the place and massively overstates liquidity.
For example, the BIS says 466 billion USD worth of USDCAD goes through every day, on average. If you hear that figure (or some similar gigantic figure from CLS or another source), you would think: Man, 5 yards is nothing[1]. That would be wrong! Average daily volume data in FX is completely meaningless as it’s the sum of all the ding dong ping ponging of algos and back and forth bid/offer bounce and all that. A massive, massive proportion of volume is market making and two-way. When you come in with a transaction all in one direction, the market moves. 100 million USDCAD can move the market. 5 billion USD is huge.
The only point here is to say that comparing transaction size to average daily volume in FX is meaningless. And most of the FX average daily volume estimates are meaningless. Net flow of >1B USD in one direction in any currency over less than 4 or 5 hours is large. Market impact will vary based on liquidity, volatility, time of day, and skill of the market maker.
—
[1] A “yard” is slang for a billion. From the French “milliard.”
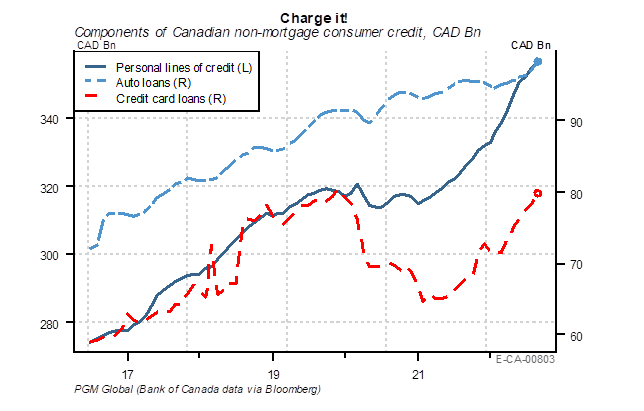
Alf has been circulating this chart for a while, but I have not shared it and it blows my mind. I actually find it so amazing that I had trouble believing it, so I asked a Canadian economist friend of mine, who said it passes the sniff test.
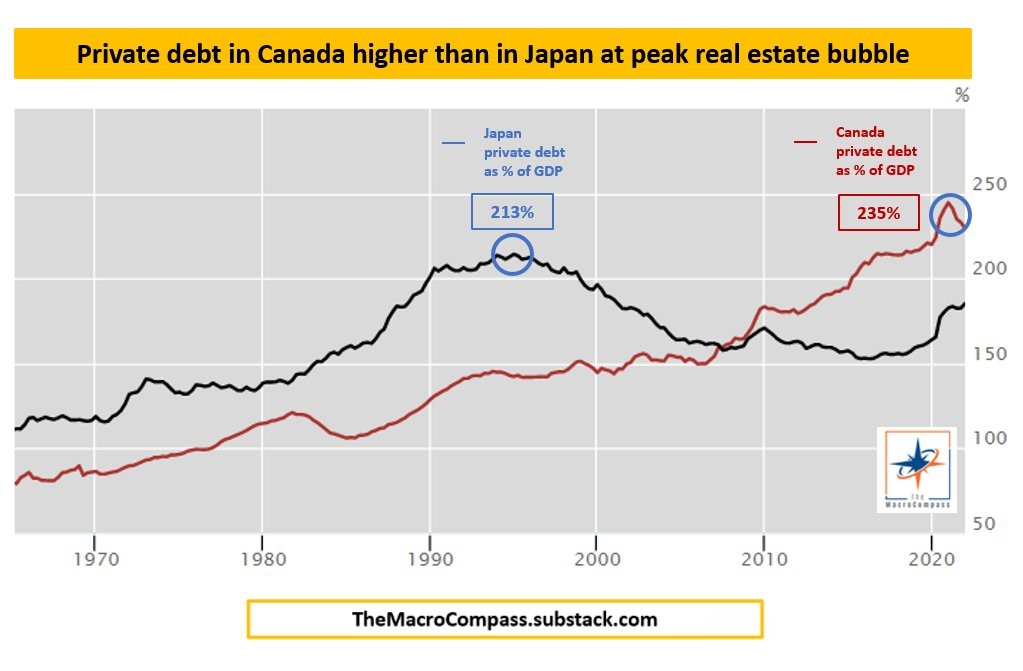
Debt doesn’t matter as long as rates are low because cost of servicing is what matters, not nominal debt load. Cost of servicing is about to skyrocket as debts are rolled, reset, and triggered. This recent Bank of Canada paper sheds more light on rate resets and triggers in 2023.
And you probably get the idea by now, but here’s another glimpse into the gigantic pile of debt building on consumer balance sheets in Canada. This last chart is from PGM-Global’s morning note. A much more dovish BoC vs. Fed is coming in 2023. Even from current levels. If you are bullish bonds, owning Canadian bonds looks good. The 2-year USDCAD fwd at -158 should break the lows of -230.
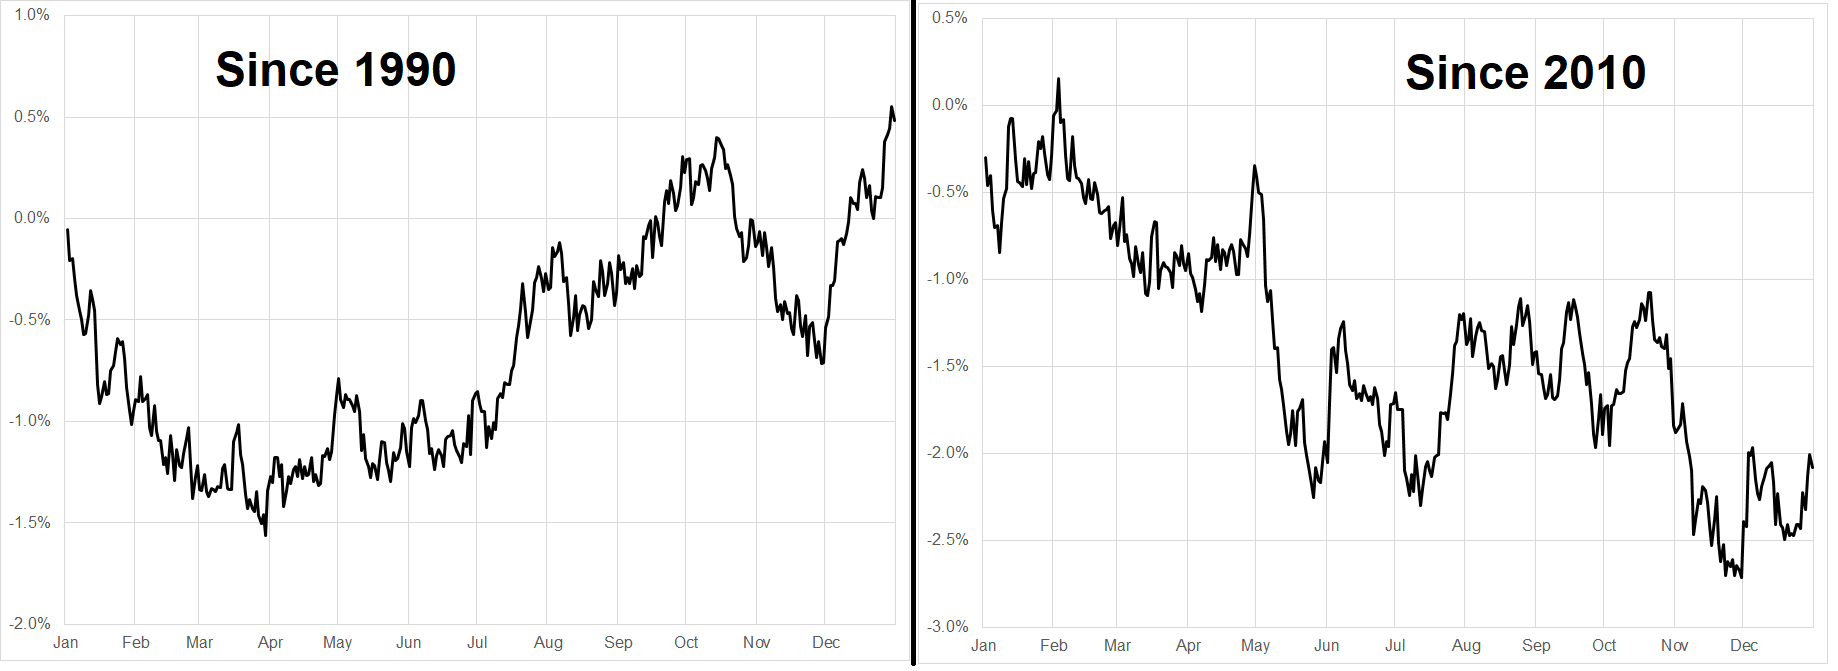
In case you were wondering, here’s the seasonality of AUDUSD, EURUSD, and USDJPY in December.
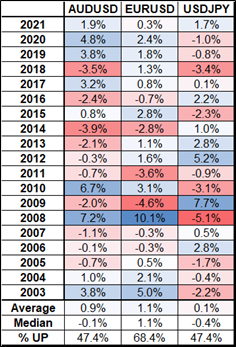
AUDUSD and USDJPY are noise, but there is possibly some signal in EURUSD as it’s very consistent in December. Seasonality could be fooled by randomness like the roulette wheel that comes up red all the time, or it could be a seasonal flow that is recurring. Given the massive flip in Europe’s external balances, I am not excited about seasonality in EURUSD, but here it is for your info. Note the mega ramp in the first week of December on both time frames.
This thread will take you about 7 minutes to read. It is fascinating, beautiful, and a teeny tiny bit eerie. It is about a woman who took her childhood journals and put them into GPT-3 (AI) in order to have a conversation with her younger self. Like therapy and time travel.
Have a greatest of all time day.
From top left:


This piece is mostly for people who are interested in backtesting

