There are excellent points and counterpoints in the 2023 US recession debate. Here’s what I am watching.
Current Views
Long TYZ2 @ 112-17
Stop loss 111-15
Short AUDUSD @ 0.6711
Stop loss 0.6811
Take profit 0.6555

There are excellent points and counterpoints in the 2023 US recession debate. Here’s what I am watching.

Stop loss 111-15
Stop loss 0.6811
Take profit 0.6555
November 23, 2022
First: In yesterday’s note, I asked “What is your favorite trade from now until June 2023?” The huge majority answer was “long bitcoin” or something similar. Short crypto vol, long ETH, long SOL, long bitcoin. Out of 16 responses, eight were long crypto. Small sample but still interesting given I’m a legacy fiat guy. The only other pattern was a few people like long a G10 currency vs. short CNH (i.e., EURCNH long, CNHJPY short). Seems totally reasonable.
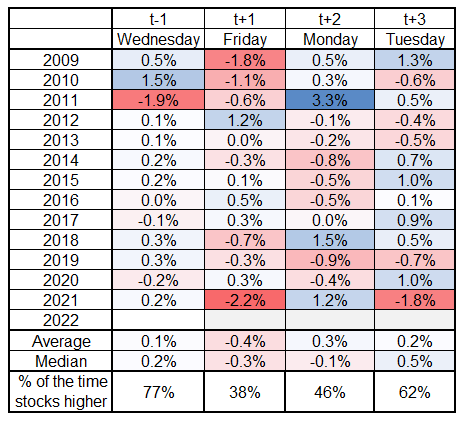
Second: Looking at stocks in the short term, there has been some negative behavior around the Thanksgiving weekend
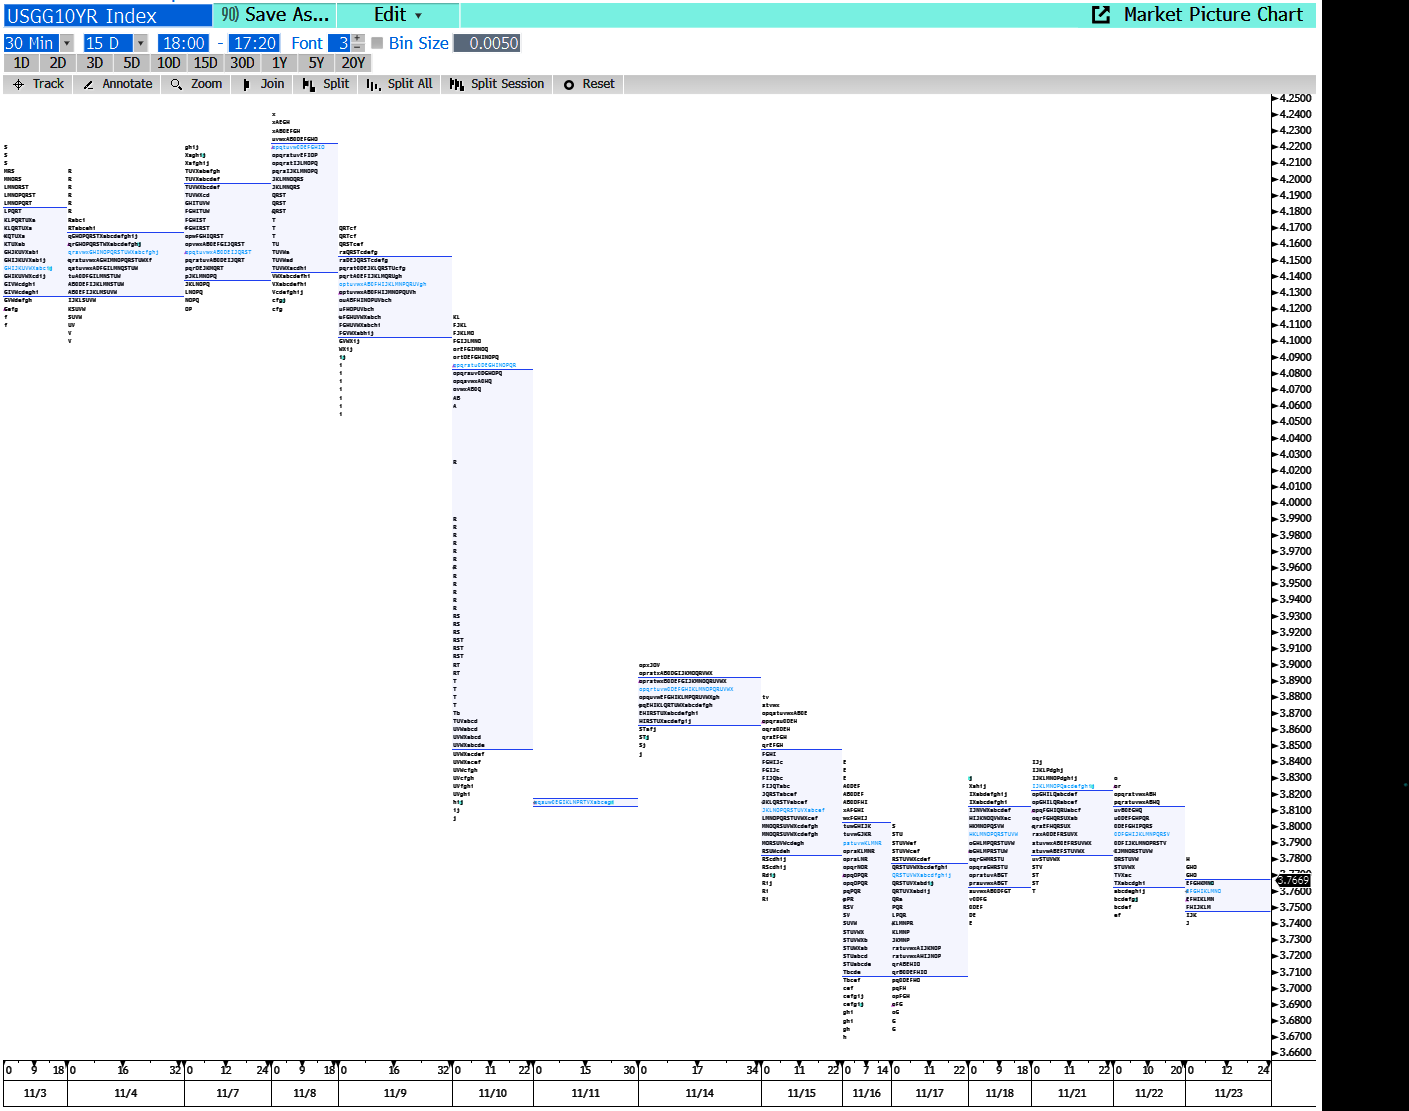
Third, something else to keep an eye on is the path of US yields from here. After CPI, we gapped down from 4.07% to 3.90% and have been etching out a clean range now 3.67/3.90. Yields have been respecting the top of the gap and we have now spent 11 days consolidating. My view is that the next move in yields is lower and if that view is correct, we should not go back above 4.0%.
The market profile of yields (MKTP on Bloomberg, useful guide here) is an excellent way to see this abandoning of the old equilibrium zone (3.90/4.30) and the establishment of a new zone. Each letter on the chart represents a 30-minute period where yields traded at a given level. Here are the past 15 days:
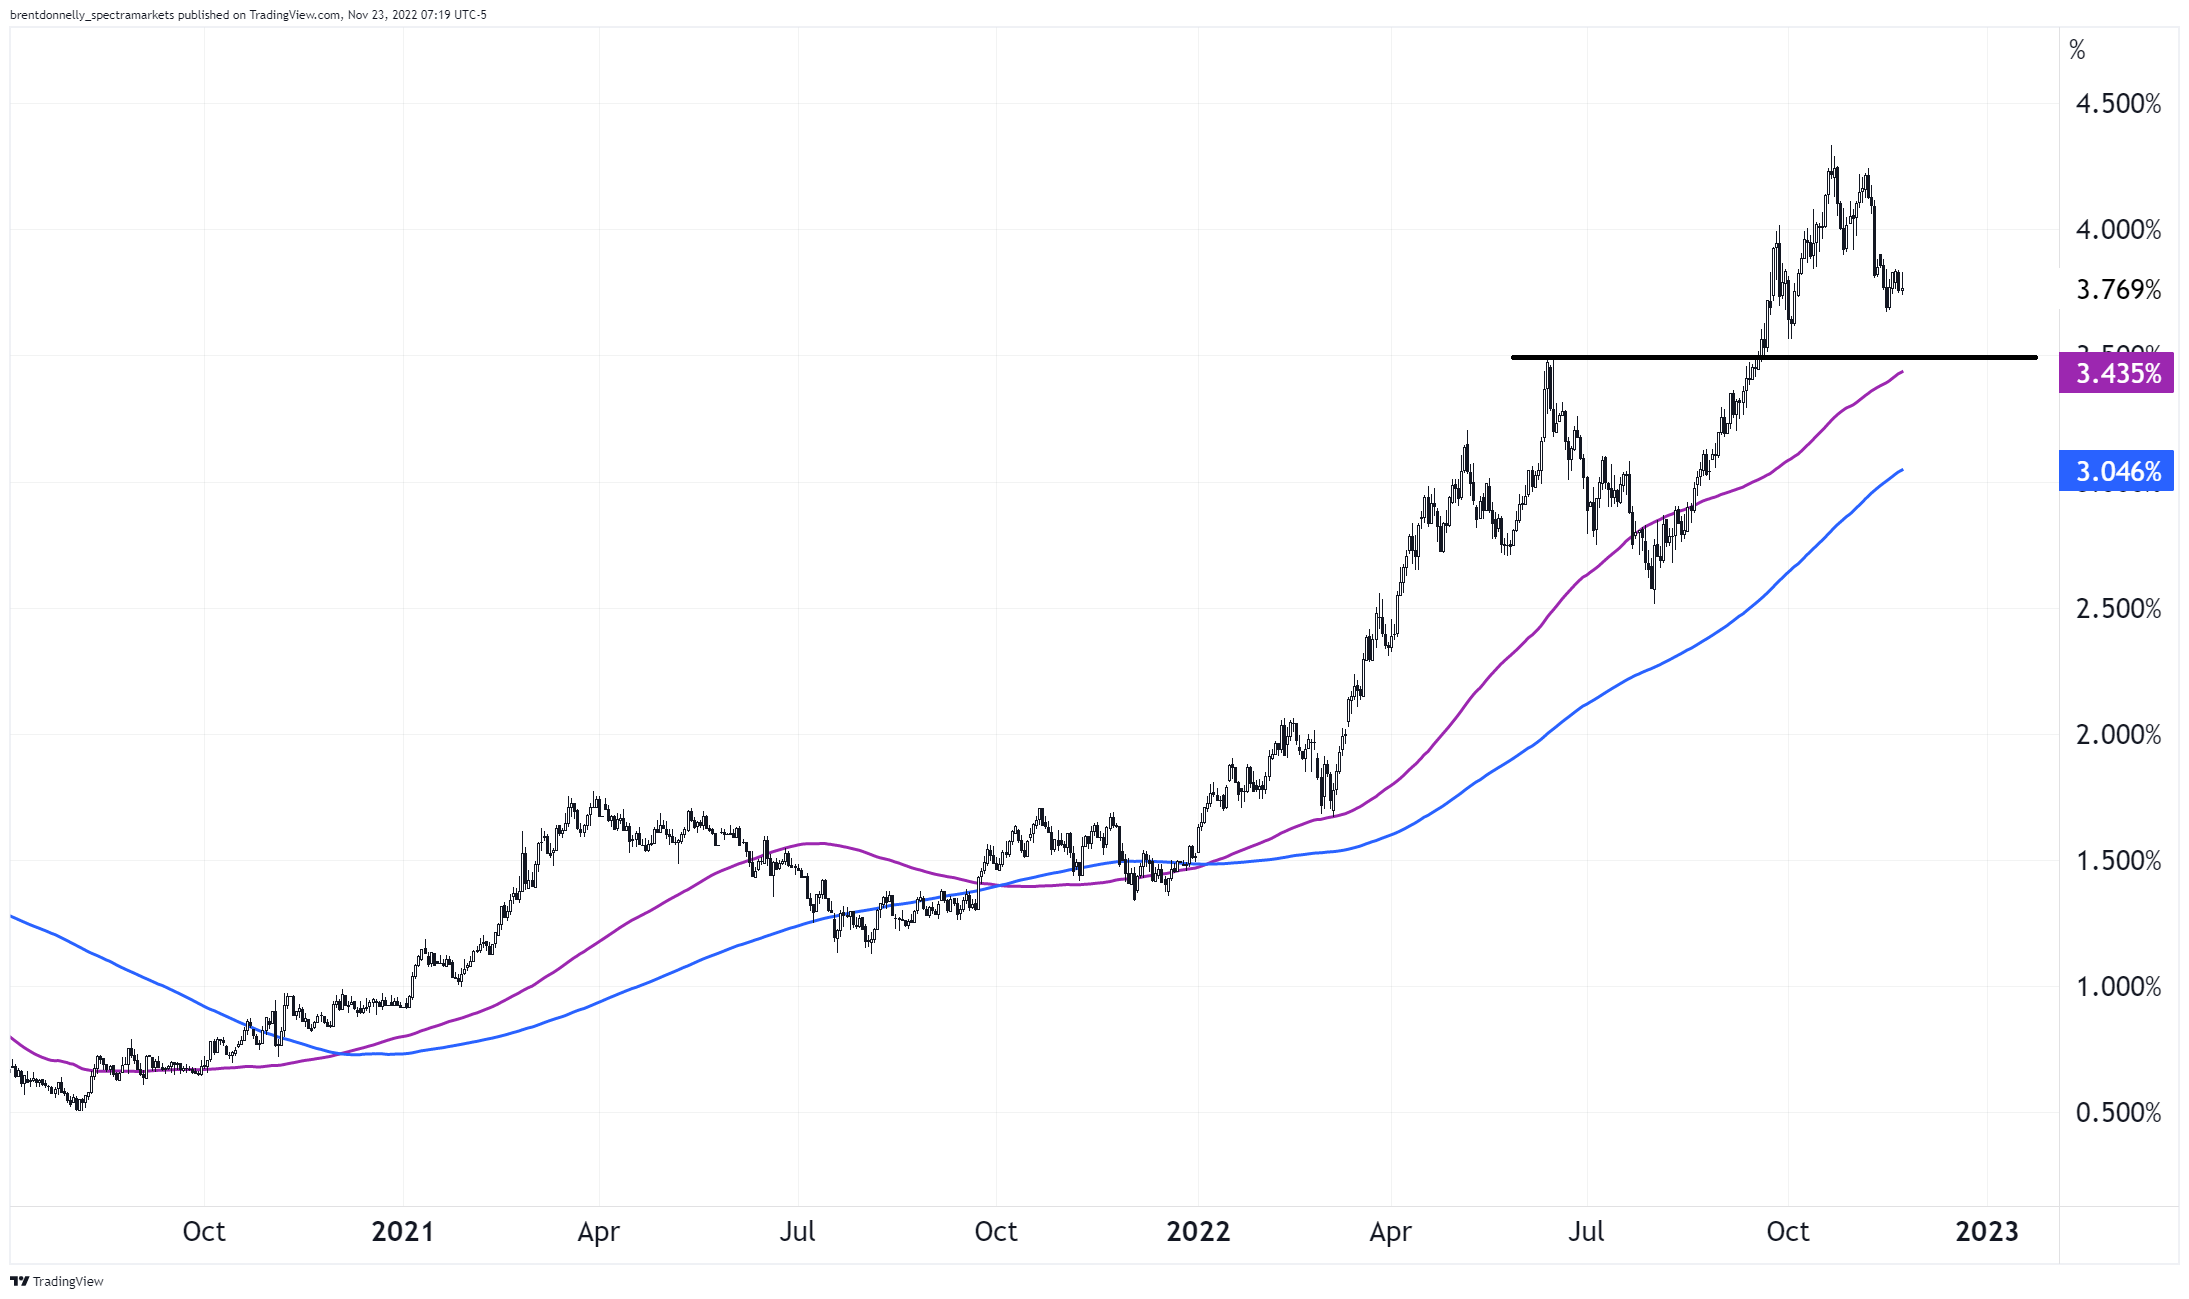
Zooming out, a good short-term target for 10-year yields is 3.50%, that is the old YTD high as of June 2022 and just above the 100-day moving average. Here is the chart.
There are some compelling arguments for US recession in 2023. First and foremost are the aggressive and deepening yield curve inversions. Jim Bianco had a good thread on inversions last night; this table stood out to me.
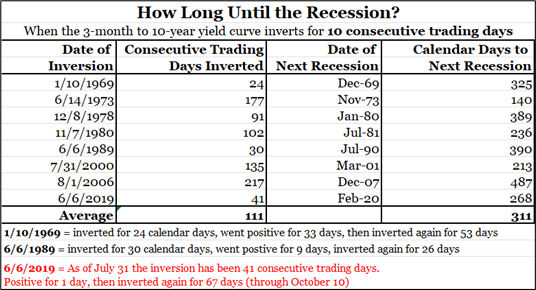
311 days from now is September 30, 2023. The range of lags has been 140 to 487 days which puts the range wide but real: US recession starts sometime between April 12, 2023, and March 24, 2024. Don’t rule out 2023 Fed cuts.
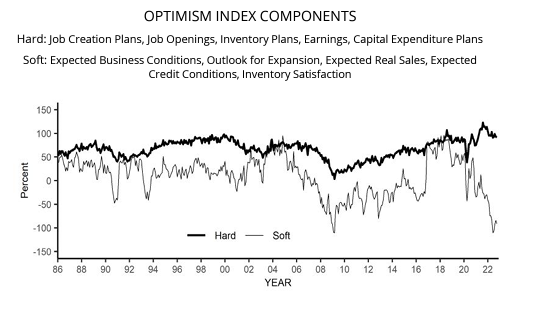
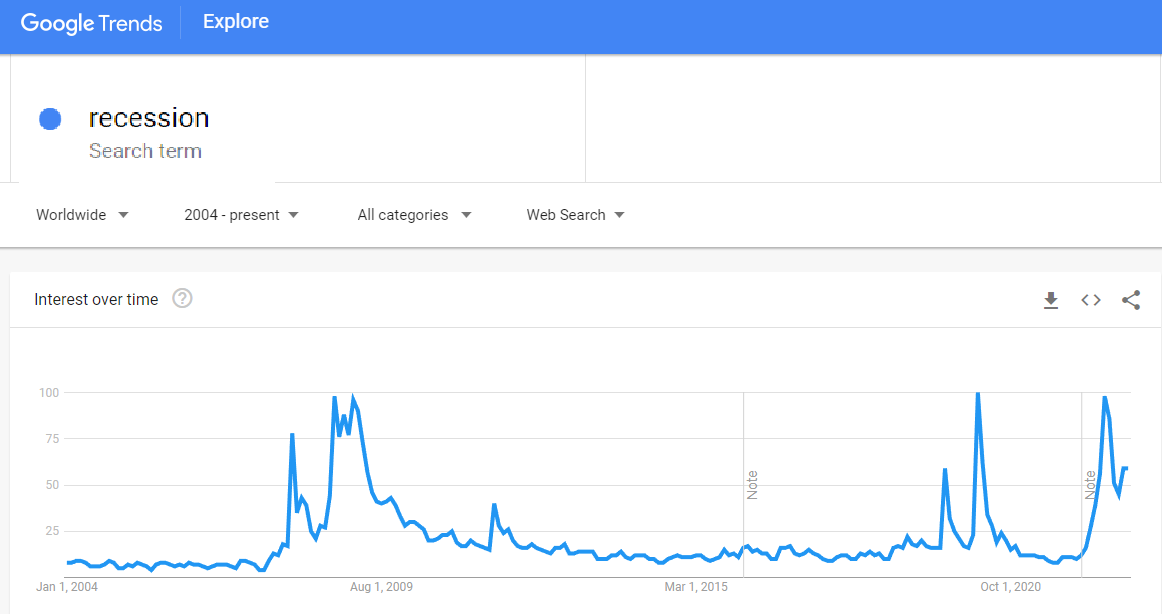
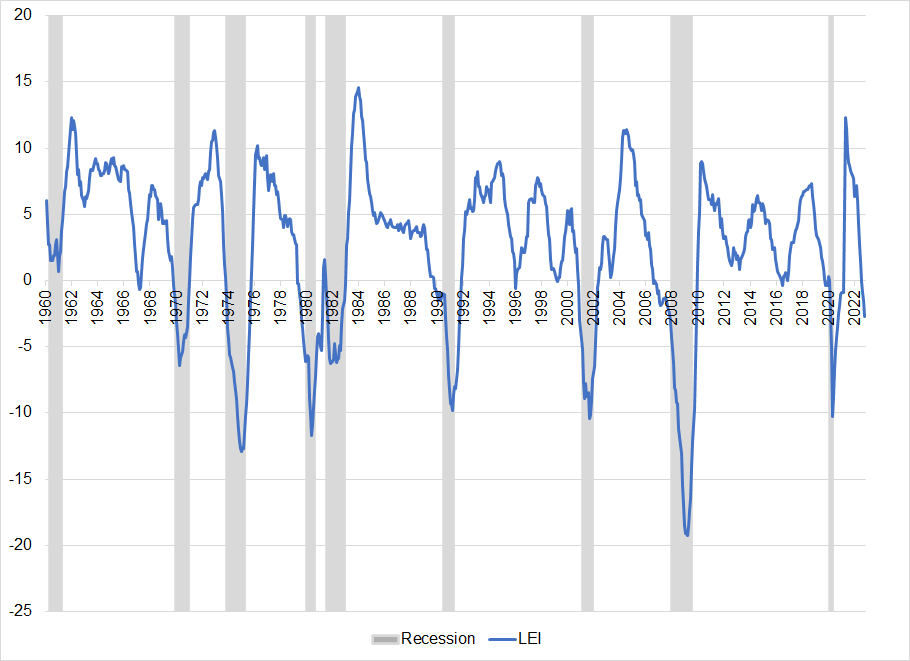
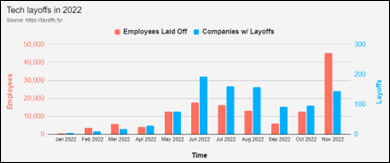
Recessionary signs
Counterarguments
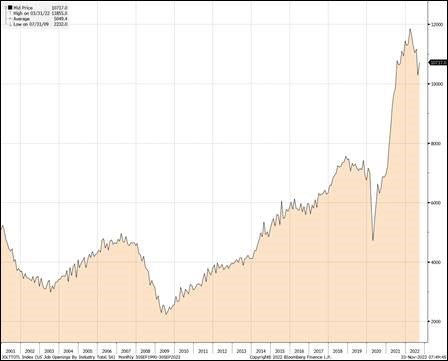
The counterarguments are pretty good. Until US job market slack is absorbed, the long lags between inversion and recession are just about untradable. It’s early to position for recession, even if one might be inevitable. Watch for a turn in Initial Claims, especially after today’s 240k print, as a sign that the job market shortage is being absorbed and it’s game on for recession trades. The best recession trade is short cross/JPY.
What other high-frequency signs are you watching for potential US recession? Please email me.
Are we sure that the EU energy crisis is over? Are we sure that China is reopening? I don’t think so.
An interesting thread on two schools of AI ethics. Short read, about 5 minutes.
One of the best Twitter threads I’ve ever read about trading.
This painting is called “The Ambassadors” and was painted by Hans Holbein the Younger in 1533. The distorted skull is rendered in anamorphic perspective.
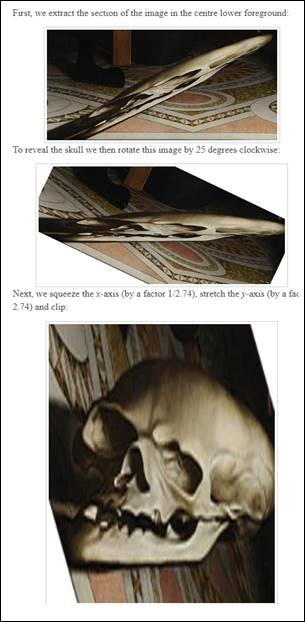
https://thatsmaths.com/2015/09/10/holbeins-anamorphic-skull/
Get your very own hand painted reproduction here!
