No Excess
A term that was popular in 2021 and 2023 but has lost favor of late is “excess savings”. In 2021, stimmies drove excess savings to the moon and the probability of recession to zero. You can see the evolution of the “excess savings” story in the first chart today. Fear increased in mid-2023 that these savings had been spent and the American consumer was tapped out. This pushed recession odds up to 70%. Slowly, people either realized that the calculations were wrong, or just decided excess savings didn’t matter.
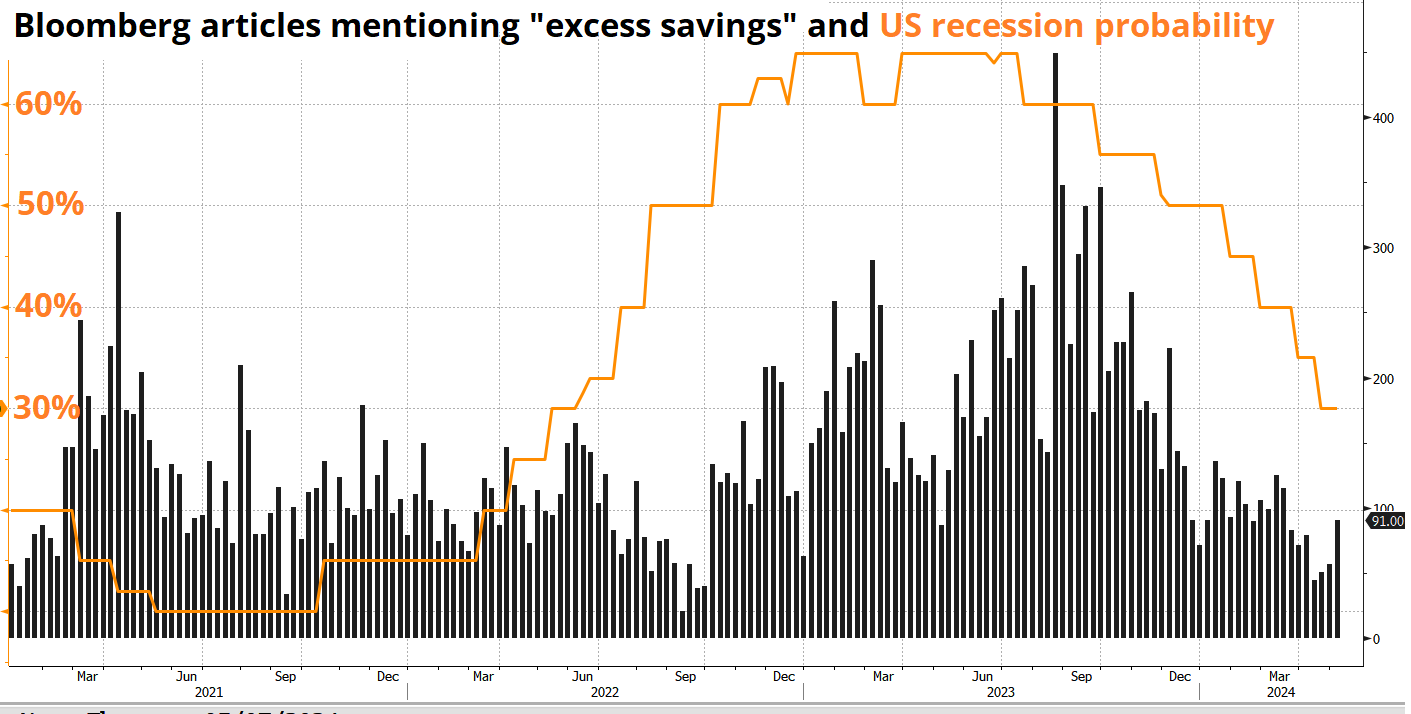
Thing is, the San Francisco Fed’s research contradicted the pessimistic estimates of mid-2023, declaring excess savings were still in $500B area. Now, the SF Fed has announced that excess savings are gone. They have, in fact, turned modestly negative. It’s hard to say whether or not this figure is accurate (the SF Fed explains that many assumptions go into the calculation), but if it’s close, that’s another reason to expect slower growth and a less robust consumer.
The finding from the SF Fed is consistent with recent earnings calls that suggest consumers are trading down and feeling less confident. Consumers trading down can be disinflationary and negative for growth.
Here are the key charts that feed into the report: Pandemic Savings are Gone.
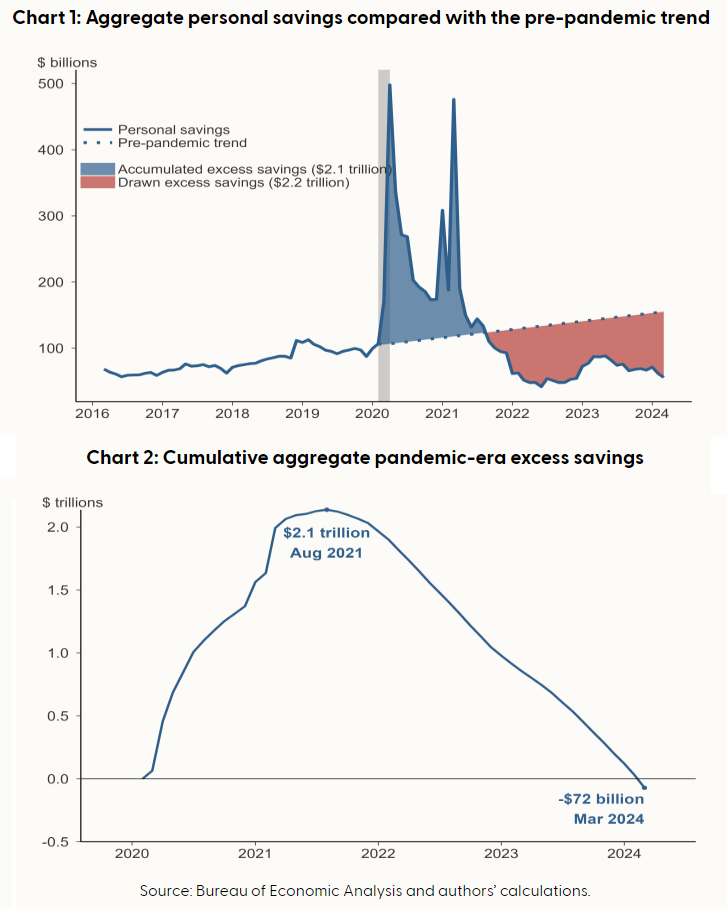
Something to think about as the jobs market looks cooler and consumers may be set to retrench.
Gold
The headline writers sometimes have a choice. Today, they chose this:
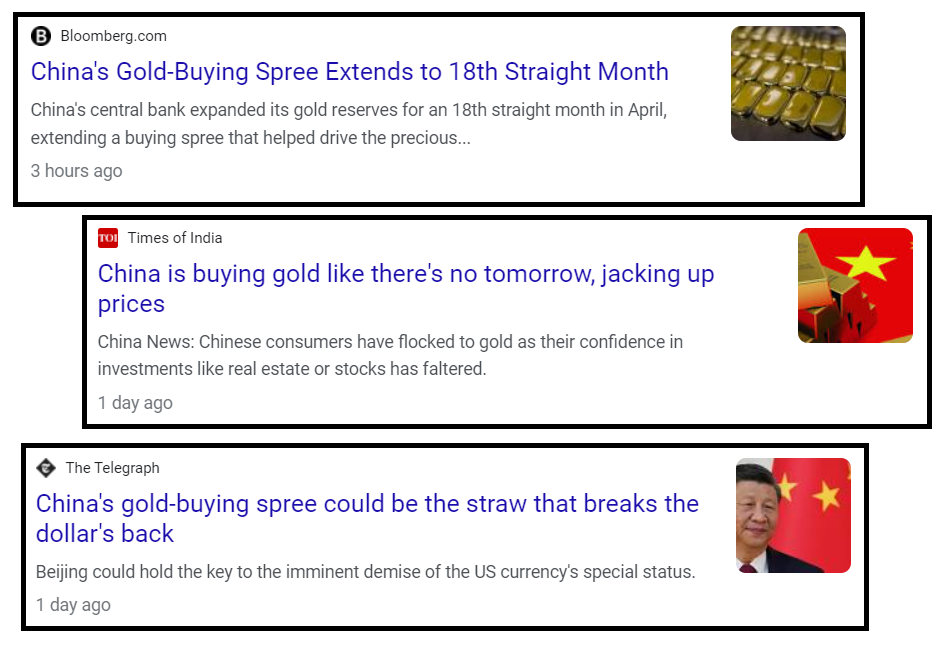
But looking at the actual data, you might argue that a more appropriate headline would be “China gold buying slows from a flood to a trickle” or “China gold buying fizzles: Is that all Xi wrote?” Anyhoo, here’s the chart:
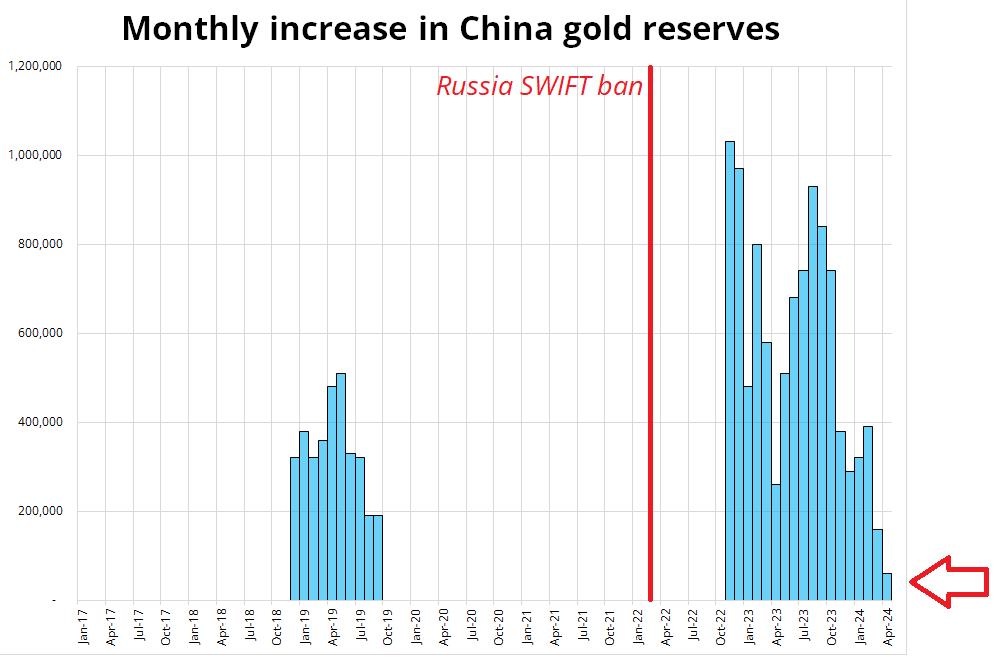
If I were long gold because “China buying” I’d be less confident today, not more. Technically accurate but somewhat misleading headlines from the financial media are one of many, many (!) topics we cover in Spectra School’s first course: Think Like a Market Professional. The course goes live in the next two weeks. Anyone on the waitlist gets $250 off the $1200 sticker price for lifetime access. Sign up for the waitlist here, with no obligation, and we’ll let you know when the rocket is go for launch.
Final Thoughts
I sold the short-term hole in USDJPY and half my short is stopped out. I thought the bounce off 152 was enough to relieve the oversold condition from Friday’s jobs report, but I was wrong. Still, I continue to believe that yields and the USD are headed lower. USDJPY has been a poor choice so far because cross/JPY is flying higher again. This despite lower yields across the board. With VIX at 13.5 and FX vols low, the carry machines are in gobble gobble mode again.
Here is a new working paper from the SNB… The role of hedge funds in the Swiss franc market. The abstract:
This paper investigates the role of hedge funds within the Swiss franc (CHF) foreign exchange (FX) market, using a novel and comprehensive flow dataset that covers a large proportion of the CHF FX market. Employing a two-stage-least-squares (2SLS) approach, I isolate the causal effect of hedge funds’ net flow on CHF returns, taking into account reverse causality. The analysis reveals that hedge funds’ net flow significantly impacts CHF returns, with a net buying of one billion leading to an approximate 0.4% increase in returns. In contrast, the net flow from other market participants has a negligible impact, even when potential reverse causality is dismissed. The analysis of market participants’ trading prices substantiates the hypothesis that hedge funds, due to their expertise in FX forecasting and best execution as well as superior transaction timing abilities, in aggregate tend to trade at more advantageous prices than other market participants.
Finally, the Positioning Report is below.
Have a twelve-sided day.
The Spectra FX Positioning and Momentum Report
Off the boil
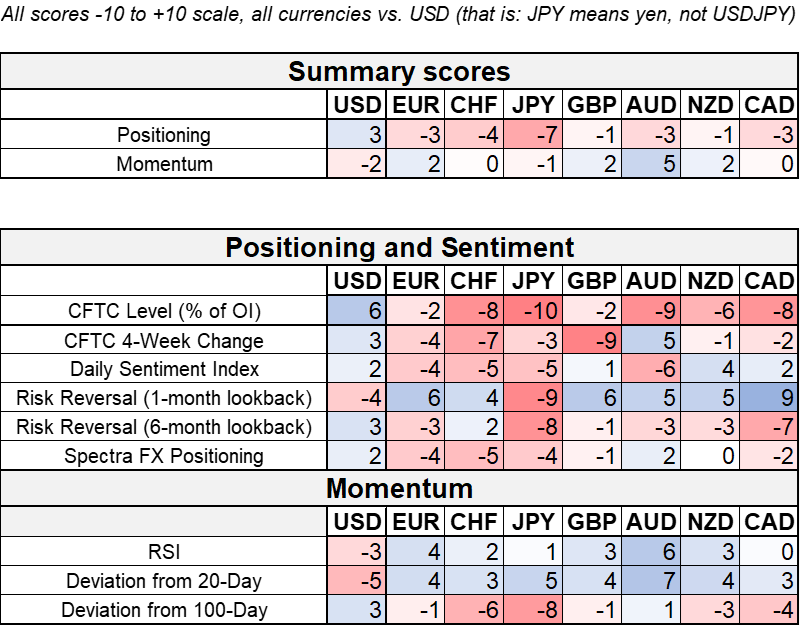
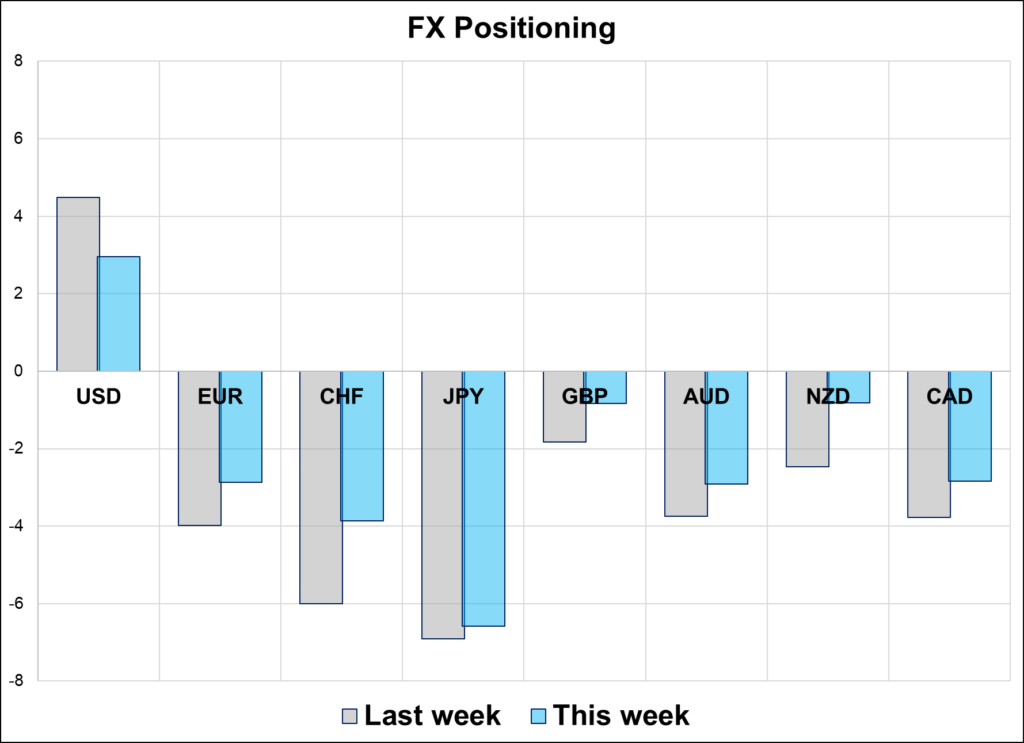
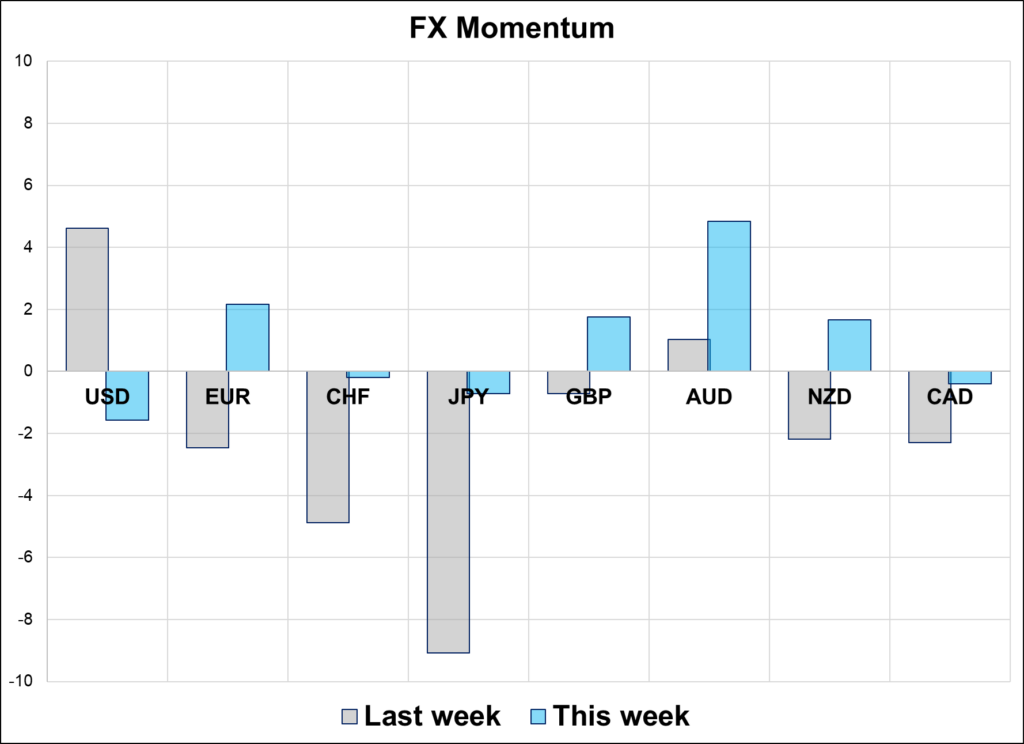
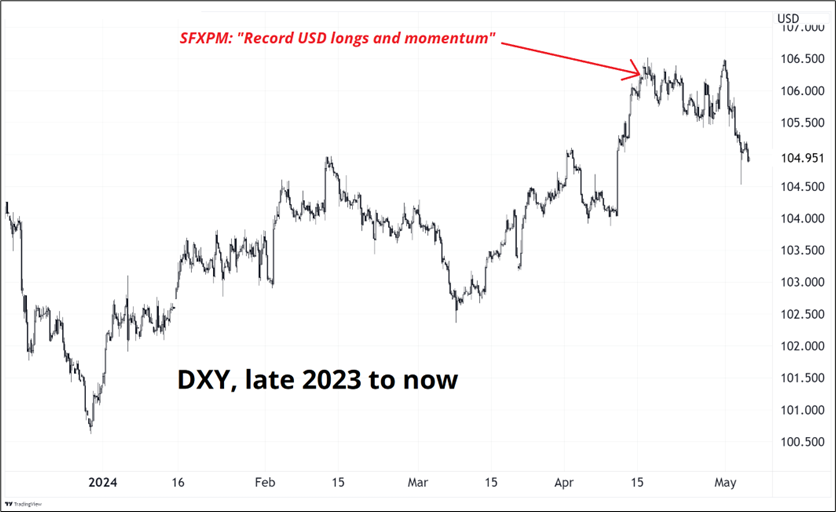
Hi. Welcome to this week’s report. The extreme USD positioning has cooled as momentum flips and the market will only stay max long USD when momentum is max bullish USD. And it’s not. You can see in the blue and gray momentum chart on page three how USD momentum has reversed considerably. This is not just about positioning, we got a weaker NFP and a dovish Fed reaction function over the past week, too.
Two Observations
1. It’s too early to declare victory, but the extreme USD readings in this report have been pretty good overall. The April 15 positioning report coincided with the ding dong highs in the USD so far. I don’t point this out as a victory lap because the output is systematic, but it’s useful for future reference. If the USD keeps going down, that would mean the extreme USD reading in our report goes 5 for 6. Let’s see.
My experience historically (including using the internal positioning report at Lehman Brothers) is that super mega extremes in USD positioning that only hit once or twice per year tend to be turning points. The other takeaway from running this report since October 2022 is that the CFTC is bad at trading GBP.
Readers who follow my stuff are probably thinking about The Cheer Hedge right now. :]
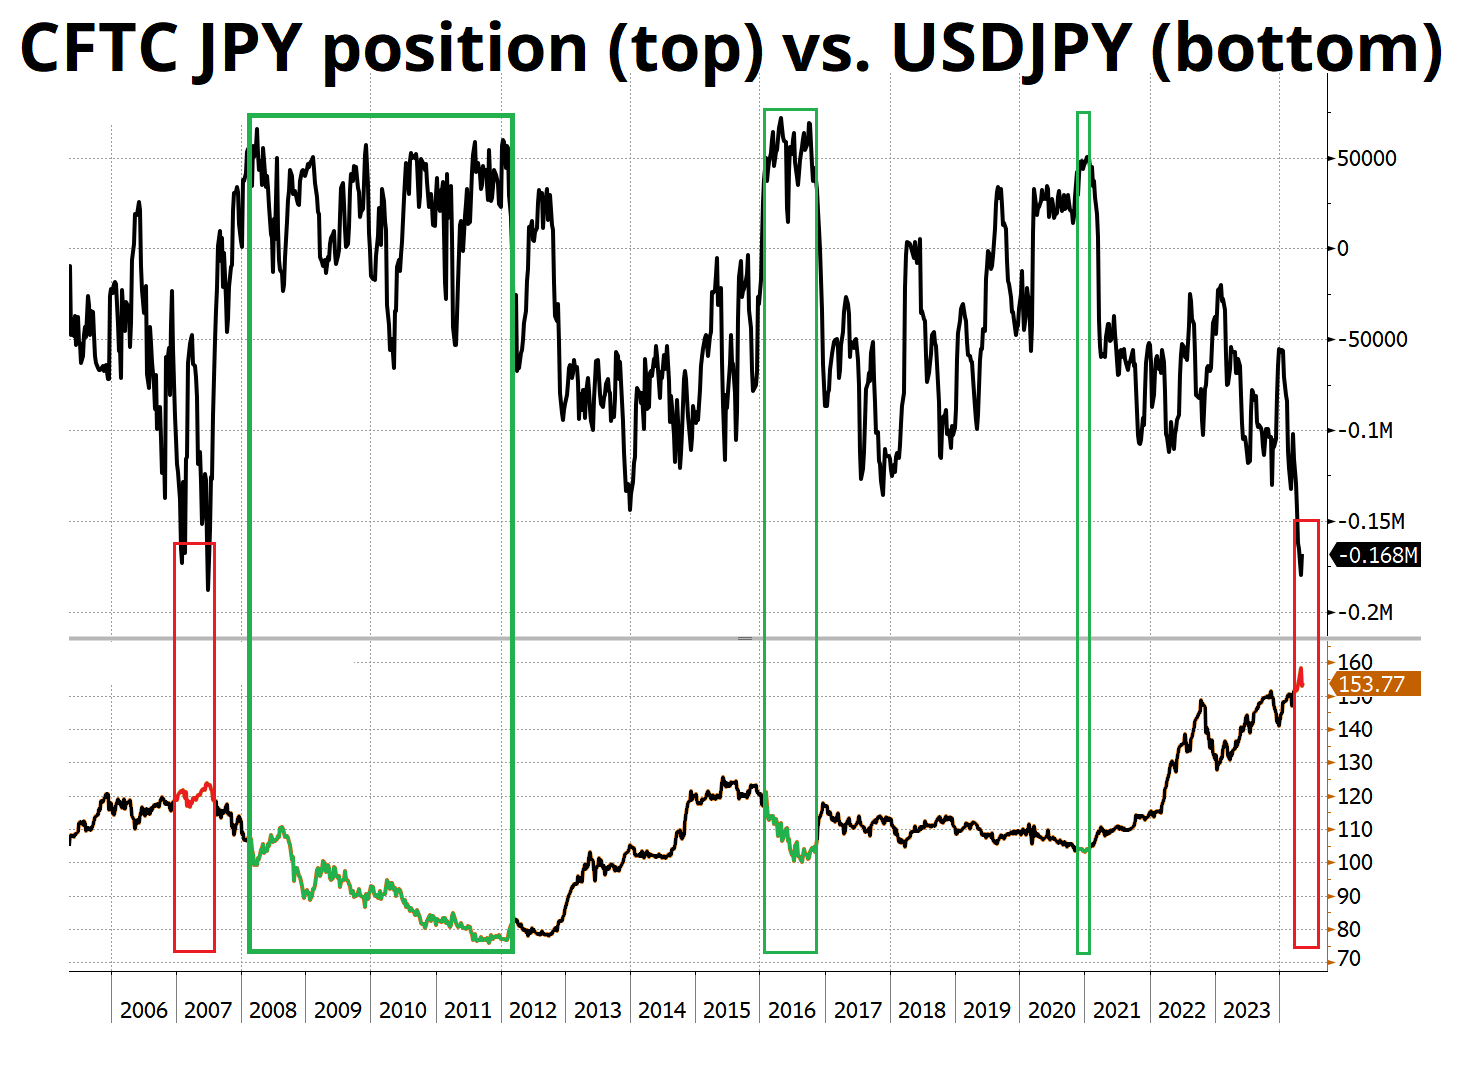
2. While the carry fest of the past 18 months reminds me of the carry fest in 2006/2007, it’s worth noting that the CFTC was an OK indicator for a long time before USDJPY turned. This tends to be the case. When USDJPY is trending, the CFTC catches it. They get to an extreme position, but that extreme doesn’t always mean a turn is imminent. Here’s the comparison of USDJPY and CFTC positioning.
Further below, I show CFTC JPY positions and USDJPY.
The first thing you will notice is that JPY shorts get bigger than JPY longs (50k max vs. 150k max). This is because CTAs don’t like to be short carry, as a rule. They are mostly trend following and long carry. The second thing to notice is that extreme positioning identifies the trend, and only sometimes identifies the end of the trend. In other words, the CTAs get it right when USDJPY is trending and reach an extreme position at some point before the trend turns.
You can see that 2006/2007 positioning was similar to now and they made money for six months in 2007 before getting destroyed. Then, they went long JPY and weathered a 10-big-figure contra move before riding the trend for four years.
The extreme long JPY in 2016 was less profitable but still worked for months, while the extreme long JPY in 2020 bore no fruit. So what we have here is sufficient but not anywhere close to guaranteed reversal conditions. With VIX at 13.8 and 1-month USDJPY vol at 9.25%, the CTAs are going to hold on for dear life. The 1-year carry remains around 5%, though it’s worth noting that the 2-year rate differential has contracted from 4.8% to 4.5% and the MOF has introduced some tricky vol-of-vol.